Schematic overview of the cellular and molecular mechanisms involved in the cancer progression, including the proposed cellular and molecular mechanisms in cancer cells trajectory. AT1: alveolar type 1 cells; AT2: alveolar type 2 cells; AAH: atypical adenomatous hyperplasia; AIS: adenocarcinoma in situ; MIA: minimally invasive adenocarcinoma; IA: invasive adenocarcinoma; EMT: epithelial-mesenchymal transition

Home

Download

Statistics

Help

Contact

Center for Computational Systems Medicine
leaf

Gene summary

leaf

Malignant transformation analysis

leaf

Malignant transformation related pathway analysis

leaf

Cell-cell communication analysis

leaf

Single-cell gene regulatory network inference analysis

leaf

Somatic mutation of malignant transformation related genes

leaf

Related drugs of malignant transformation related genes

Gene: PPP1R10

Gene summary for PPP1R10

check button Gene summary.

Gene informationSpeciesHuman
Gene symbol

PPP1R10

Gene ID

5514

Gene nameprotein phosphatase 1 regulatory subunit 10
Gene AliasCAT53
Cytomap6p21.33
Gene Typeprotein-coding
GO ID

GO:0000075

UniProtAcc

Q2L6I0


Top

Malignant transformation analysis

check button Identification of the aberrant gene expression in precancerous and cancerous lesions by comparing the gene expression of stem-like cells in diseased tissues with normal stem cells
check button Malignant transformation involving gene list.
Entrez IDSymbolReplicatesSpeciesOrganTissueAdj P-valueLog2FCMalignancy
5514PPP1R10AEH-subject1HumanEndometriumAEH1.50e-295.66e-01-0.3059
5514PPP1R10AEH-subject2HumanEndometriumAEH2.06e-052.42e-01-0.2525
5514PPP1R10AEH-subject3HumanEndometriumAEH2.46e-072.72e-01-0.2576
5514PPP1R10AEH-subject4HumanEndometriumAEH6.11e-031.89e-01-0.2657
5514PPP1R10EEC-subject1HumanEndometriumEEC9.04e-052.18e-01-0.2682
5514PPP1R10EEC-subject3HumanEndometriumEEC2.17e-08-6.64e-02-0.2525
5514PPP1R10EEC-subject4HumanEndometriumEEC7.27e-041.91e-01-0.2571
5514PPP1R10GSM5276934HumanEndometriumEEC7.25e-215.61e-01-0.0913
5514PPP1R10GSM5276937HumanEndometriumEEC2.95e-134.91e-01-0.0897
5514PPP1R10GSM6177620_NYU_UCEC1_lib1_lib1HumanEndometriumEEC1.86e-12-3.58e-01-0.1869
5514PPP1R10GSM6177620_NYU_UCEC1_lib2_lib2HumanEndometriumEEC2.31e-13-4.09e-01-0.1875
5514PPP1R10GSM6177620_NYU_UCEC1_lib3_lib3HumanEndometriumEEC7.34e-13-3.66e-01-0.1883
5514PPP1R10GSM6177621_NYU_UCEC2_lib1_lib1HumanEndometriumEEC1.11e-18-2.31e-01-0.1934
5514PPP1R10GSM6177622_NYU_UCEC3_lib1_lib1HumanEndometriumEEC1.12e-23-2.23e-01-0.1917
5514PPP1R10GSM6177622_NYU_UCEC3_lib2_lib2HumanEndometriumEEC3.85e-21-1.34e-01-0.1916
5514PPP1R10LZE2DHumanEsophagusHGIN4.26e-027.52e-020.0642
5514PPP1R10LZE4THumanEsophagusESCC1.32e-125.96e-010.0811
5514PPP1R10LZE5THumanEsophagusESCC6.93e-074.48e-010.0514
5514PPP1R10LZE7THumanEsophagusESCC1.15e-077.94e-010.0667
5514PPP1R10LZE8THumanEsophagusESCC1.31e-085.57e-010.067
Page: 1 2 3 4 5 6 7 8 

check button Transcriptomic changes along malignancy continuum.
TissueExpression DynamicsAbbreviation
EndometriumThe image shows the transcriptomic changes along malignancy continuum.log2FC in expression of this searched gene in stem-like cells from each diseased tissue sample relative to stem-like cells in normal samples in each tissue plotted against the malignancy continuum. Samples are colored based on if they are from different disease stage.
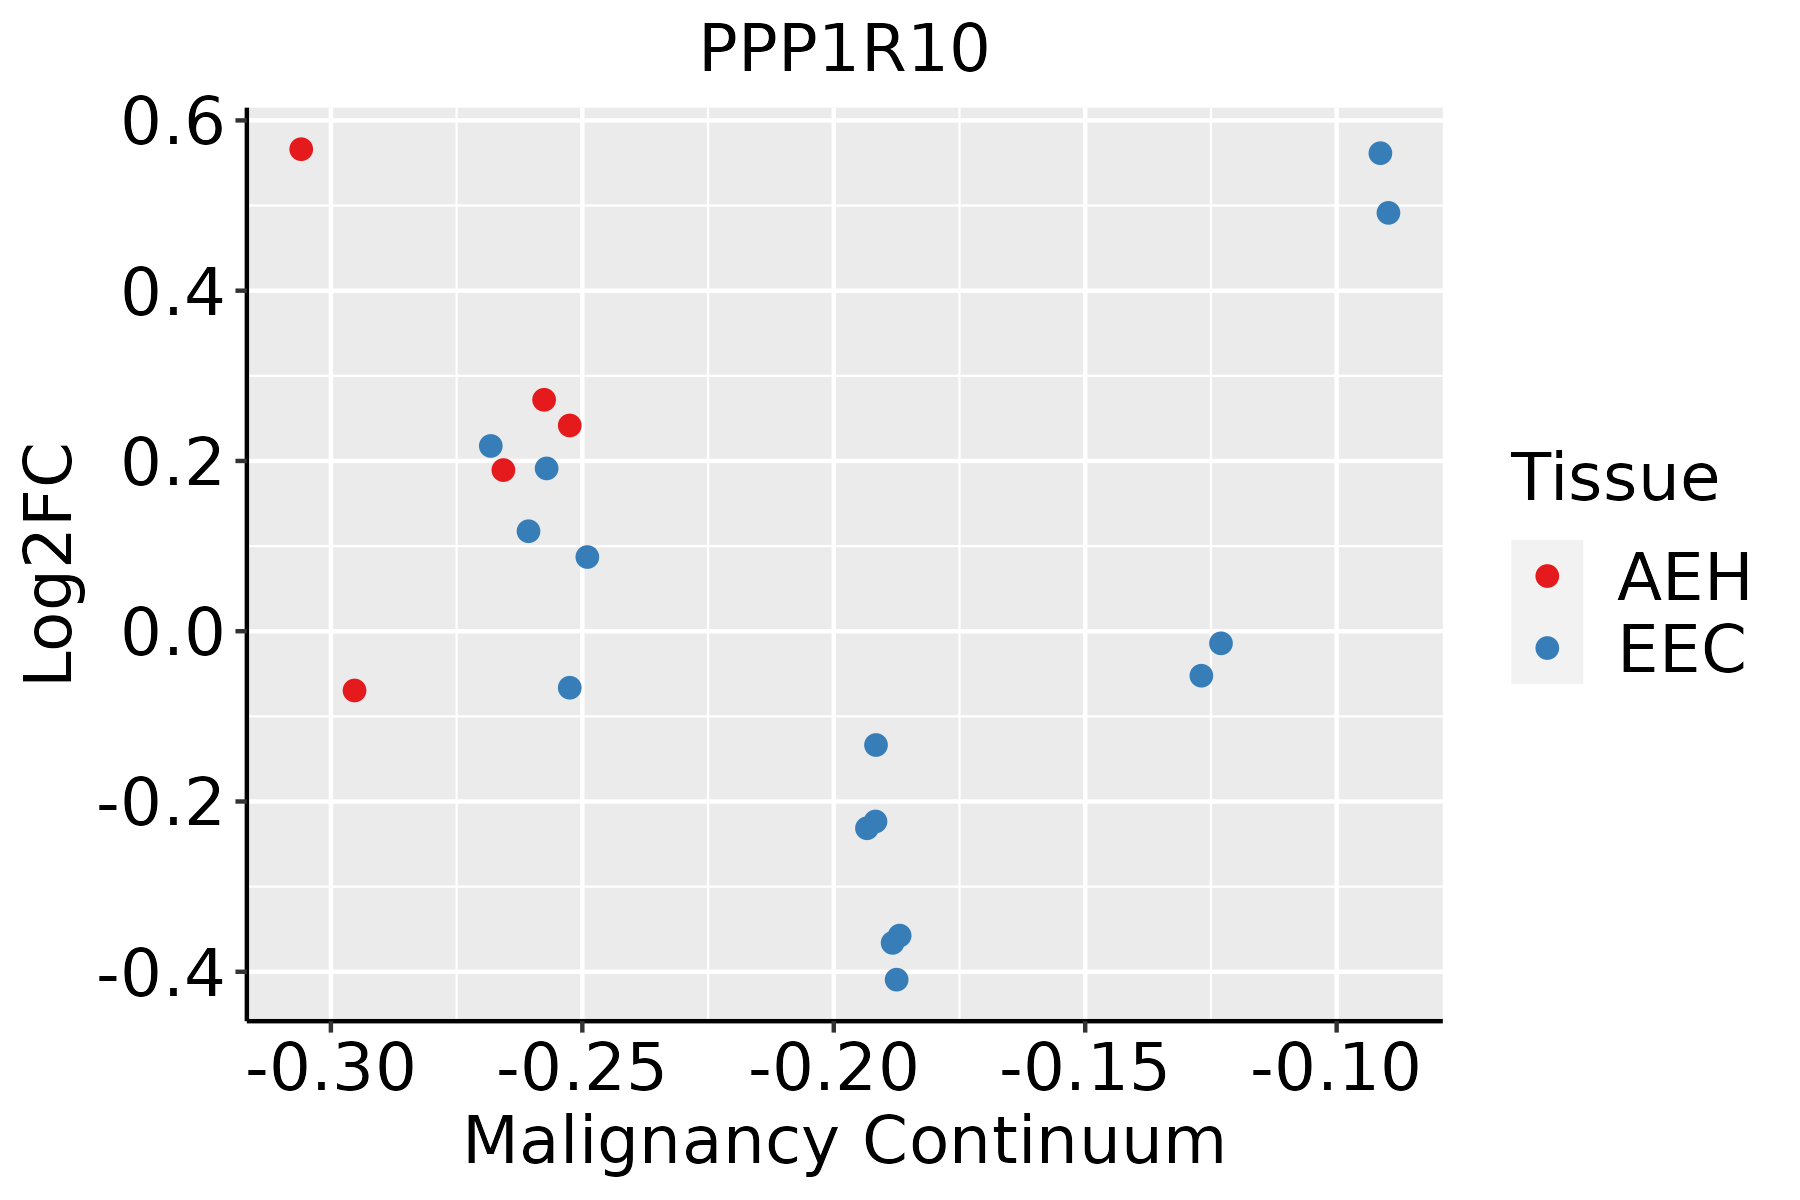
AEH: Atypical endometrial hyperplasia
EEC: Endometrioid Cancer
EsophagusThe image shows the transcriptomic changes along malignancy continuum.log2FC in expression of this searched gene in stem-like cells from each diseased tissue sample relative to stem-like cells in normal samples in each tissue plotted against the malignancy continuum. Samples are colored based on if they are from different disease stage.
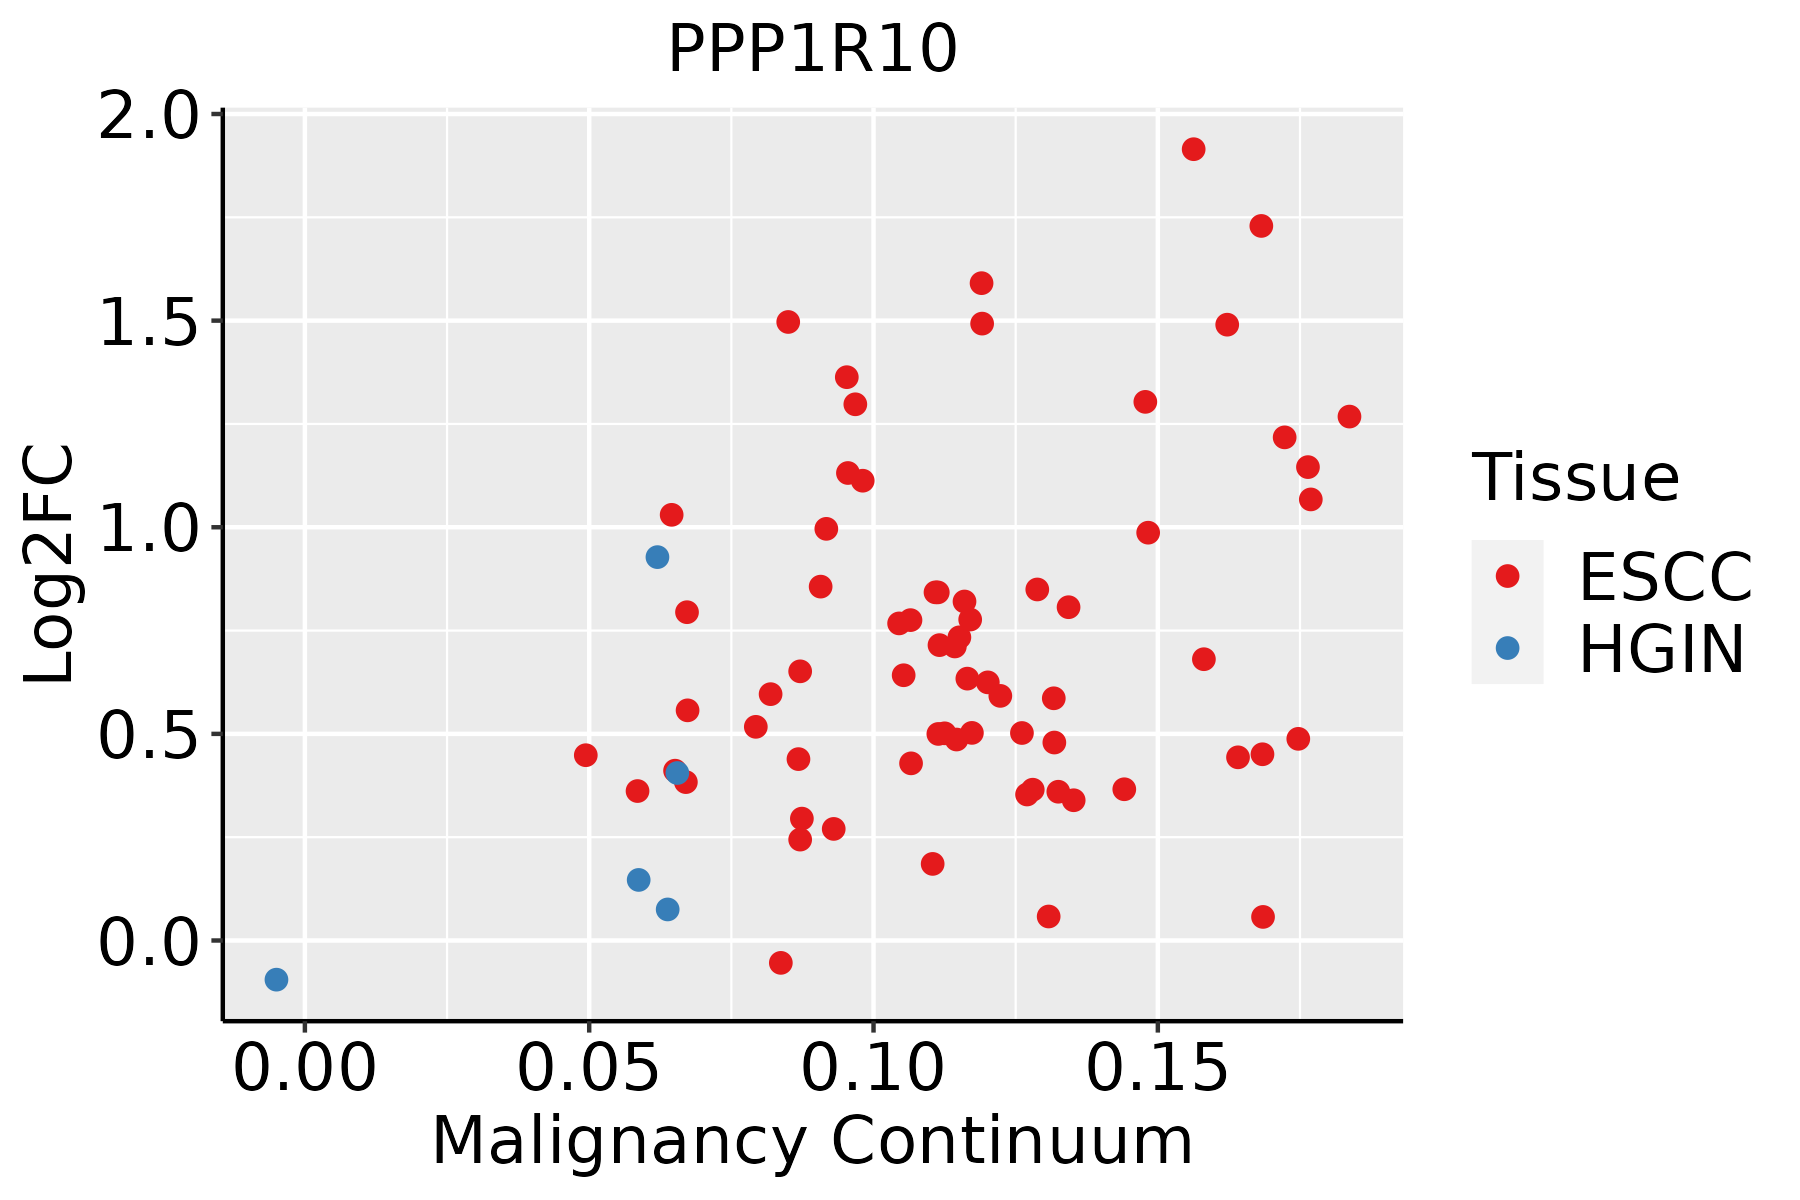
ESCC: Esophageal squamous cell carcinoma
HGIN: High-grade intraepithelial neoplasias
LGIN: Low-grade intraepithelial neoplasias
LiverThe image shows the transcriptomic changes along malignancy continuum.log2FC in expression of this searched gene in stem-like cells from each diseased tissue sample relative to stem-like cells in normal samples in each tissue plotted against the malignancy continuum. Samples are colored based on if they are from different disease stage.
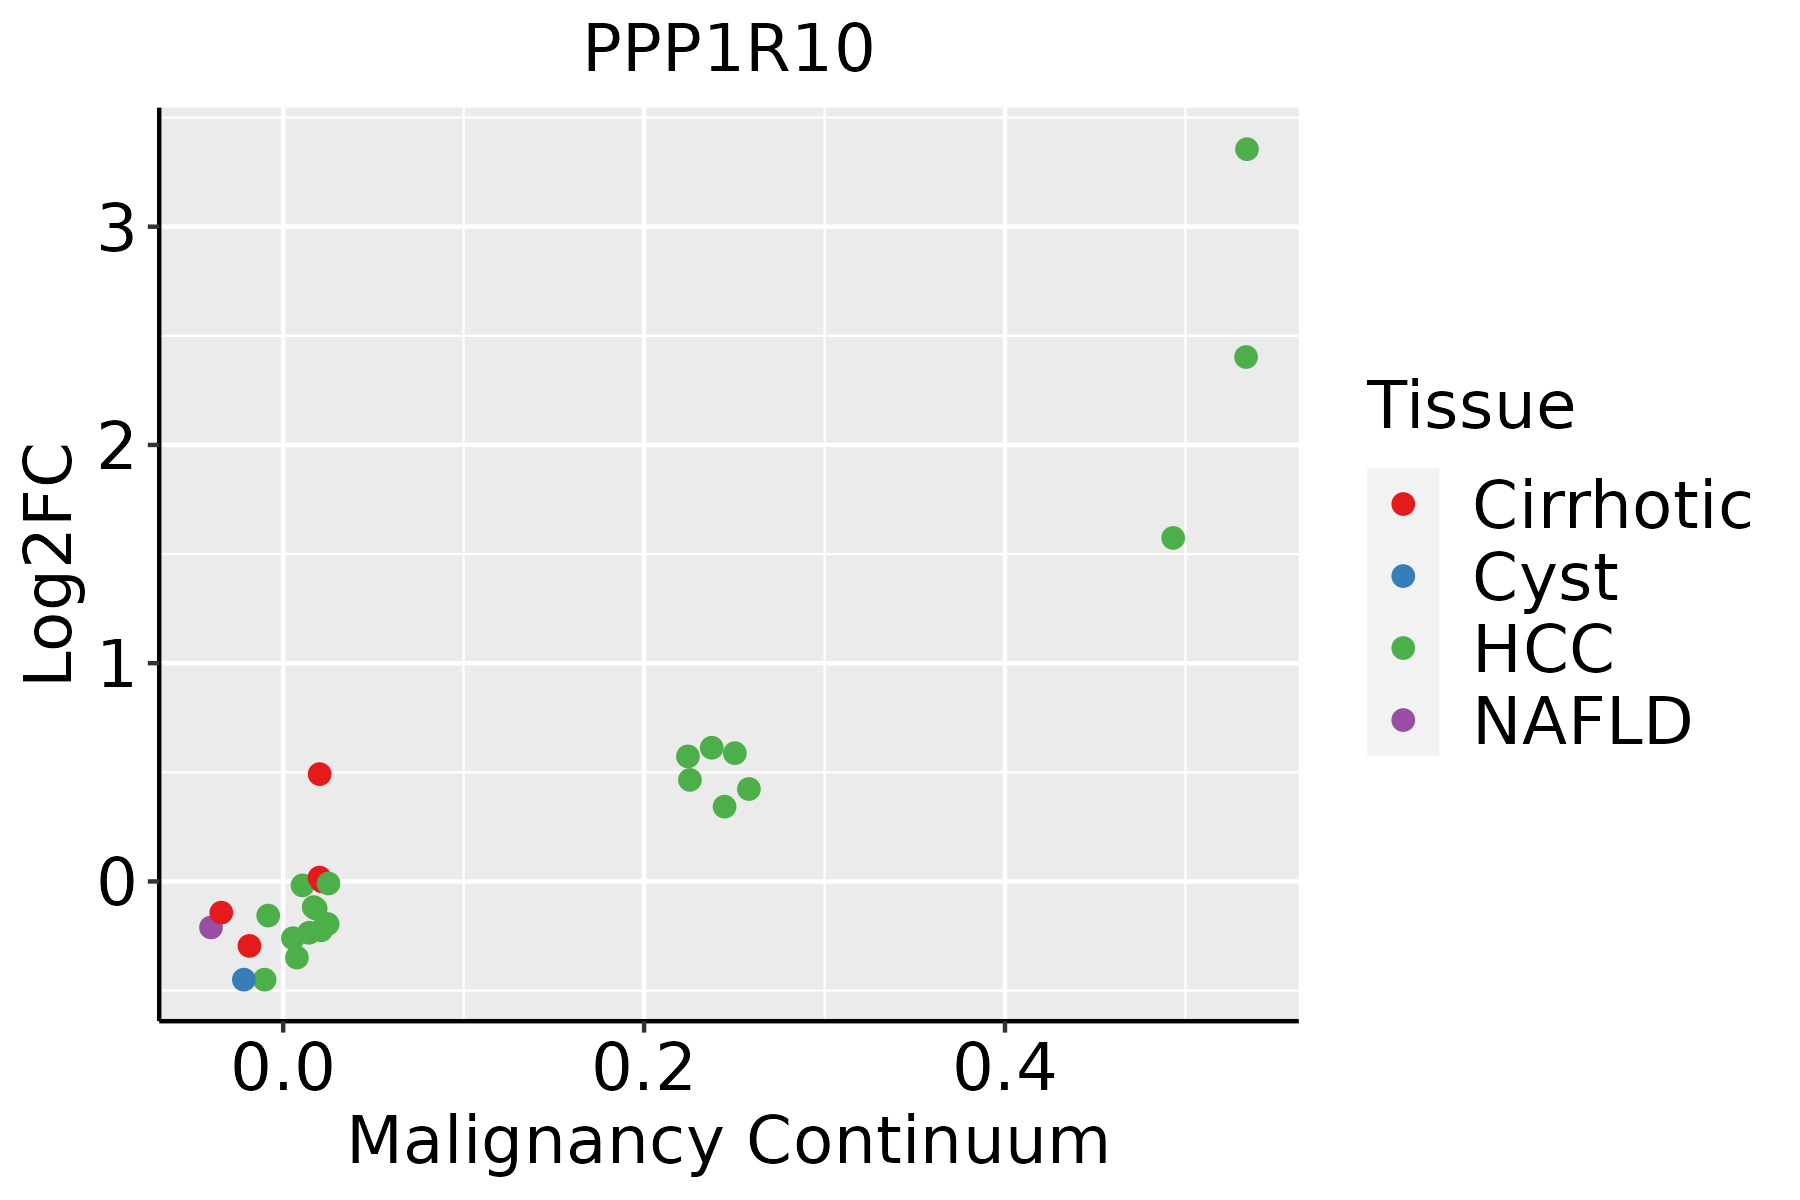
HCC: Hepatocellular carcinoma
NAFLD: Non-alcoholic fatty liver disease
LungThe image shows the transcriptomic changes along malignancy continuum.log2FC in expression of this searched gene in stem-like cells from each diseased tissue sample relative to stem-like cells in normal samples in each tissue plotted against the malignancy continuum. Samples are colored based on if they are from different disease stage.AAH: Atypical adenomatous hyperplasia
AIS: Adenocarcinoma in situ
IAC: Invasive lung adenocarcinoma
MIA: Minimally invasive adenocarcinoma
Oral CavityThe image shows the transcriptomic changes along malignancy continuum.log2FC in expression of this searched gene in stem-like cells from each diseased tissue sample relative to stem-like cells in normal samples in each tissue plotted against the malignancy continuum. Samples are colored based on if they are from different disease stage.
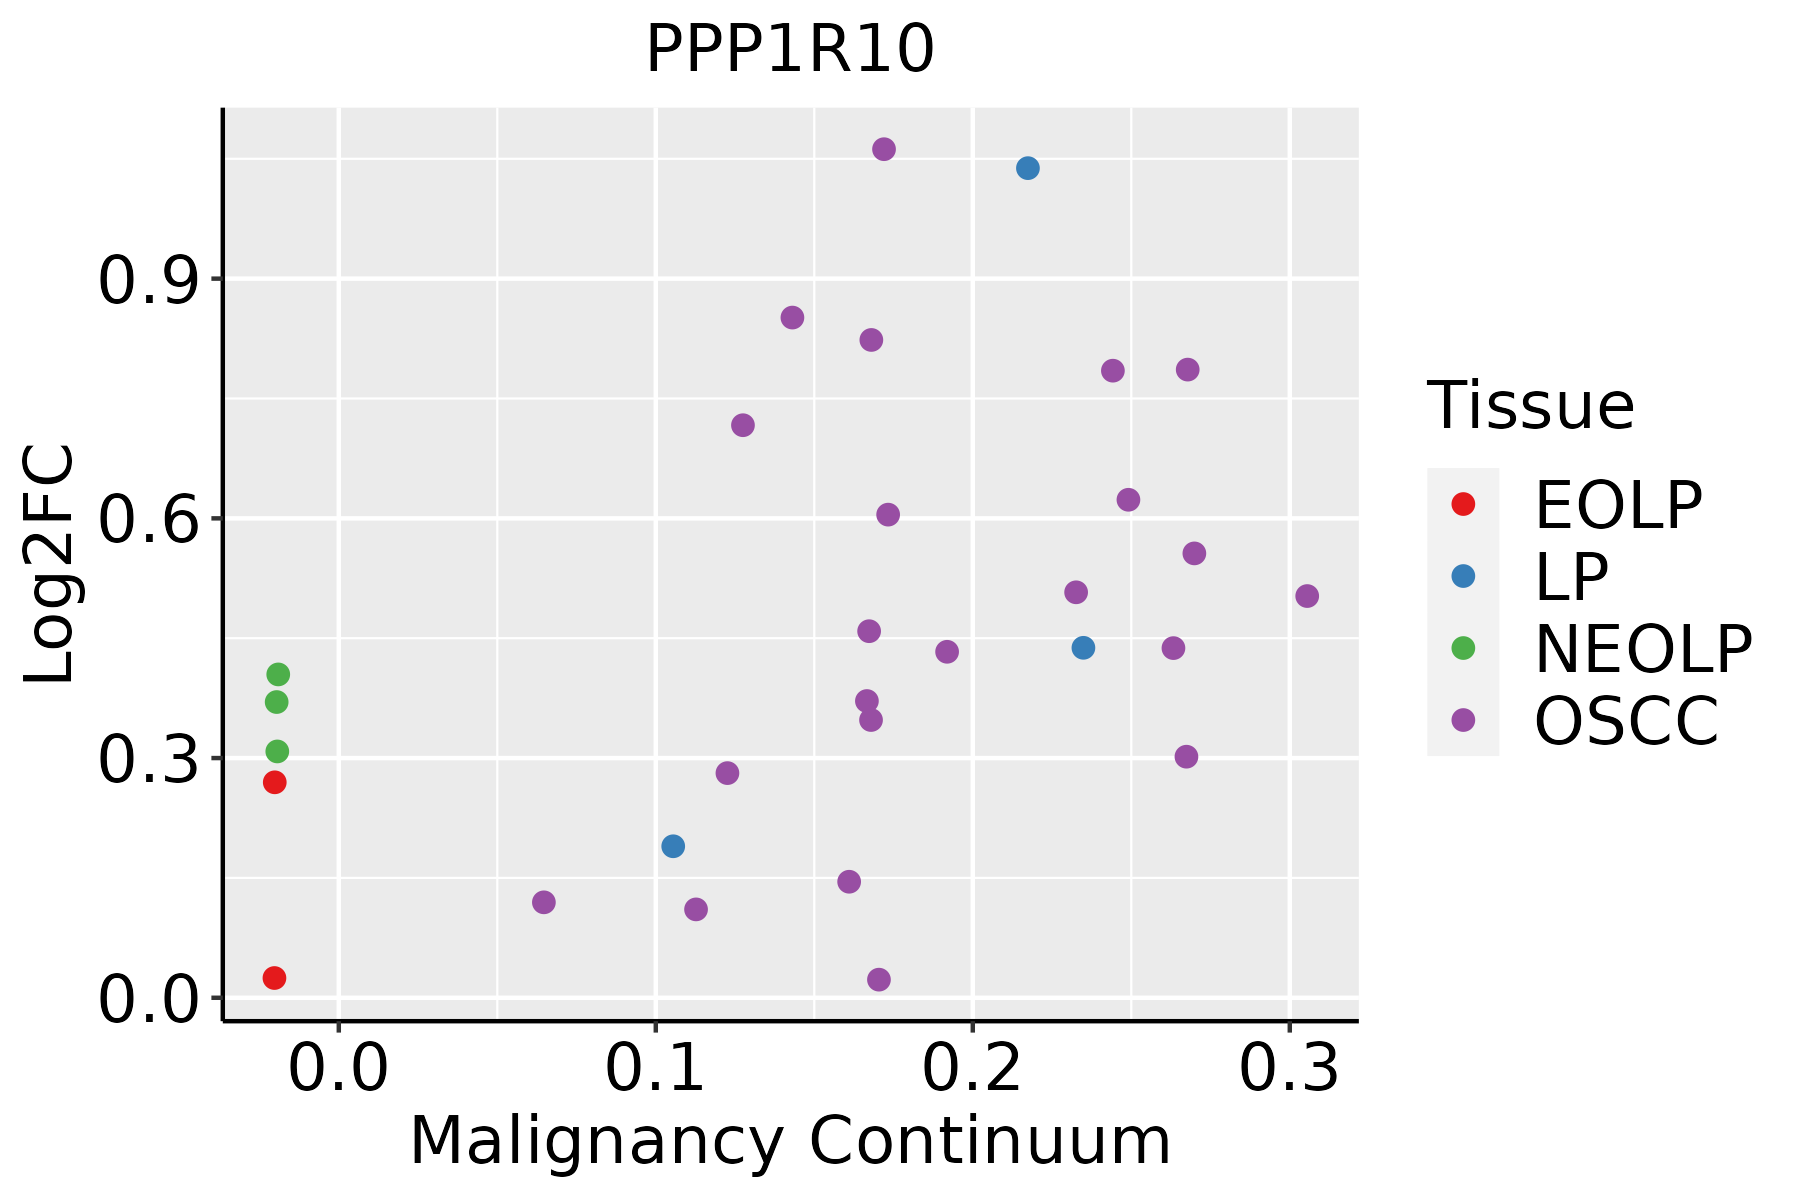
EOLP: Erosive Oral lichen planus
LP: leukoplakia
NEOLP: Non-erosive oral lichen planus
OSCC: Oral squamous cell carcinoma
ProstateThe image shows the transcriptomic changes along malignancy continuum.log2FC in expression of this searched gene in stem-like cells from each diseased tissue sample relative to stem-like cells in normal samples in each tissue plotted against the malignancy continuum. Samples are colored based on if they are from different disease stage.
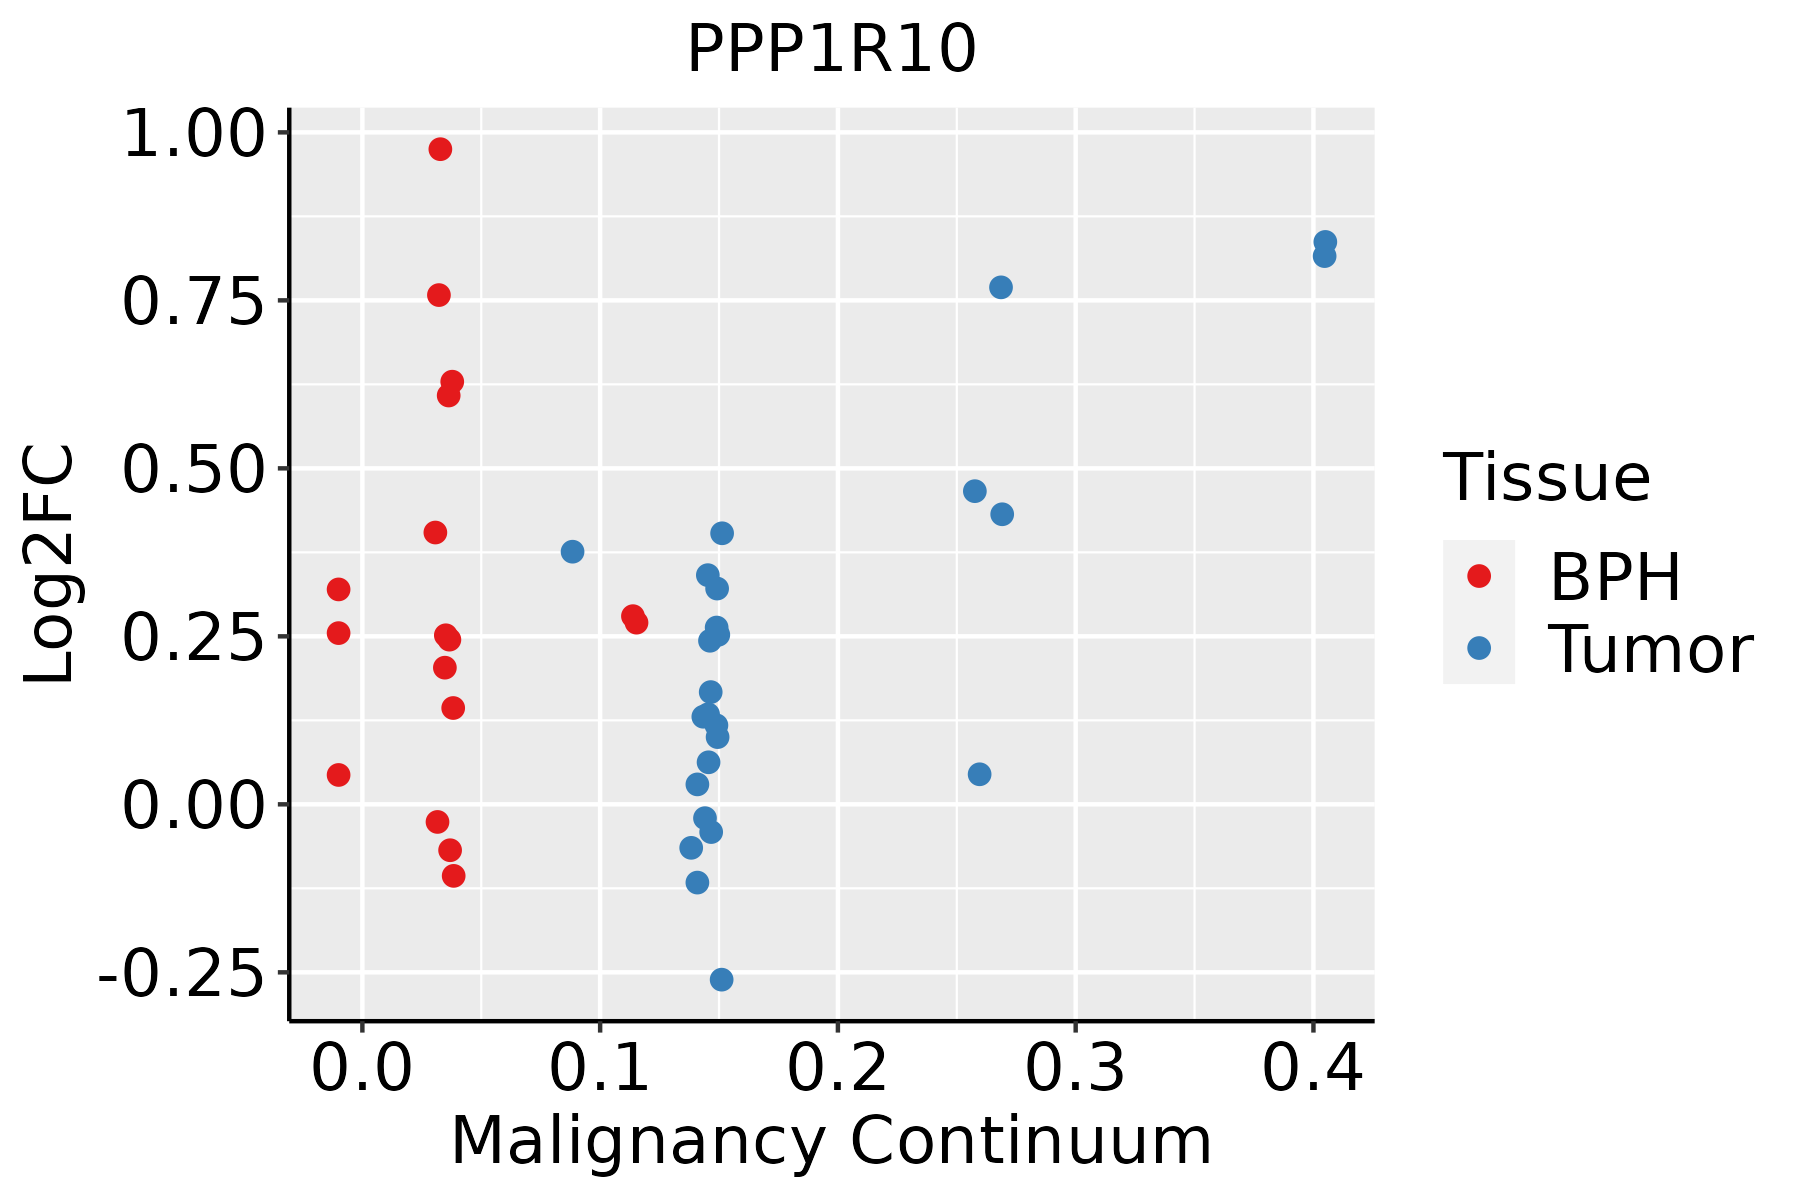
BPH: Benign Prostatic Hyperplasia
SkinThe image shows the transcriptomic changes along malignancy continuum.log2FC in expression of this searched gene in stem-like cells from each diseased tissue sample relative to stem-like cells in normal samples in each tissue plotted against the malignancy continuum. Samples are colored based on if they are from different disease stage.
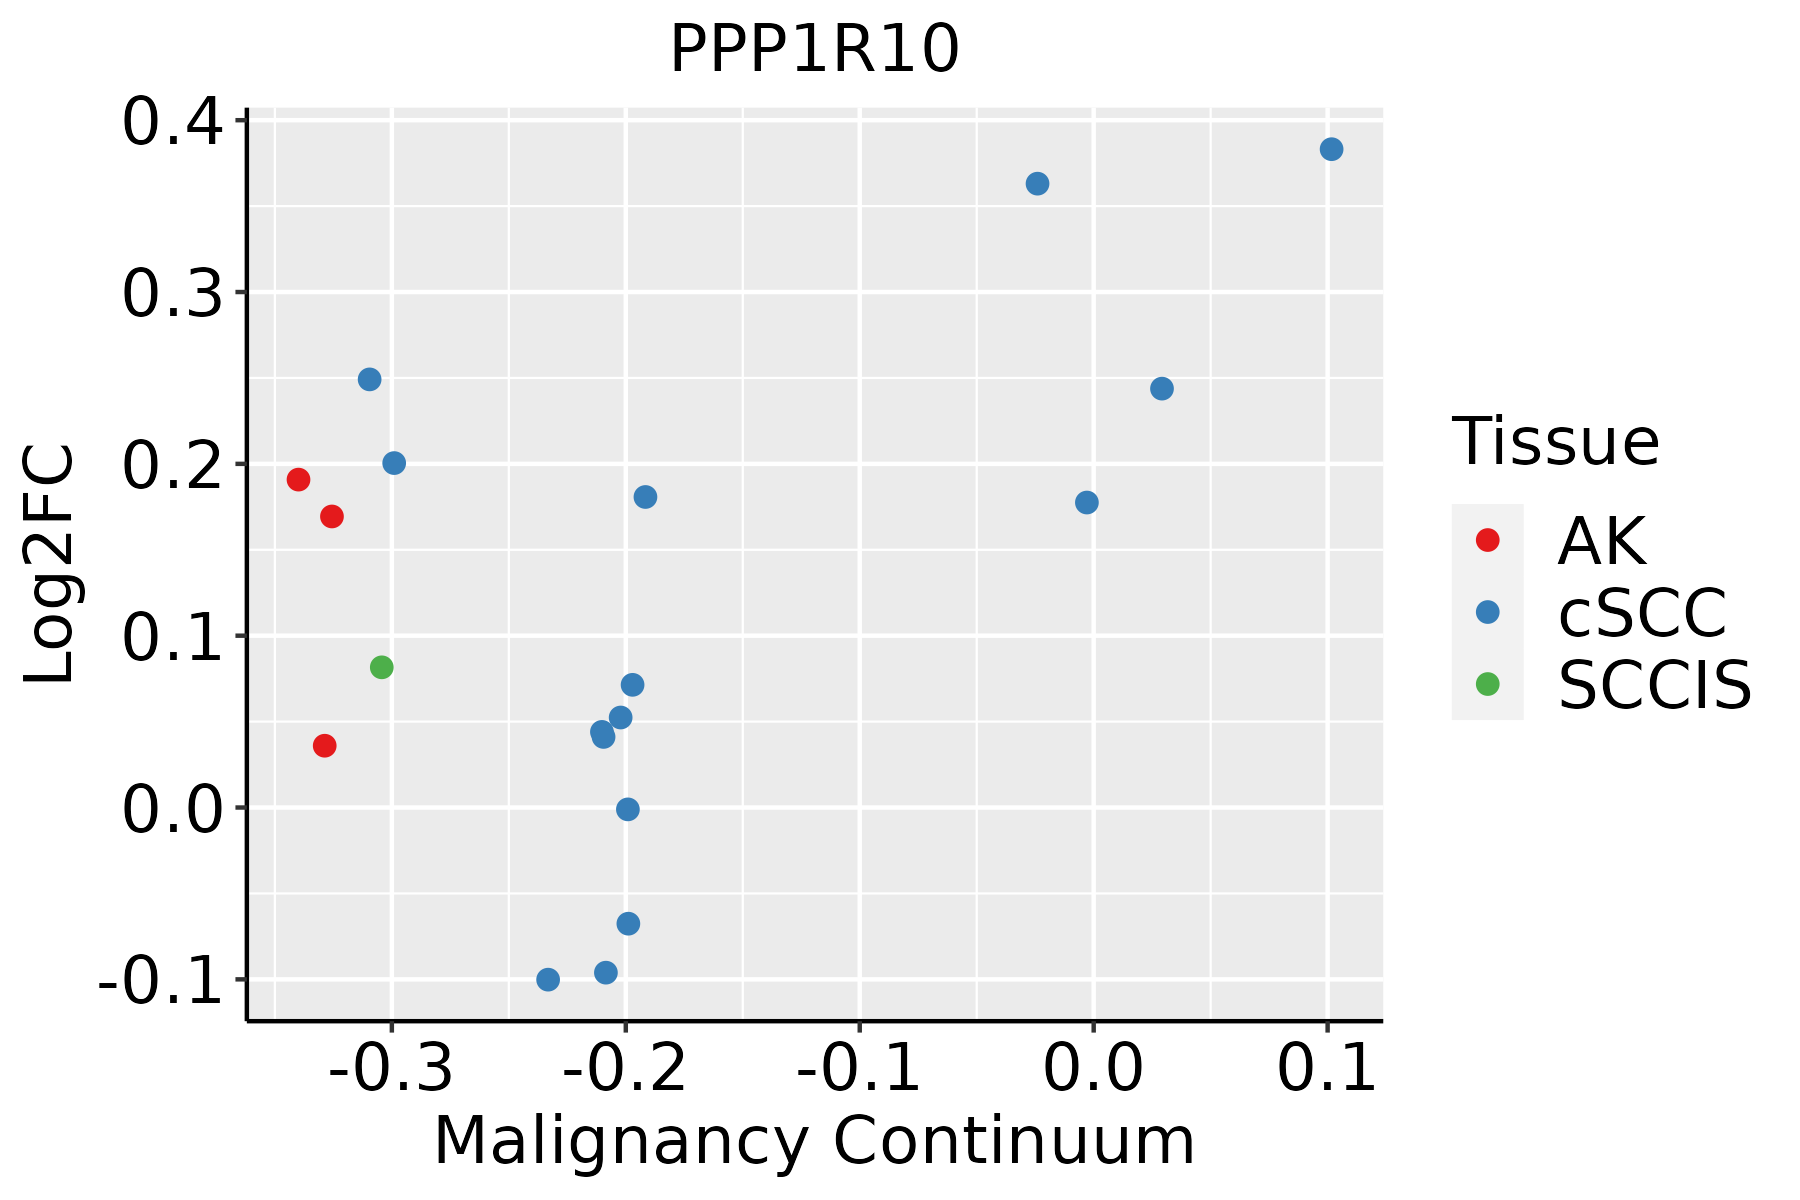
AK: Actinic keratosis
cSCC: Cutaneous squamous cell carcinoma
SCCIS:squamous cell carcinoma in situ
ThyroidThe image shows the transcriptomic changes along malignancy continuum.log2FC in expression of this searched gene in stem-like cells from each diseased tissue sample relative to stem-like cells in normal samples in each tissue plotted against the malignancy continuum. Samples are colored based on if they are from different disease stage.
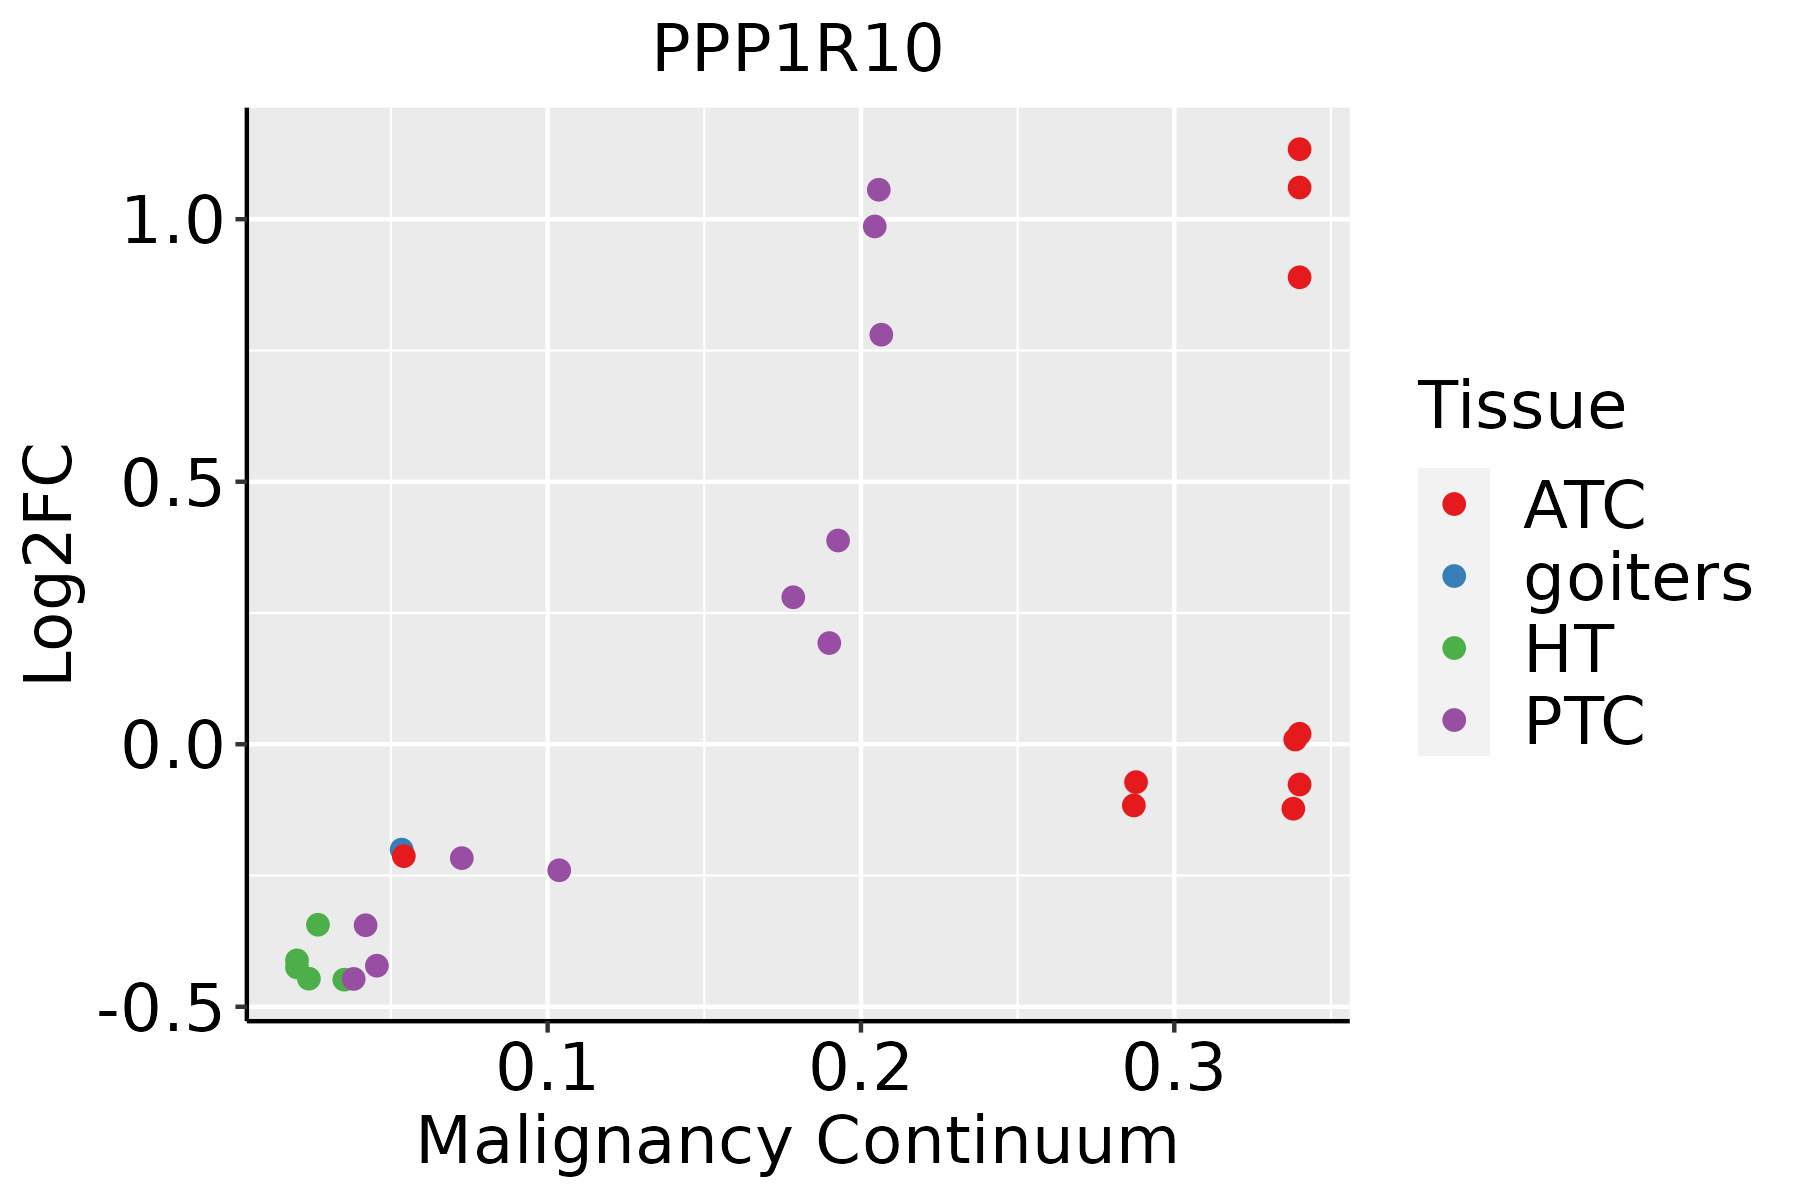
ATC: Anaplastic thyroid cancer
HT: Hashimoto's thyroiditis
PTC: Papillary thyroid cancer
∗log2FC in expression of this searched gene in stem-like cells from each diseased tissue sample relative to stem-like cells in normal samples in each tissue plotted against the malignancy continuum. Samples are colored based on if they are from different disease stage.

Top

Malignant transformation related pathway analysis

check buttonFind out the enriched GO biological processes and KEGG pathways involved in transition from healthy to precancer to cancer
check button Figure of enriched GO biological processes.
TissueDisease StageEnriched GO biological Processes
ColorectumADGO analysis - Figure of enriched GO biological processes: Top 15 enriched GO BP terms are showed in the bar plot of each disease state in each tissue. Each row represents a significant GO biological process which is colored according to the -log10(p.adjust).
ColorectumSERGO analysis - Figure of enriched GO biological processes: Top 15 enriched GO BP terms are showed in the bar plot of each disease state in each tissue. Each row represents a significant GO biological process which is colored according to the -log10(p.adjust).
ColorectumMSSGO analysis - Figure of enriched GO biological processes: Top 15 enriched GO BP terms are showed in the bar plot of each disease state in each tissue. Each row represents a significant GO biological process which is colored according to the -log10(p.adjust).
ColorectumMSI-HGO analysis - Figure of enriched GO biological processes: Top 15 enriched GO BP terms are showed in the bar plot of each disease state in each tissue. Each row represents a significant GO biological process which is colored according to the -log10(p.adjust).
ColorectumFAPGO analysis - Figure of enriched GO biological processes: Top 15 enriched GO BP terms are showed in the bar plot of each disease state in each tissue. Each row represents a significant GO biological process which is colored according to the -log10(p.adjust).
∗Top 15 enriched GO BP terms are showed in the bar plot of each disease state in each tissue. Each row represents a significant GO biological process which is colored according to the -log10(p.adjust).
Page: 1 2 3 4 5 6 7 8 9 

check button Enriched GO biological processes.
GO IDTissueDisease StageDescriptionGene RatioBg Ratiopvaluep.adjustCount
GO:00315705EsophagusESCCDNA integrity checkpoint83/8552123/187238.17e-071.06e-0583
GO:00000775EsophagusESCCDNA damage checkpoint78/8552115/187231.27e-061.56e-0578
GO:19019883EsophagusESCCnegative regulation of cell cycle phase transition151/8552249/187231.28e-061.57e-05151
GO:004593013EsophagusESCCnegative regulation of mitotic cell cycle143/8552235/187231.84e-062.15e-05143
GO:19019896EsophagusESCCpositive regulation of cell cycle phase transition77/8552115/187233.20e-063.58e-0577
GO:00900689EsophagusESCCpositive regulation of cell cycle process142/8552236/187234.79e-065.08e-05142
GO:003220014EsophagusESCCtelomere organization99/8552159/187231.77e-051.57e-0499
GO:004477312EsophagusESCCmitotic DNA damage checkpoint54/855281/187231.09e-047.64e-0454
GO:200102112EsophagusESCCnegative regulation of response to DNA damage stimulus54/855281/187231.09e-047.64e-0454
GO:00447745EsophagusESCCmitotic DNA integrity checkpoint56/855285/187231.34e-049.09e-0456
GO:19019762EsophagusESCCregulation of cell cycle checkpoint24/855233/187231.50e-037.06e-0324
GO:007259412LiverCirrhoticestablishment of protein localization to organelle189/4634422/187231.01e-192.45e-17189
GO:000691312LiverCirrhoticnucleocytoplasmic transport118/4634301/187231.71e-086.27e-07118
GO:005116912LiverCirrhoticnuclear transport118/4634301/187231.71e-086.27e-07118
GO:003450411LiverCirrhoticprotein localization to nucleus113/4634290/187235.00e-081.58e-06113
GO:20012527LiverCirrhoticpositive regulation of chromosome organization42/463482/187232.16e-075.53e-0642
GO:00007237LiverCirrhotictelomere maintenance58/4634131/187237.93e-071.66e-0558
GO:00322067LiverCirrhoticpositive regulation of telomere maintenance29/463452/187231.69e-063.22e-0529
GO:00322046LiverCirrhoticregulation of telomere maintenance39/463480/187232.87e-065.13e-0539
GO:003304411LiverCirrhoticregulation of chromosome organization74/4634187/187235.00e-068.18e-0574
Page: 1 2 3 4 5 6 7 8 9 10 11 12 13 14 15 16 17 18 19 20 21 22 

check button Enriched KEGG pathways.
Pathway IDTissueDisease StageDescriptionGene RatioBg Ratiopvaluep.adjustqvalueCount
Page: 1 

Top

Cell-cell communication analysis

check buttonIdentification of potential cell-cell interactions between two cell types and their ligand-receptor pairs for different disease states
LigandReceptorLRpairPathwayTissueDisease Stage
Page: 1 

Top

Single-cell gene regulatory network inference analysis

check buttonFind out the significant the regulons (TFs) and the target genes of each regulon across cell types for different disease states
TFCell TypeTissueDisease StageTarget GeneRSSRegulon Activity
∗The dot plots of a searched regulon are shown for all cell subpopulations in each disease state of each tissue based on the regulon specific score inferred using pySCENIC and by calculating the average expression.
Page: 1 

Top

Somatic mutation of malignant transformation related genes

check buttonAnnotation of somatic variants for genes involved in malignant transformation
Hugo SymbolVariant ClassVariant ClassificationdbSNP RSHGVScHGVSpHGVSp ShortSWISSPROTBIOTYPESIFTPolyPhenTumor Sample BarcodeTissueHistologySexAgeStageTherapy TypesDrugsOutcome
PPP1R10SNVMissense_Mutationnovelc.2333N>Ap.Gly778Glup.G778EQ96QC0protein_codingtolerated_low_confidence(0.06)benign(0.017)TCGA-5L-AAT1-01Breastbreast invasive carcinomaFemale<65III/IVHormone TherapyletrozolSD
PPP1R10SNVMissense_Mutationnovelc.1669G>Ap.Val557Ilep.V557IQ96QC0protein_codingtolerated(0.21)probably_damaging(0.967)TCGA-E2-A150-01Breastbreast invasive carcinomaFemale<65I/IIChemotherapydoxorubicinSD
PPP1R10SNVMissense_Mutationnovelc.2368N>Cp.Ser790Argp.S790RQ96QC0protein_codingtolerated_low_confidence(0.1)benign(0.003)TCGA-LL-A5YN-01Breastbreast invasive carcinomaFemale<65I/IIChemotherapycarboplatinSD
PPP1R10insertionFrame_Shift_Insnovelc.1483_1484insTp.Gln495LeufsTer12p.Q495Lfs*12Q96QC0protein_codingTCGA-3C-AALI-01Breastbreast invasive carcinomaFemale<65I/IIUnspecificPoly EComplete Response
PPP1R10insertionNonsense_Mutationnovelc.2107_2108insGAGGTTAGAACTGACTACAAAGACACAGGAAp.Tyr703Terp.Y703*Q96QC0protein_codingTCGA-AQ-A54N-01Breastbreast invasive carcinomaFemale<65I/IIUnknownUnknownSD
PPP1R10SNVMissense_Mutationrs748839668c.2764C>Tp.Arg922Cysp.R922CQ96QC0protein_codingdeleterious_low_confidence(0)probably_damaging(0.984)TCGA-2W-A8YY-01Cervixcervical & endocervical cancerFemale<65I/IIChemotherapycisplatinCR
PPP1R10SNVMissense_Mutationrs774652564c.2345G>Ap.Arg782Hisp.R782HQ96QC0protein_codingdeleterious_low_confidence(0.01)benign(0.12)TCGA-2W-A8YY-01Cervixcervical & endocervical cancerFemale<65I/IIChemotherapycisplatinCR
PPP1R10SNVMissense_Mutationrs767544705c.1343G>Ap.Arg448Glnp.R448QQ96QC0protein_codingdeleterious(0.01)probably_damaging(0.988)TCGA-2W-A8YY-01Cervixcervical & endocervical cancerFemale<65I/IIChemotherapycisplatinCR
PPP1R10SNVMissense_Mutationrs747071643c.2255N>Ap.Arg752Hisp.R752HQ96QC0protein_codingtolerated_low_confidence(0.08)benign(0.057)TCGA-DR-A0ZL-01Cervixcervical & endocervical cancerFemale<65I/IIUnknownUnknownSD
PPP1R10SNVMissense_Mutationnovelc.249N>Cp.Lys83Asnp.K83NQ96QC0protein_codingdeleterious(0.02)possibly_damaging(0.863)TCGA-IR-A3LH-01Cervixcervical & endocervical cancerFemale<65I/IIChemotherapycisplatinCR
Page: 1 2 3 4 5 6 7 8 

Top

Related drugs of malignant transformation related genes

check buttonIdentification of chemicals and drugs interact with genes involved in malignant transfromation
(DGIdb 4.0)
Entrez IDSymbolCategoryInteraction TypesDrug Claim NameDrug NamePMIDs
Page: 1