
|
|||||
|
 | |
| |
| |
| |
| |
| |
|
Gene: PON1 |
Gene summary for PON1 |
| Gene information | Species | Human | Gene symbol | PON1 | Gene ID | 5444 |
| Gene name | paraoxonase 1 | |
| Gene Alias | ESA | |
| Cytomap | 7q21.3 | |
| Gene Type | protein-coding | GO ID | GO:0006066 | UniProtAcc | P27169 |
Top |
Malignant transformation analysis |
| Identification of the aberrant gene expression in precancerous and cancerous lesions by comparing the gene expression of stem-like cells in diseased tissues with normal stem cells |
| Entrez ID | Symbol | Replicates | Species | Organ | Tissue | Adj P-value | Log2FC | Malignancy |
| 5444 | PON1 | NAFLD1 | Human | Liver | NAFLD | 2.96e-05 | 5.73e-01 | -0.04 |
| 5444 | PON1 | S43 | Human | Liver | Cirrhotic | 8.20e-05 | -1.81e-01 | -0.0187 |
| 5444 | PON1 | HCC1_Meng | Human | Liver | HCC | 2.36e-71 | 1.91e-01 | 0.0246 |
| 5444 | PON1 | HCC2_Meng | Human | Liver | HCC | 3.19e-07 | -2.67e-01 | 0.0107 |
| 5444 | PON1 | cirrhotic1 | Human | Liver | Cirrhotic | 3.73e-04 | 4.29e-02 | 0.0202 |
| 5444 | PON1 | cirrhotic2 | Human | Liver | Cirrhotic | 1.18e-03 | -2.23e-01 | 0.0201 |
| 5444 | PON1 | HCC1 | Human | Liver | HCC | 3.56e-07 | 3.14e+00 | 0.5336 |
| 5444 | PON1 | HCC2 | Human | Liver | HCC | 2.52e-02 | 1.65e+00 | 0.5341 |
| 5444 | PON1 | Pt13.b | Human | Liver | HCC | 2.19e-04 | -3.48e-02 | 0.0251 |
| 5444 | PON1 | S029 | Human | Liver | HCC | 2.89e-03 | 6.01e-01 | 0.2581 |
| Page: 1 |
| Tissue | Expression Dynamics | Abbreviation |
| Liver | 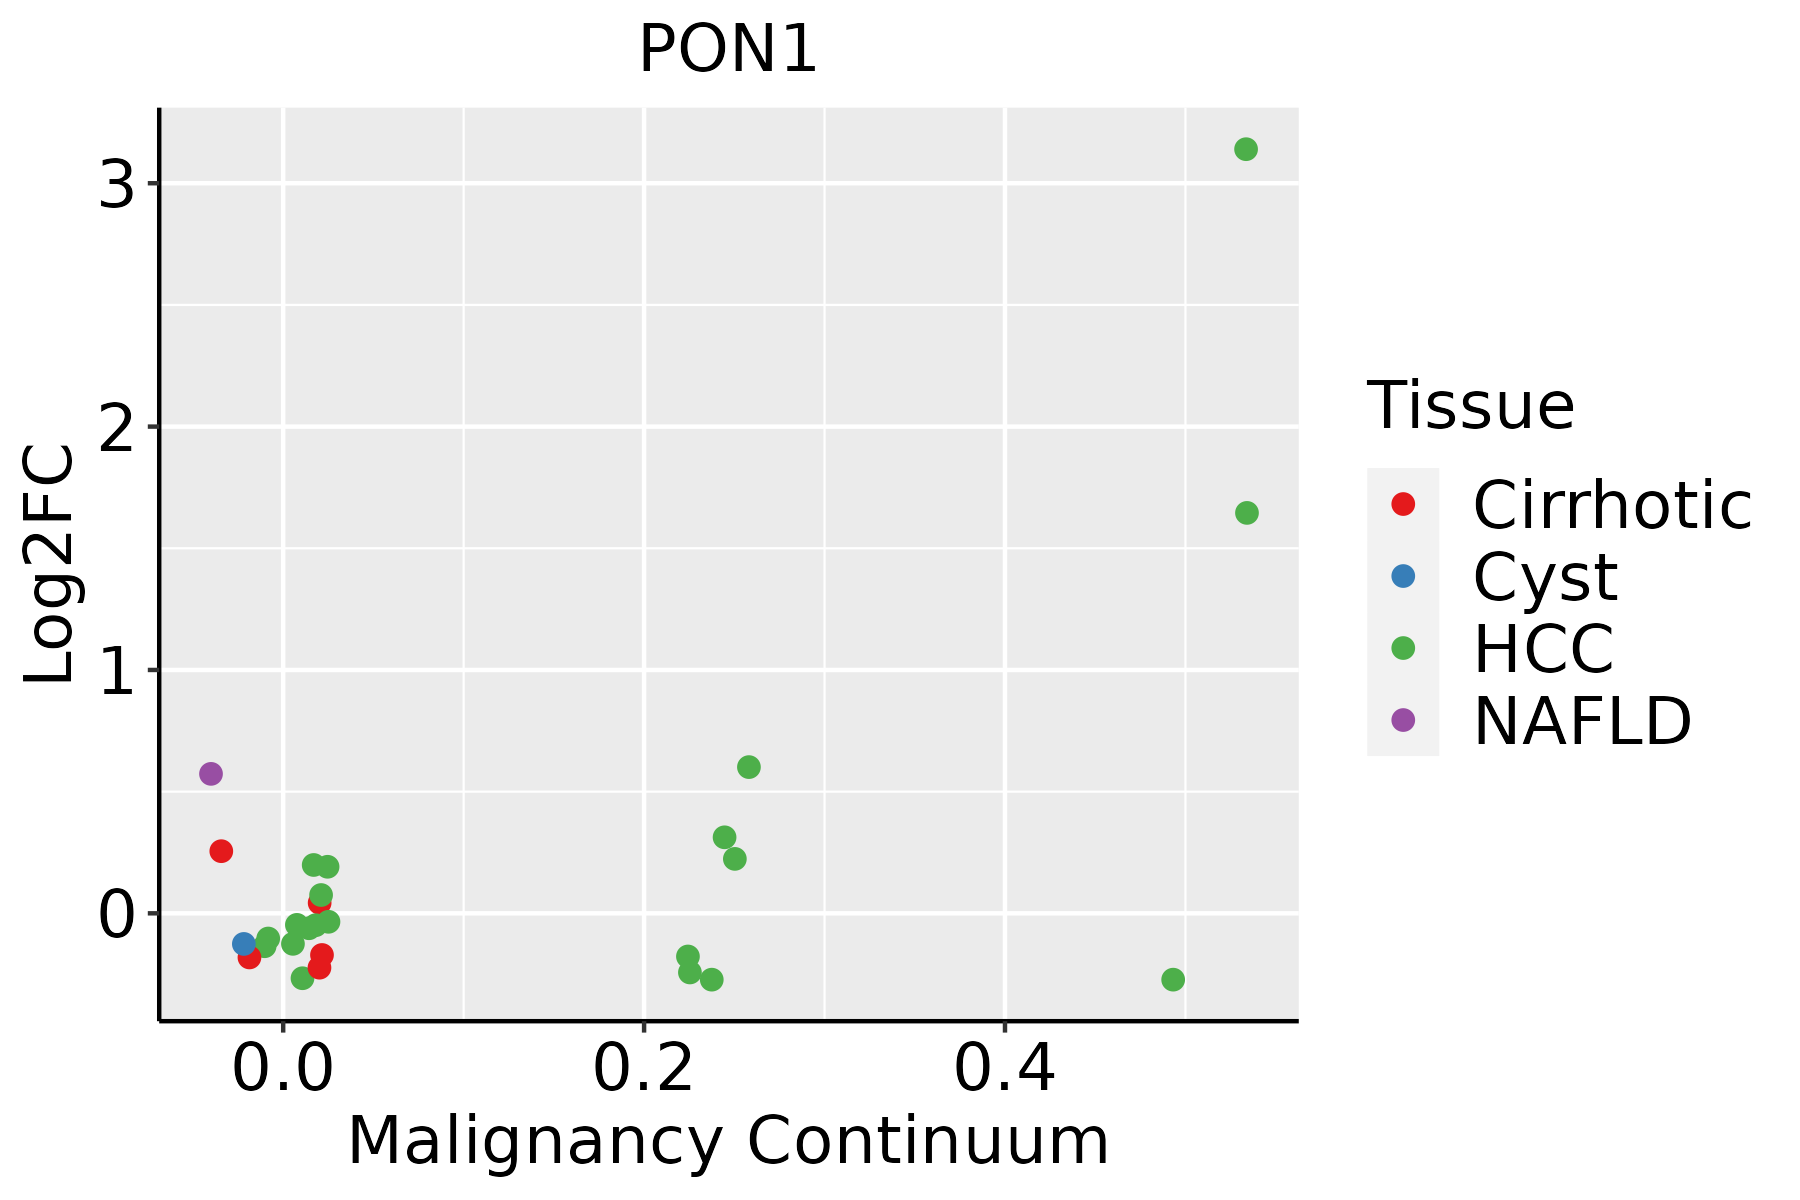 | HCC: Hepatocellular carcinoma |
| NAFLD: Non-alcoholic fatty liver disease |
| ∗log2FC in expression of this searched gene in stem-like cells from each diseased tissue sample relative to stem-like cells in normal samples in each tissue plotted against the malignancy continuum. Samples are colored based on if they are from different disease stage. |
Top |
Malignant transformation related pathway analysis |
| Find out the enriched GO biological processes and KEGG pathways involved in transition from healthy to precancer to cancer |
| Tissue | Disease Stage | Enriched GO biological Processes |
| Colorectum | AD |  |
| Colorectum | SER |  |
| Colorectum | MSS |  |
| Colorectum | MSI-H |  |
| Colorectum | FAP |  |
| ∗Top 15 enriched GO BP terms are showed in the bar plot of each disease state in each tissue. Each row represents a significant GO biological process which is colored according to the -log10(p.adjust). |
| Page: 1 2 3 4 5 6 7 8 9 |
| GO ID | Tissue | Disease Stage | Description | Gene Ratio | Bg Ratio | pvalue | p.adjust | Count |
| GO:00333441 | Liver | Cirrhotic | cholesterol efflux | 29/4634 | 69/18723 | 1.20e-03 | 8.12e-03 | 29 |
| GO:001591811 | Liver | Cirrhotic | sterol transport | 48/4634 | 130/18723 | 1.32e-03 | 8.83e-03 | 48 |
| GO:003030111 | Liver | Cirrhotic | cholesterol transport | 44/4634 | 117/18723 | 1.34e-03 | 8.98e-03 | 44 |
| GO:001631111 | Liver | Cirrhotic | dephosphorylation | 130/4634 | 417/18723 | 1.58e-03 | 1.03e-02 | 130 |
| GO:00323711 | Liver | Cirrhotic | regulation of sterol transport | 31/4634 | 78/18723 | 2.43e-03 | 1.46e-02 | 31 |
| GO:00323741 | Liver | Cirrhotic | regulation of cholesterol transport | 31/4634 | 78/18723 | 2.43e-03 | 1.46e-02 | 31 |
| GO:19059521 | Liver | Cirrhotic | regulation of lipid localization | 62/4634 | 181/18723 | 2.53e-03 | 1.51e-02 | 62 |
| GO:00323681 | Liver | Cirrhotic | regulation of lipid transport | 51/4634 | 149/18723 | 5.85e-03 | 2.93e-02 | 51 |
| GO:19059541 | Liver | Cirrhotic | positive regulation of lipid localization | 39/4634 | 110/18723 | 7.76e-03 | 3.65e-02 | 39 |
| GO:00464341 | Liver | Cirrhotic | organophosphate catabolic process | 52/4634 | 155/18723 | 8.42e-03 | 3.91e-02 | 52 |
| GO:00323701 | Liver | Cirrhotic | positive regulation of lipid transport | 31/4634 | 84/18723 | 8.75e-03 | 4.04e-02 | 31 |
| GO:001943921 | Liver | HCC | aromatic compound catabolic process | 309/7958 | 467/18723 | 1.56e-25 | 4.94e-23 | 309 |
| GO:005109822 | Liver | HCC | regulation of binding | 225/7958 | 363/18723 | 3.78e-14 | 2.37e-12 | 225 |
| GO:003166722 | Liver | HCC | response to nutrient levels | 276/7958 | 474/18723 | 2.30e-12 | 1.08e-10 | 276 |
| GO:004428221 | Liver | HCC | small molecule catabolic process | 225/7958 | 376/18723 | 6.50e-12 | 2.80e-10 | 225 |
| GO:001605421 | Liver | HCC | organic acid catabolic process | 152/7958 | 240/18723 | 5.11e-11 | 1.92e-09 | 152 |
| GO:00463952 | Liver | HCC | carboxylic acid catabolic process | 149/7958 | 236/18723 | 1.11e-10 | 3.87e-09 | 149 |
| GO:000606621 | Liver | HCC | alcohol metabolic process | 208/7958 | 353/18723 | 2.80e-10 | 9.50e-09 | 208 |
| GO:19026522 | Liver | HCC | secondary alcohol metabolic process | 100/7958 | 147/18723 | 3.26e-10 | 1.09e-08 | 100 |
| GO:00082032 | Liver | HCC | cholesterol metabolic process | 94/7958 | 137/18723 | 5.39e-10 | 1.72e-08 | 94 |
| Page: 1 2 3 4 5 6 |
| Pathway ID | Tissue | Disease Stage | Description | Gene Ratio | Bg Ratio | pvalue | p.adjust | qvalue | Count |
| Page: 1 |
Top |
Cell-cell communication analysis |
| Identification of potential cell-cell interactions between two cell types and their ligand-receptor pairs for different disease states |
| Ligand | Receptor | LRpair | Pathway | Tissue | Disease Stage |
| Page: 1 |
Top |
Single-cell gene regulatory network inference analysis |
| Find out the significant the regulons (TFs) and the target genes of each regulon across cell types for different disease states |
| TF | Cell Type | Tissue | Disease Stage | Target Gene | RSS | Regulon Activity |
| ∗The dot plots of a searched regulon are shown for all cell subpopulations in each disease state of each tissue based on the regulon specific score inferred using pySCENIC and by calculating the average expression. |
| Page: 1 |
Top |
Somatic mutation of malignant transformation related genes |
| Annotation of somatic variants for genes involved in malignant transformation |
| Hugo Symbol | Variant Class | Variant Classification | dbSNP RS | HGVSc | HGVSp | HGVSp Short | SWISSPROT | BIOTYPE | SIFT | PolyPhen | Tumor Sample Barcode | Tissue | Histology | Sex | Age | Stage | Therapy Types | Drugs | Outcome |
| PON1 | SNV | Missense_Mutation | rs753947057 | c.736C>T | p.His246Tyr | p.H246Y | P27169 | protein_coding | tolerated(0.1) | benign(0.342) | TCGA-D8-A1J8-01 | Breast | breast invasive carcinoma | Female | >=65 | I/II | Hormone Therapy | nolvadex | SD |
| PON1 | SNV | Missense_Mutation | c.743N>G | p.Tyr248Cys | p.Y248C | P27169 | protein_coding | deleterious(0) | probably_damaging(0.99) | TCGA-D8-A1XQ-01 | Breast | breast invasive carcinoma | Female | >=65 | I/II | Unknown | Unknown | SD | |
| PON1 | SNV | Missense_Mutation | novel | c.821N>T | p.Asp274Val | p.D274V | P27169 | protein_coding | deleterious(0) | probably_damaging(0.992) | TCGA-LL-A5YP-01 | Breast | breast invasive carcinoma | Female | <65 | I/II | Chemotherapy | cytoxan | SD |
| PON1 | SNV | Missense_Mutation | rs758720006 | c.727C>T | p.His243Tyr | p.H243Y | P27169 | protein_coding | deleterious(0.01) | probably_damaging(0.975) | TCGA-OL-A5RW-01 | Breast | breast invasive carcinoma | Female | <65 | I/II | Chemotherapy | adriamycin | CR |
| PON1 | insertion | Nonsense_Mutation | novel | c.515_516insATCCTGACACTGCTTGCTATCCTTATAA | p.Val173SerfsTer2 | p.V173Sfs*2 | P27169 | protein_coding | TCGA-AO-A128-01 | Breast | breast invasive carcinoma | Female | <65 | I/II | Chemotherapy | doxorubicin | SD | ||
| PON1 | SNV | Missense_Mutation | novel | c.1062G>T | p.Glu354Asp | p.E354D | P27169 | protein_coding | tolerated(0.41) | benign(0.001) | TCGA-2W-A8YY-01 | Cervix | cervical & endocervical cancer | Female | <65 | I/II | Chemotherapy | cisplatin | CR |
| PON1 | SNV | Missense_Mutation | novel | c.685T>C | p.Ser229Pro | p.S229P | P27169 | protein_coding | deleterious(0) | probably_damaging(0.962) | TCGA-VS-A94Z-01 | Cervix | cervical & endocervical cancer | Female | <65 | I/II | Chemotherapy | cisplatin | CR |
| PON1 | SNV | Missense_Mutation | rs371338407 | c.236C>A | p.Pro79His | p.P79H | P27169 | protein_coding | deleterious(0.01) | benign(0.047) | TCGA-AA-3488-01 | Colorectum | colon adenocarcinoma | Male | <65 | III/IV | Unknown | Unknown | PD |
| PON1 | SNV | Missense_Mutation | rs749649413 | c.917N>A | p.Arg306Gln | p.R306Q | P27169 | protein_coding | tolerated(0.13) | benign(0.022) | TCGA-AA-3510-01 | Colorectum | colon adenocarcinoma | Male | >=65 | I/II | Unknown | Unknown | SD |
| PON1 | SNV | Missense_Mutation | c.659N>C | p.Phe220Ser | p.F220S | P27169 | protein_coding | deleterious(0) | probably_damaging(0.996) | TCGA-AA-3672-01 | Colorectum | colon adenocarcinoma | Female | >=65 | III/IV | Unknown | Unknown | SD |
| Page: 1 2 3 4 5 6 |
Top |
Related drugs of malignant transformation related genes |
| Identification of chemicals and drugs interact with genes involved in malignant transfromation |
| (DGIdb 4.0) |
| Entrez ID | Symbol | Category | Interaction Types | Drug Claim Name | Drug Name | PMIDs |
| 5444 | PON1 | ENZYME, TRANSPORTER, DRUGGABLE GENOME | epirubicin | EPIRUBICIN | ||
| 5444 | PON1 | ENZYME, TRANSPORTER, DRUGGABLE GENOME | oxaliplatin | OXALIPLATIN | ||
| 5444 | PON1 | ENZYME, TRANSPORTER, DRUGGABLE GENOME | Tumor necrosis factor alpha (TNF-alpha) inhibitors | |||
| 5444 | PON1 | ENZYME, TRANSPORTER, DRUGGABLE GENOME | atorvastatin | ATORVASTATIN | 18430057,16238680,19904013 | |
| 5444 | PON1 | ENZYME, TRANSPORTER, DRUGGABLE GENOME | QUERCETIN | QUERCETIN | 23623675 | |
| 5444 | PON1 | ENZYME, TRANSPORTER, DRUGGABLE GENOME | fluorouracil | FLUOROURACIL | ||
| 5444 | PON1 | ENZYME, TRANSPORTER, DRUGGABLE GENOME | simvastatin | SIMVASTATIN | 18430057,16238680,19904013 |
| Page: 1 |

Copyright 2023-Present -The University of Texas Health Science Center at Houston |