Schematic overview of the cellular and molecular mechanisms involved in the cancer progression, including the proposed cellular and molecular mechanisms in cancer cells trajectory. AT1: alveolar type 1 cells; AT2: alveolar type 2 cells; AAH: atypical adenomatous hyperplasia; AIS: adenocarcinoma in situ; MIA: minimally invasive adenocarcinoma; IA: invasive adenocarcinoma; EMT: epithelial-mesenchymal transition

Home

Download

Statistics

Help

Contact

Center for Computational Systems Medicine
leaf

Gene summary

leaf

Malignant transformation analysis

leaf

Malignant transformation related pathway analysis

leaf

Cell-cell communication analysis

leaf

Single-cell gene regulatory network inference analysis

leaf

Somatic mutation of malignant transformation related genes

leaf

Related drugs of malignant transformation related genes

Gene: PNPLA8

Gene summary for PNPLA8

check button Gene summary.

Gene informationSpeciesHuman
Gene symbol

PNPLA8

Gene ID

50640

Gene namepatatin like phospholipase domain containing 8
Gene AliasIPLA2-2
Cytomap7q31.1
Gene Typeprotein-coding
GO ID

GO:0001516

UniProtAcc

A0A024R746


Top

Malignant transformation analysis

check button Identification of the aberrant gene expression in precancerous and cancerous lesions by comparing the gene expression of stem-like cells in diseased tissues with normal stem cells
check button Malignant transformation involving gene list.
Entrez IDSymbolReplicatesSpeciesOrganTissueAdj P-valueLog2FCMalignancy
50640PNPLA8LZE2DHumanEsophagusHGIN2.75e-022.86e-010.0642
50640PNPLA8LZE4THumanEsophagusESCC2.84e-113.87e-010.0811
50640PNPLA8LZE7THumanEsophagusESCC2.89e-113.55e-010.0667
50640PNPLA8LZE8THumanEsophagusESCC3.68e-072.92e-010.067
50640PNPLA8LZE20THumanEsophagusESCC2.69e-058.14e-020.0662
50640PNPLA8LZE22THumanEsophagusESCC8.76e-061.65e-010.068
50640PNPLA8LZE24THumanEsophagusESCC3.66e-185.01e-010.0596
50640PNPLA8LZE21THumanEsophagusESCC4.25e-051.78e-010.0655
50640PNPLA8LZE6THumanEsophagusESCC6.53e-052.40e-010.0845
50640PNPLA8P1T-EHumanEsophagusESCC2.34e-044.60e-010.0875
50640PNPLA8P2T-EHumanEsophagusESCC2.59e-121.29e-010.1177
50640PNPLA8P4T-EHumanEsophagusESCC8.76e-184.08e-010.1323
50640PNPLA8P5T-EHumanEsophagusESCC1.53e-081.56e-010.1327
50640PNPLA8P8T-EHumanEsophagusESCC1.10e-184.53e-010.0889
50640PNPLA8P9T-EHumanEsophagusESCC9.65e-174.19e-010.1131
50640PNPLA8P10T-EHumanEsophagusESCC3.96e-194.02e-010.116
50640PNPLA8P11T-EHumanEsophagusESCC1.39e-189.19e-010.1426
50640PNPLA8P12T-EHumanEsophagusESCC1.97e-215.32e-010.1122
50640PNPLA8P15T-EHumanEsophagusESCC9.71e-246.81e-010.1149
50640PNPLA8P16T-EHumanEsophagusESCC9.50e-163.79e-010.1153
Page: 1 2 3 4 5 6 7 

check button Transcriptomic changes along malignancy continuum.
TissueExpression DynamicsAbbreviation
EsophagusThe image shows the transcriptomic changes along malignancy continuum.log2FC in expression of this searched gene in stem-like cells from each diseased tissue sample relative to stem-like cells in normal samples in each tissue plotted against the malignancy continuum. Samples are colored based on if they are from different disease stage.
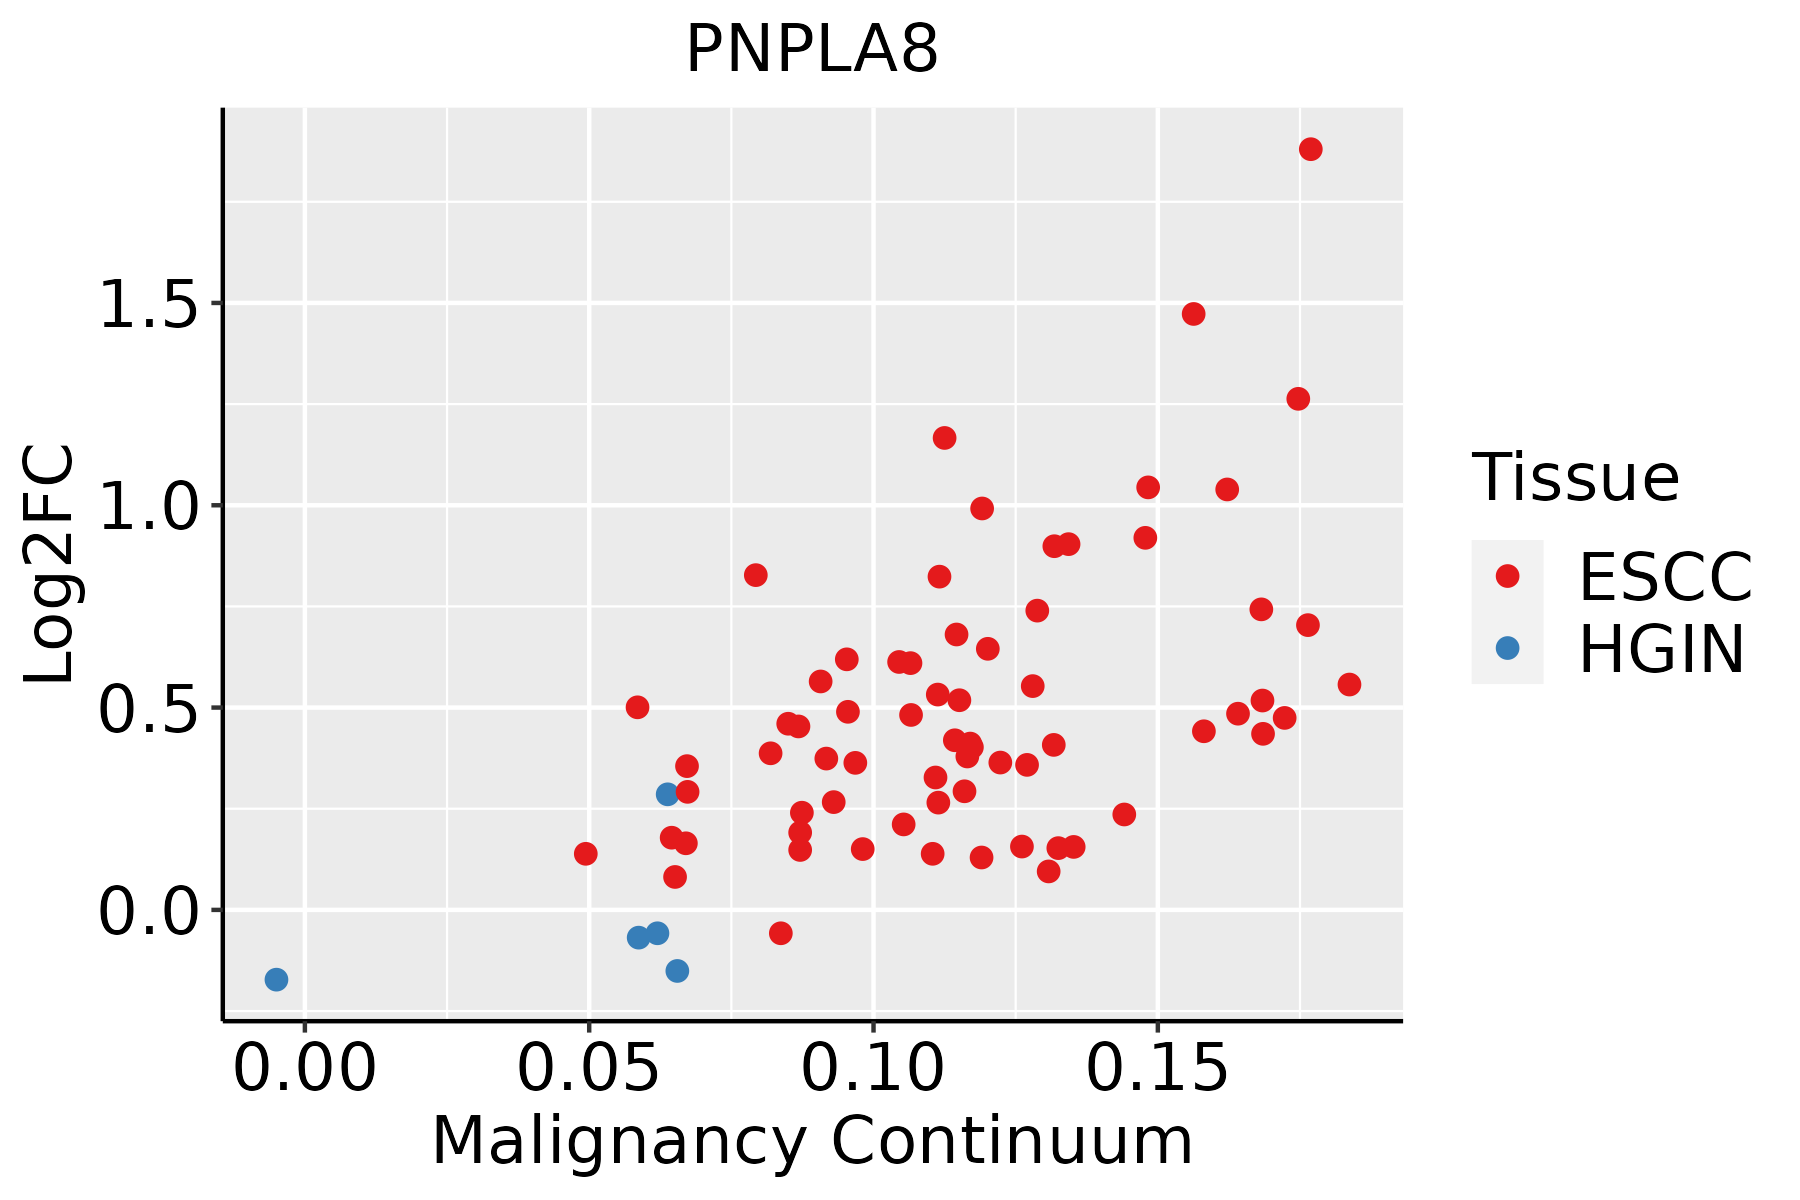
ESCC: Esophageal squamous cell carcinoma
HGIN: High-grade intraepithelial neoplasias
LGIN: Low-grade intraepithelial neoplasias
LiverThe image shows the transcriptomic changes along malignancy continuum.log2FC in expression of this searched gene in stem-like cells from each diseased tissue sample relative to stem-like cells in normal samples in each tissue plotted against the malignancy continuum. Samples are colored based on if they are from different disease stage.HCC: Hepatocellular carcinoma
NAFLD: Non-alcoholic fatty liver disease
LungThe image shows the transcriptomic changes along malignancy continuum.log2FC in expression of this searched gene in stem-like cells from each diseased tissue sample relative to stem-like cells in normal samples in each tissue plotted against the malignancy continuum. Samples are colored based on if they are from different disease stage.
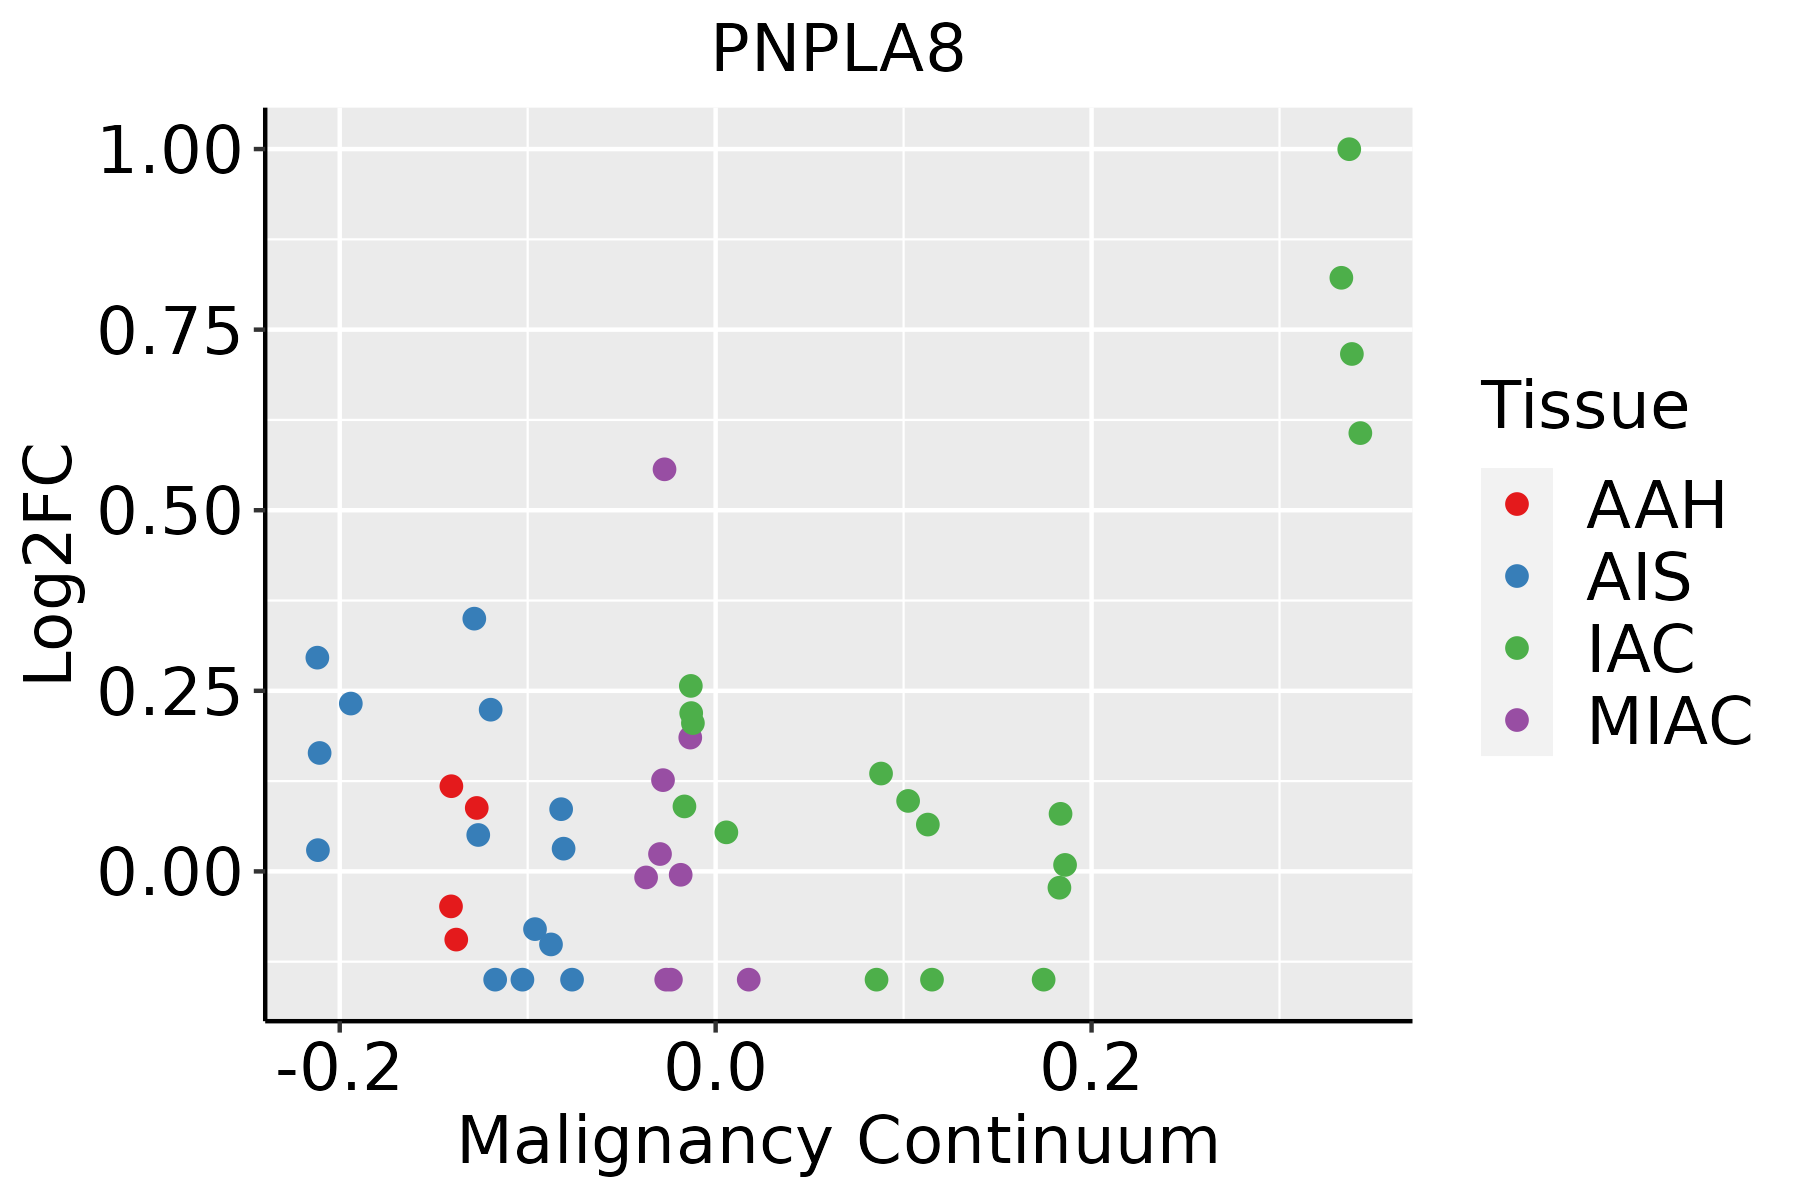
AAH: Atypical adenomatous hyperplasia
AIS: Adenocarcinoma in situ
IAC: Invasive lung adenocarcinoma
MIA: Minimally invasive adenocarcinoma
Oral CavityThe image shows the transcriptomic changes along malignancy continuum.log2FC in expression of this searched gene in stem-like cells from each diseased tissue sample relative to stem-like cells in normal samples in each tissue plotted against the malignancy continuum. Samples are colored based on if they are from different disease stage.
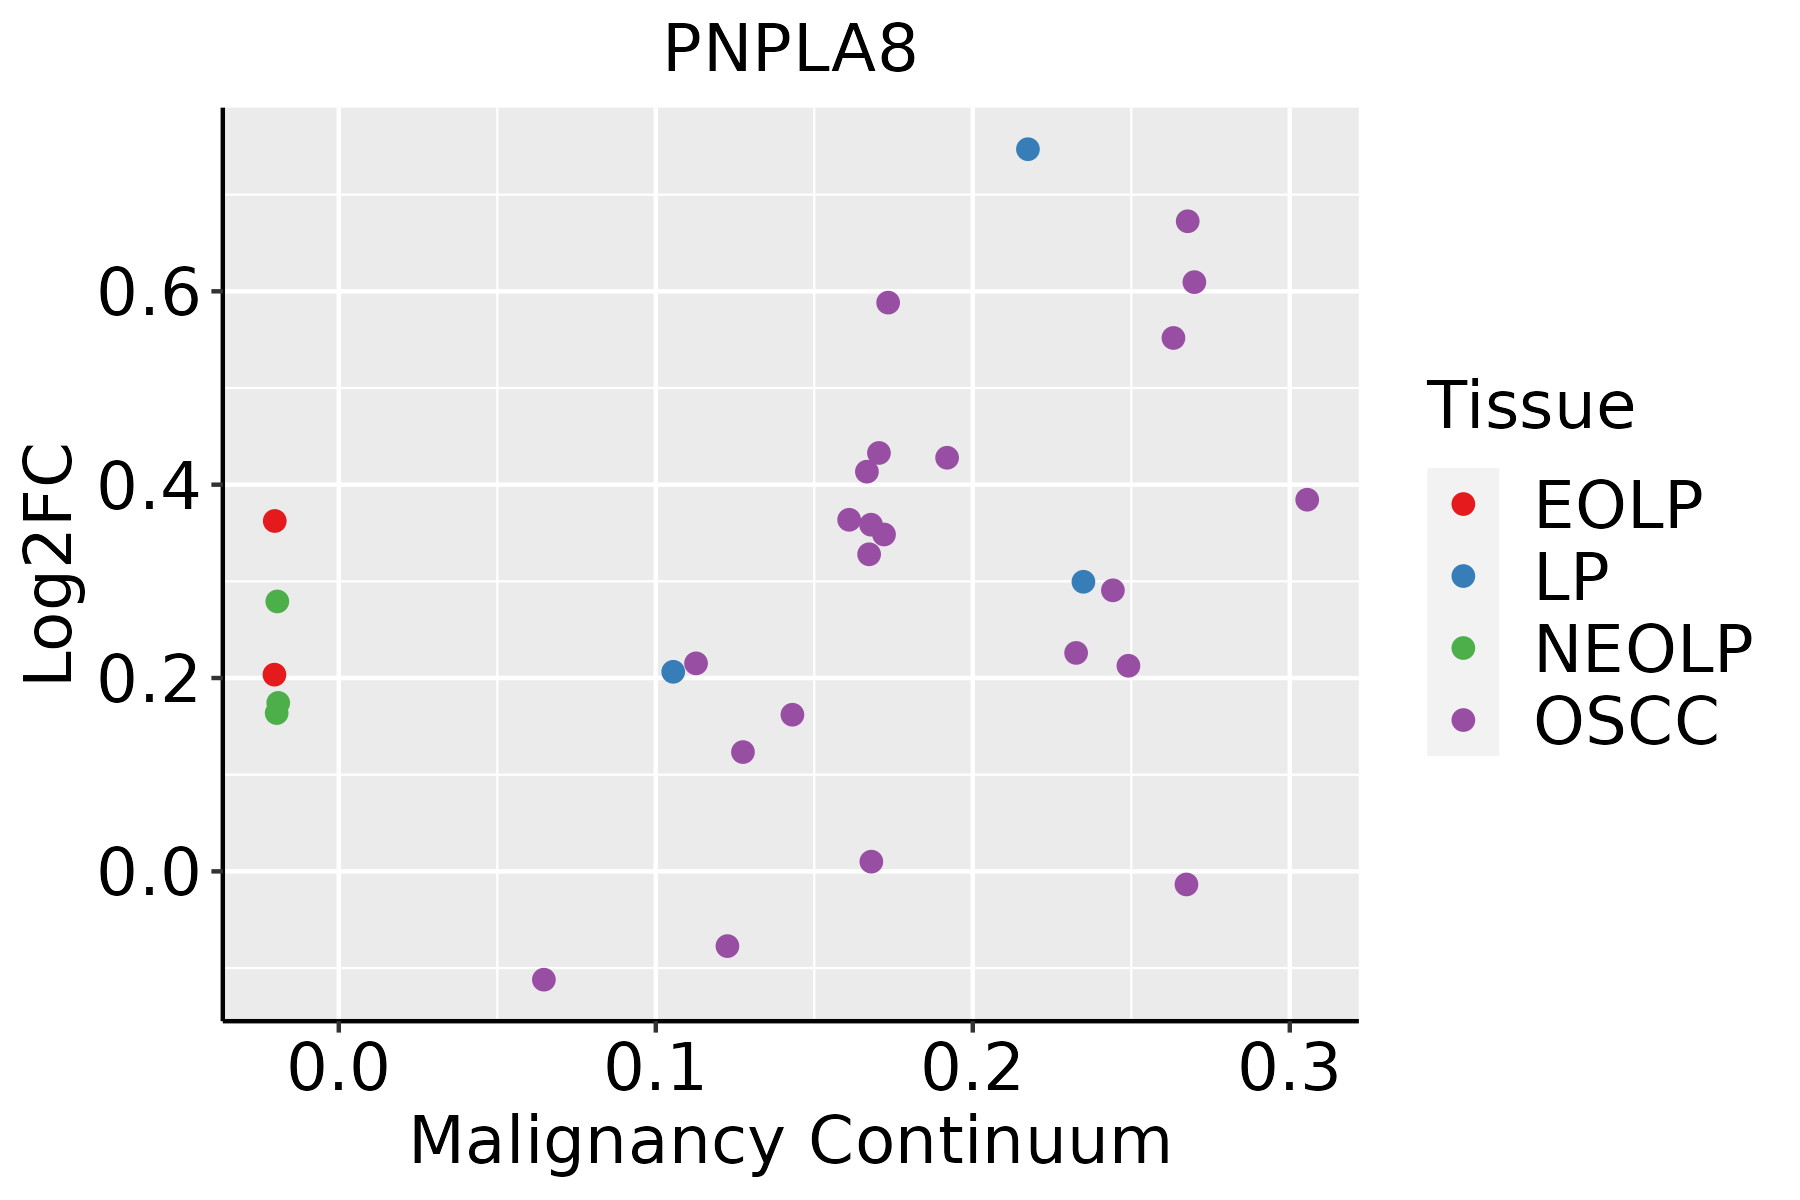
EOLP: Erosive Oral lichen planus
LP: leukoplakia
NEOLP: Non-erosive oral lichen planus
OSCC: Oral squamous cell carcinoma
ProstateThe image shows the transcriptomic changes along malignancy continuum.log2FC in expression of this searched gene in stem-like cells from each diseased tissue sample relative to stem-like cells in normal samples in each tissue plotted against the malignancy continuum. Samples are colored based on if they are from different disease stage.
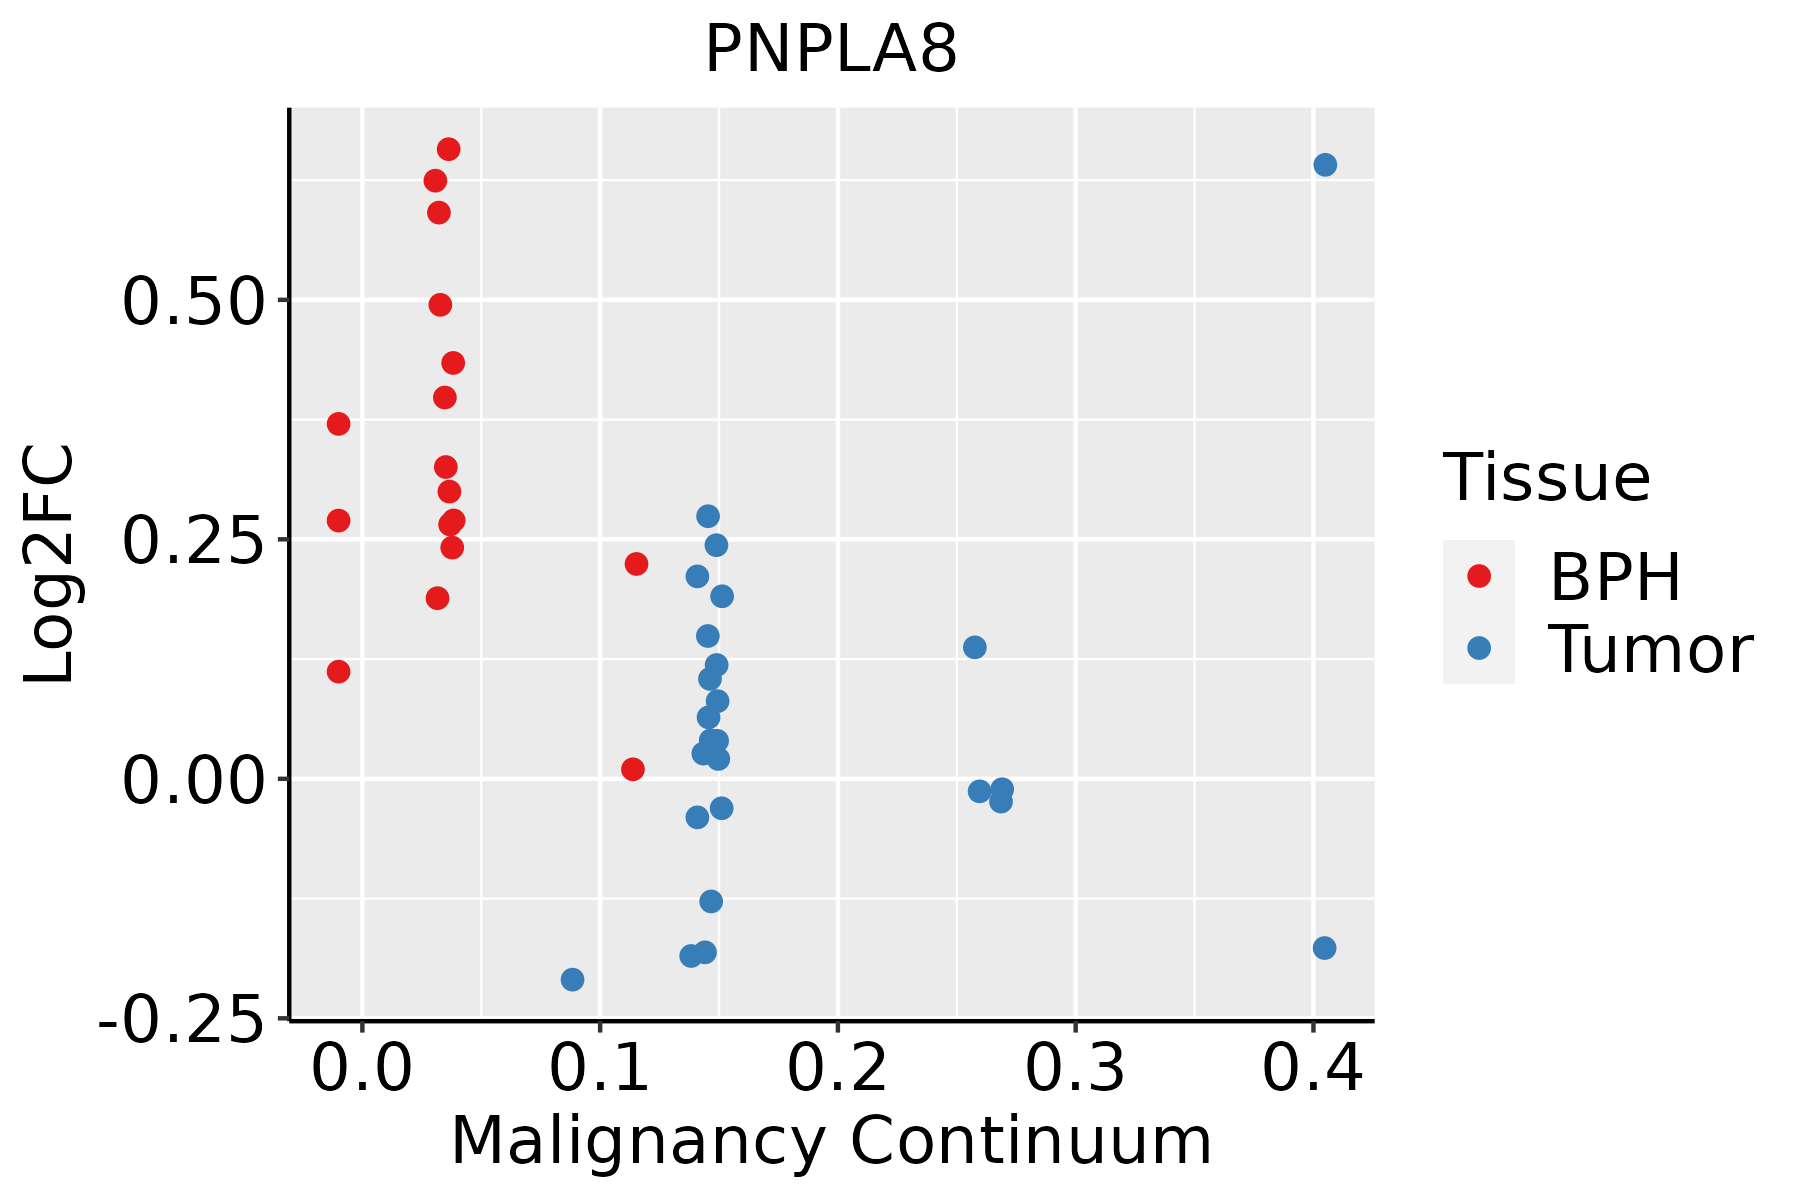
BPH: Benign Prostatic Hyperplasia
SkinThe image shows the transcriptomic changes along malignancy continuum.log2FC in expression of this searched gene in stem-like cells from each diseased tissue sample relative to stem-like cells in normal samples in each tissue plotted against the malignancy continuum. Samples are colored based on if they are from different disease stage.
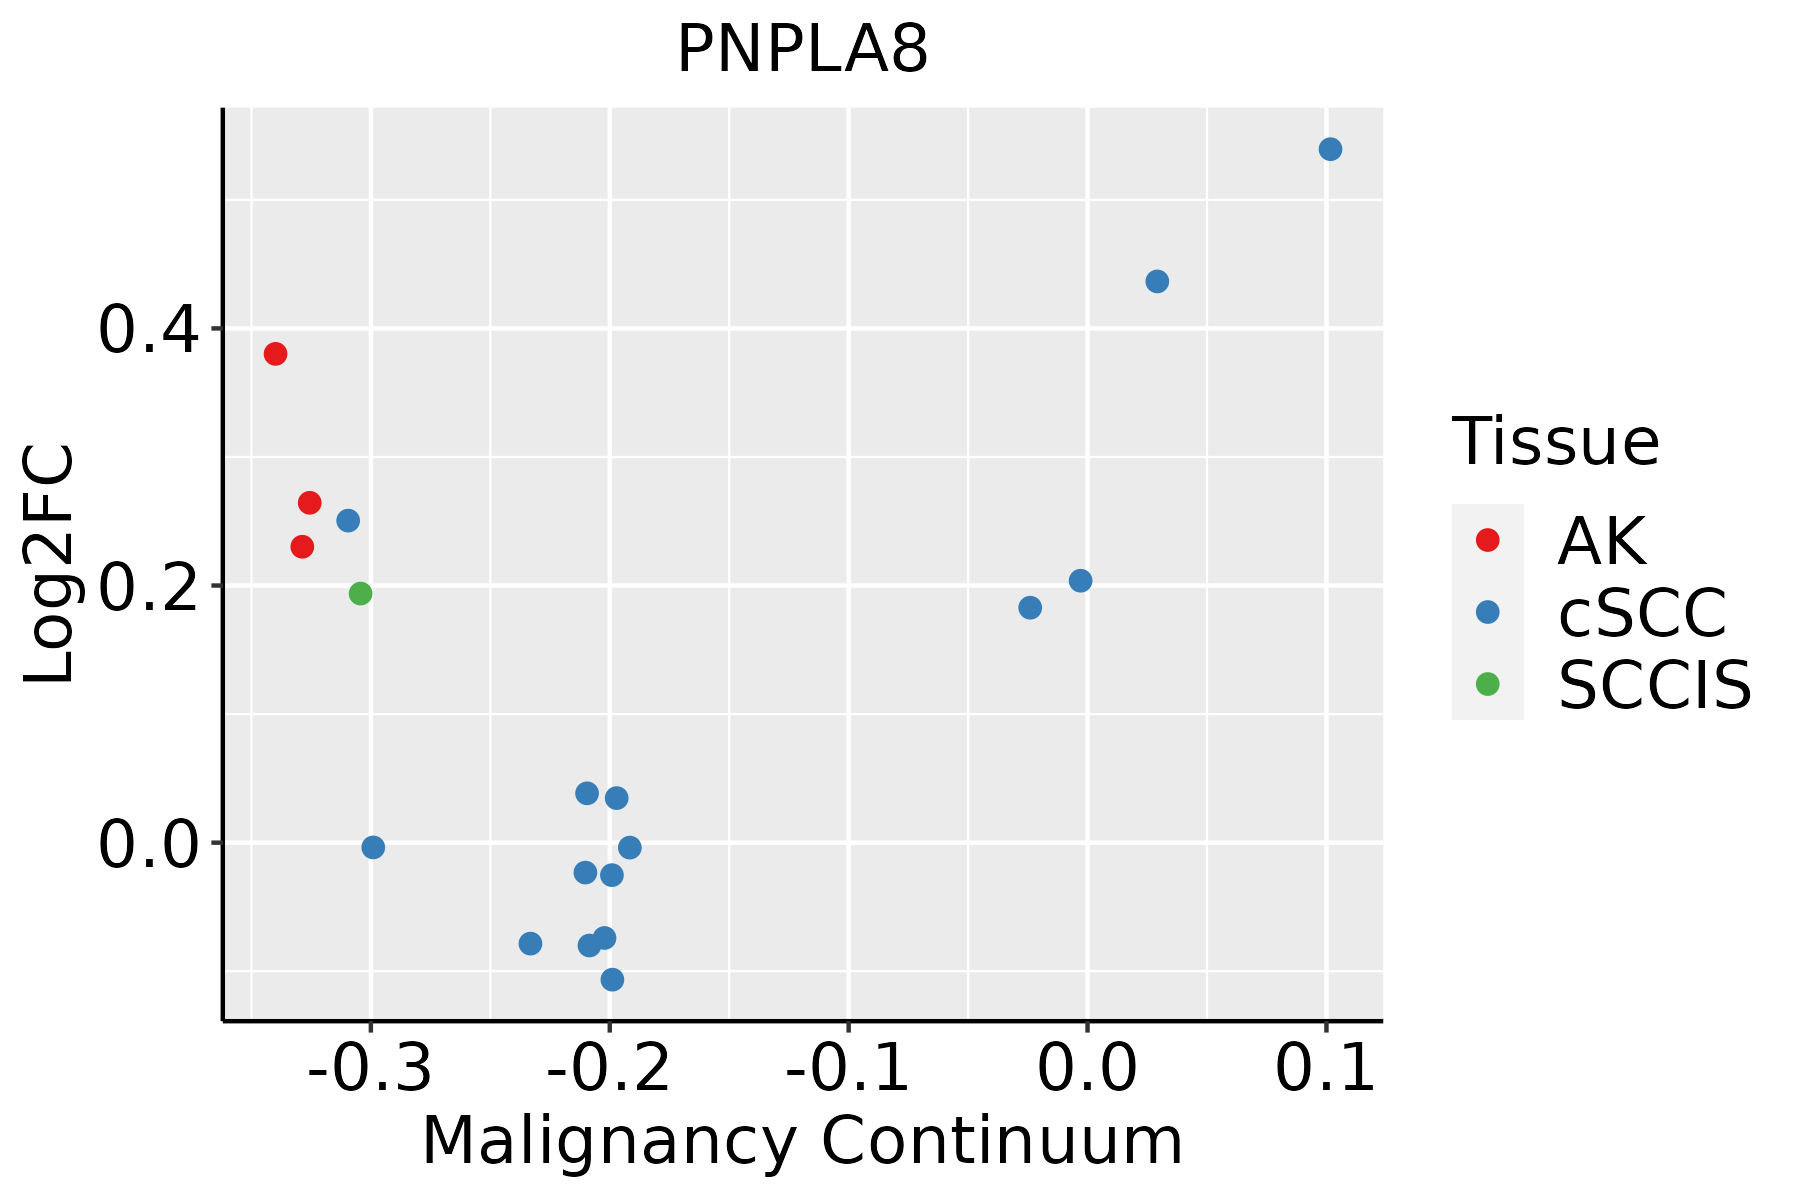
AK: Actinic keratosis
cSCC: Cutaneous squamous cell carcinoma
SCCIS:squamous cell carcinoma in situ
ThyroidThe image shows the transcriptomic changes along malignancy continuum.log2FC in expression of this searched gene in stem-like cells from each diseased tissue sample relative to stem-like cells in normal samples in each tissue plotted against the malignancy continuum. Samples are colored based on if they are from different disease stage.ATC: Anaplastic thyroid cancer
HT: Hashimoto's thyroiditis
PTC: Papillary thyroid cancer
∗log2FC in expression of this searched gene in stem-like cells from each diseased tissue sample relative to stem-like cells in normal samples in each tissue plotted against the malignancy continuum. Samples are colored based on if they are from different disease stage.

Top

Malignant transformation related pathway analysis

check buttonFind out the enriched GO biological processes and KEGG pathways involved in transition from healthy to precancer to cancer
check button Figure of enriched GO biological processes.
TissueDisease StageEnriched GO biological Processes
ColorectumADGO analysis - Figure of enriched GO biological processes: Top 15 enriched GO BP terms are showed in the bar plot of each disease state in each tissue. Each row represents a significant GO biological process which is colored according to the -log10(p.adjust).
ColorectumSERGO analysis - Figure of enriched GO biological processes: Top 15 enriched GO BP terms are showed in the bar plot of each disease state in each tissue. Each row represents a significant GO biological process which is colored according to the -log10(p.adjust).
ColorectumMSSGO analysis - Figure of enriched GO biological processes: Top 15 enriched GO BP terms are showed in the bar plot of each disease state in each tissue. Each row represents a significant GO biological process which is colored according to the -log10(p.adjust).
ColorectumMSI-HGO analysis - Figure of enriched GO biological processes: Top 15 enriched GO BP terms are showed in the bar plot of each disease state in each tissue. Each row represents a significant GO biological process which is colored according to the -log10(p.adjust).
ColorectumFAPGO analysis - Figure of enriched GO biological processes: Top 15 enriched GO BP terms are showed in the bar plot of each disease state in each tissue. Each row represents a significant GO biological process which is colored according to the -log10(p.adjust).
∗Top 15 enriched GO BP terms are showed in the bar plot of each disease state in each tissue. Each row represents a significant GO biological process which is colored according to the -log10(p.adjust).
Page: 1 2 3 4 5 6 7 8 9 

check button Enriched GO biological processes.
GO IDTissueDisease StageDescriptionGene RatioBg Ratiopvaluep.adjustCount
GO:001087621LiverHCClipid localization228/7958448/187231.80e-041.41e-03228
GO:000686921LiverHCClipid transport198/7958398/187231.92e-039.78e-03198
GO:00550902LiverHCCacylglycerol homeostasis27/795842/187233.60e-031.60e-0227
GO:00703282LiverHCCtriglyceride homeostasis27/795842/187233.60e-031.60e-0227
GO:190288212LiverHCCregulation of response to oxidative stress55/795898/187234.46e-031.93e-0255
GO:190040712LiverHCCregulation of cellular response to oxidative stress50/795889/187236.33e-032.58e-0250
GO:000167621LiverHCClong-chain fatty acid metabolic process60/7958112/187231.17e-024.28e-0260
GO:00069798LungIACresponse to oxidative stress82/2061446/187231.99e-069.18e-0582
GO:00621978LungIACcellular response to chemical stress64/2061337/187238.92e-063.01e-0464
GO:00345998LungIACcellular response to oxidative stress54/2061288/187236.20e-051.35e-0354
GO:19028828LungIACregulation of response to oxidative stress24/206198/187231.22e-042.30e-0324
GO:19004078LungIACregulation of cellular response to oxidative stress22/206189/187231.99e-043.51e-0322
GO:000697913LungAISresponse to oxidative stress75/1849446/187232.97e-061.60e-0475
GO:006219713LungAIScellular response to chemical stress58/1849337/187231.91e-056.62e-0458
GO:003459913LungAIScellular response to oxidative stress49/1849288/187231.10e-042.57e-0349
GO:190288213LungAISregulation of response to oxidative stress22/184998/187231.84e-043.83e-0322
GO:190040713LungAISregulation of cellular response to oxidative stress20/184989/187233.50e-046.28e-0320
GO:00464701LungAISphosphatidylcholine metabolic process15/184974/187235.25e-034.49e-0215
GO:000697920Oral cavityOSCCresponse to oxidative stress273/7305446/187238.35e-221.65e-19273
GO:006219720Oral cavityOSCCcellular response to chemical stress204/7305337/187236.89e-165.19e-14204
Page: 1 2 3 4 5 6 7 8 

check button Enriched KEGG pathways.
Pathway IDTissueDisease StageDescriptionGene RatioBg Ratiopvaluep.adjustqvalueCount
Page: 1 

Top

Cell-cell communication analysis

check buttonIdentification of potential cell-cell interactions between two cell types and their ligand-receptor pairs for different disease states
LigandReceptorLRpairPathwayTissueDisease Stage
Page: 1 

Top

Single-cell gene regulatory network inference analysis

check buttonFind out the significant the regulons (TFs) and the target genes of each regulon across cell types for different disease states
TFCell TypeTissueDisease StageTarget GeneRSSRegulon Activity
∗The dot plots of a searched regulon are shown for all cell subpopulations in each disease state of each tissue based on the regulon specific score inferred using pySCENIC and by calculating the average expression.
Page: 1 

Top

Somatic mutation of malignant transformation related genes

check buttonAnnotation of somatic variants for genes involved in malignant transformation
Hugo SymbolVariant ClassVariant ClassificationdbSNP RSHGVScHGVSpHGVSp ShortSWISSPROTBIOTYPESIFTPolyPhenTumor Sample BarcodeTissueHistologySexAgeStageTherapy TypesDrugsOutcome
PNPLA8SNVMissense_Mutationnovelc.1333C>Ap.Leu445Ilep.L445IQ9NP80protein_codingdeleterious(0)probably_damaging(1)TCGA-AN-A046-01Breastbreast invasive carcinomaFemale>=65I/IIUnknownUnknownSD
PNPLA8SNVMissense_Mutationnovelc.1663A>Gp.Arg555Glyp.R555GQ9NP80protein_codingdeleterious(0.01)benign(0.422)TCGA-AR-A256-01Breastbreast invasive carcinomaFemale<65I/IIChemotherapydoxorubicinPD
PNPLA8SNVMissense_Mutationc.757N>Gp.Ile253Valp.I253VQ9NP80protein_codingtolerated(0.75)benign(0)TCGA-EW-A1P6-01Breastbreast invasive carcinomaFemale<65I/IIChemotherapycyclophosphamideSD
PNPLA8insertionFrame_Shift_Insnovelc.1980_1981insAATTTCATTTTGCAATGCCTTGTGGAGGTAGGAGGCGACAAp.Gly661AsnfsTer21p.G661Nfs*21Q9NP80protein_codingTCGA-A2-A04P-01Breastbreast invasive carcinomaFemale<65III/IVChemotherapytaxolPD
PNPLA8insertionFrame_Shift_Insnovelc.596_597insCTp.Lys199AsnfsTer44p.K199Nfs*44Q9NP80protein_codingTCGA-AO-A128-01Breastbreast invasive carcinomaFemale<65I/IIChemotherapydoxorubicinSD
PNPLA8insertionFrame_Shift_Insnovelc.595_596insGp.Lys199ArgfsTer14p.K199Rfs*14Q9NP80protein_codingTCGA-AO-A128-01Breastbreast invasive carcinomaFemale<65I/IIChemotherapydoxorubicinSD
PNPLA8insertionNonsense_Mutationnovelc.445_446insCACAAGACTATTTGGACTAAp.Asn149ThrfsTer7p.N149Tfs*7Q9NP80protein_codingTCGA-AR-A0U0-01Breastbreast invasive carcinomaFemale>=65I/IIUnknownUnknownSD
PNPLA8insertionNonsense_Mutationnovelc.634_635insGAAAGAATGAATAAGACTTACTATTTGATGGCAAAATAGAGTp.Asn212delinsArgLysAsnGluTerAspLeuLeuPheAspGlyLysIleGluTyrp.N212delinsRKNE*DLLFDGKIEYQ9NP80protein_codingTCGA-AR-A251-01Breastbreast invasive carcinomaFemale<65III/IVChemotherapydoxorubicinSD
PNPLA8SNVMissense_Mutationrs557023667c.1385G>Ap.Arg462Glnp.R462QQ9NP80protein_codingtolerated(0.12)benign(0.164)TCGA-2W-A8YY-01Cervixcervical & endocervical cancerFemale<65I/IIChemotherapycisplatinCR
PNPLA8SNVMissense_Mutationnovelc.1501G>Ap.Glu501Lysp.E501KQ9NP80protein_codingdeleterious(0)possibly_damaging(0.744)TCGA-MA-AA41-01Cervixcervical & endocervical cancerFemale<65I/IIUnknownUnknownSD
Page: 1 2 3 4 5 6 7 8 9 

Top

Related drugs of malignant transformation related genes

check buttonIdentification of chemicals and drugs interact with genes involved in malignant transfromation
(DGIdb 4.0)
Entrez IDSymbolCategoryInteraction TypesDrug Claim NameDrug NamePMIDs
Page: 1