
|
|||||
|
 | |
| |
| |
| |
| |
| |
|
Gene: PLEKHA1 |
Gene summary for PLEKHA1 |
| Gene information | Species | Human | Gene symbol | PLEKHA1 | Gene ID | 59338 |
| Gene name | pleckstrin homology domain containing A1 | |
| Gene Alias | TAPP1 | |
| Cytomap | 10q26.13 | |
| Gene Type | protein-coding | GO ID | GO:0000003 | UniProtAcc | Q9HB21 |
Top |
Malignant transformation analysis |
| Identification of the aberrant gene expression in precancerous and cancerous lesions by comparing the gene expression of stem-like cells in diseased tissues with normal stem cells |
| Entrez ID | Symbol | Replicates | Species | Organ | Tissue | Adj P-value | Log2FC | Malignancy |
| 59338 | PLEKHA1 | LZE4T | Human | Esophagus | ESCC | 1.74e-18 | 6.88e-01 | 0.0811 |
| 59338 | PLEKHA1 | LZE5T | Human | Esophagus | ESCC | 1.65e-02 | 9.05e-02 | 0.0514 |
| 59338 | PLEKHA1 | LZE8T | Human | Esophagus | ESCC | 7.90e-03 | 9.36e-02 | 0.067 |
| 59338 | PLEKHA1 | LZE22T | Human | Esophagus | ESCC | 1.17e-06 | 4.24e-01 | 0.068 |
| 59338 | PLEKHA1 | LZE24T | Human | Esophagus | ESCC | 3.84e-18 | 5.99e-01 | 0.0596 |
| 59338 | PLEKHA1 | P1T-E | Human | Esophagus | ESCC | 2.09e-10 | 7.37e-01 | 0.0875 |
| 59338 | PLEKHA1 | P2T-E | Human | Esophagus | ESCC | 3.85e-29 | 6.53e-01 | 0.1177 |
| 59338 | PLEKHA1 | P4T-E | Human | Esophagus | ESCC | 1.27e-27 | 8.39e-01 | 0.1323 |
| 59338 | PLEKHA1 | P5T-E | Human | Esophagus | ESCC | 1.35e-31 | 7.00e-01 | 0.1327 |
| 59338 | PLEKHA1 | P8T-E | Human | Esophagus | ESCC | 6.00e-44 | 8.67e-01 | 0.0889 |
| 59338 | PLEKHA1 | P9T-E | Human | Esophagus | ESCC | 9.80e-17 | 4.75e-01 | 0.1131 |
| 59338 | PLEKHA1 | P10T-E | Human | Esophagus | ESCC | 6.67e-35 | 7.41e-01 | 0.116 |
| 59338 | PLEKHA1 | P11T-E | Human | Esophagus | ESCC | 5.41e-11 | 5.45e-01 | 0.1426 |
| 59338 | PLEKHA1 | P12T-E | Human | Esophagus | ESCC | 1.08e-49 | 1.25e+00 | 0.1122 |
| 59338 | PLEKHA1 | P15T-E | Human | Esophagus | ESCC | 7.54e-21 | 5.76e-01 | 0.1149 |
| 59338 | PLEKHA1 | P16T-E | Human | Esophagus | ESCC | 2.82e-23 | 3.15e-01 | 0.1153 |
| 59338 | PLEKHA1 | P17T-E | Human | Esophagus | ESCC | 1.35e-06 | 4.84e-01 | 0.1278 |
| 59338 | PLEKHA1 | P19T-E | Human | Esophagus | ESCC | 6.99e-06 | 7.17e-01 | 0.1662 |
| 59338 | PLEKHA1 | P20T-E | Human | Esophagus | ESCC | 1.52e-31 | 8.70e-01 | 0.1124 |
| 59338 | PLEKHA1 | P21T-E | Human | Esophagus | ESCC | 2.72e-31 | 5.19e-01 | 0.1617 |
| Page: 1 2 3 4 5 6 7 |
| Tissue | Expression Dynamics | Abbreviation |
| Esophagus | 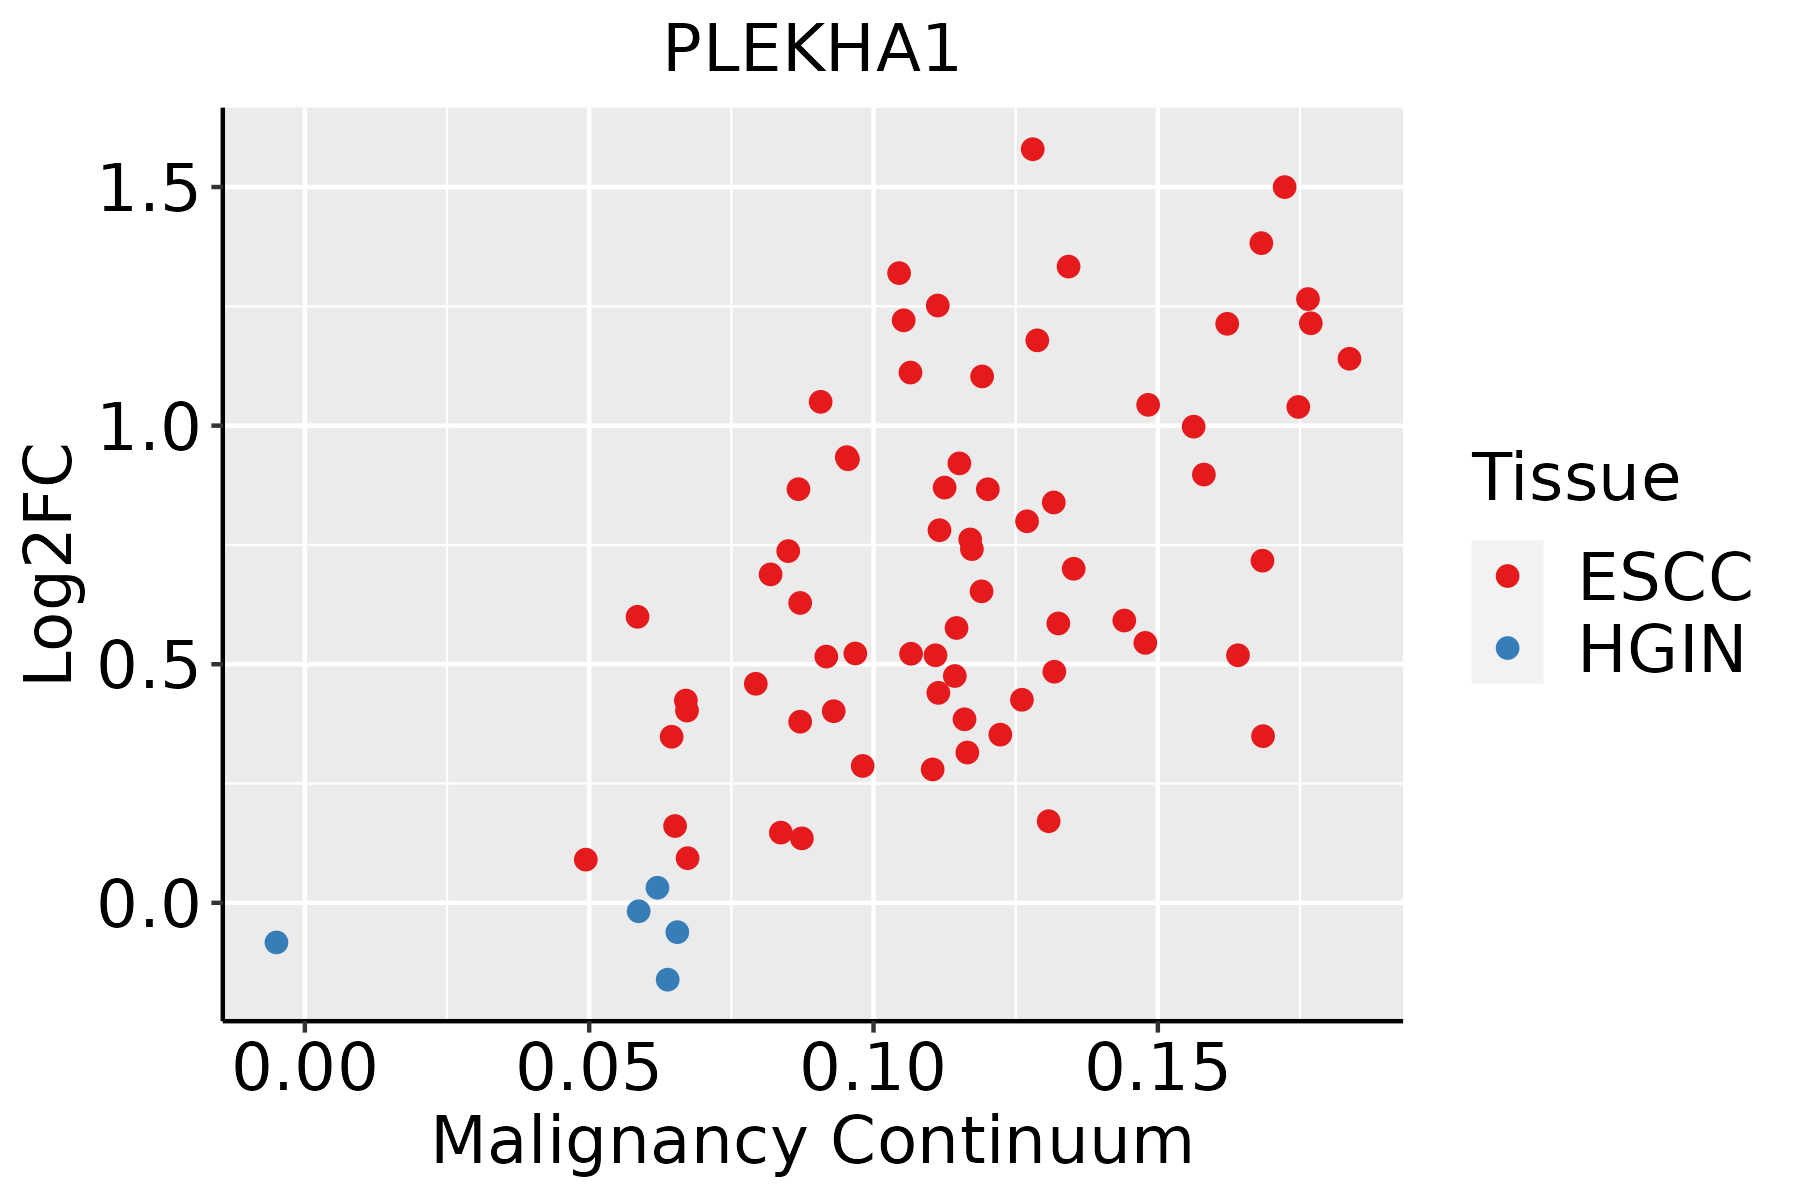 | ESCC: Esophageal squamous cell carcinoma |
| HGIN: High-grade intraepithelial neoplasias | ||
| LGIN: Low-grade intraepithelial neoplasias | ||
| Liver | 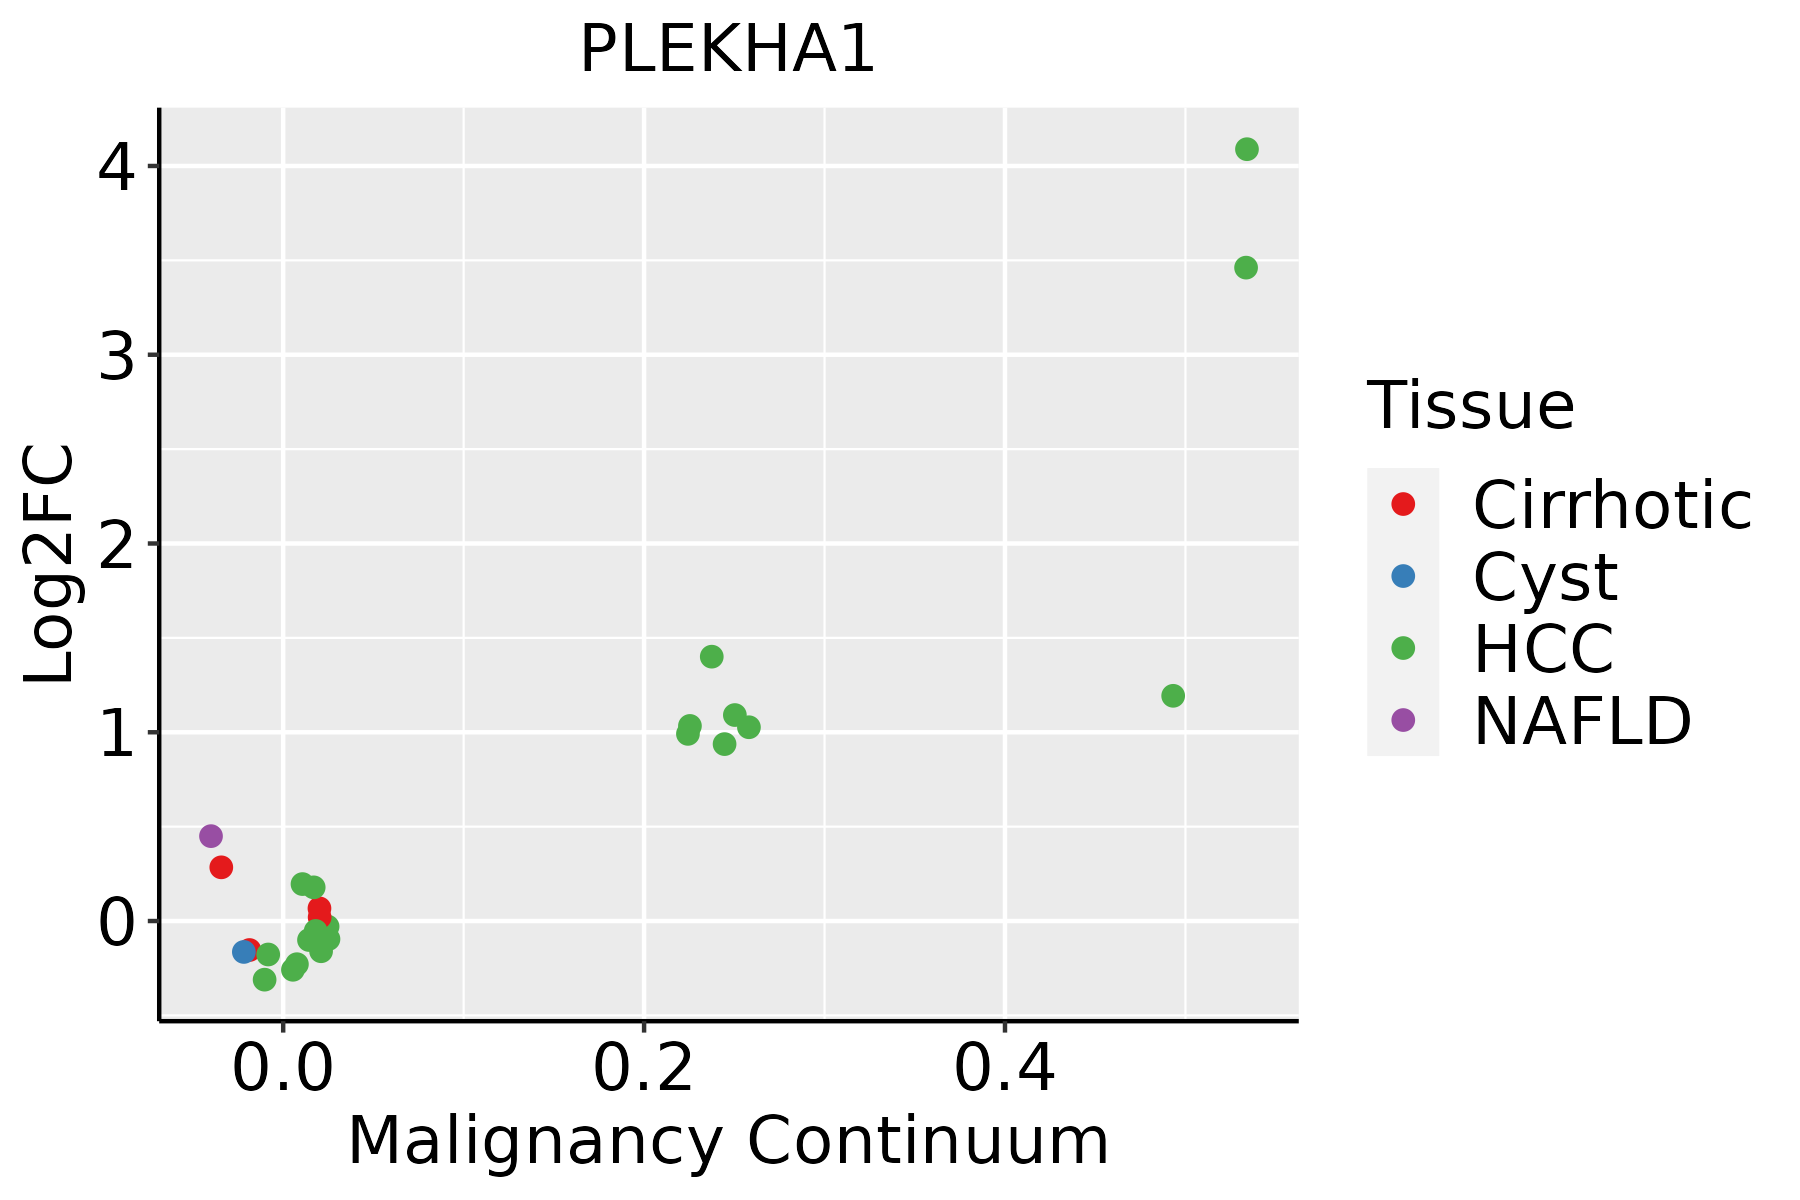 | HCC: Hepatocellular carcinoma |
| NAFLD: Non-alcoholic fatty liver disease | ||
| Oral Cavity | 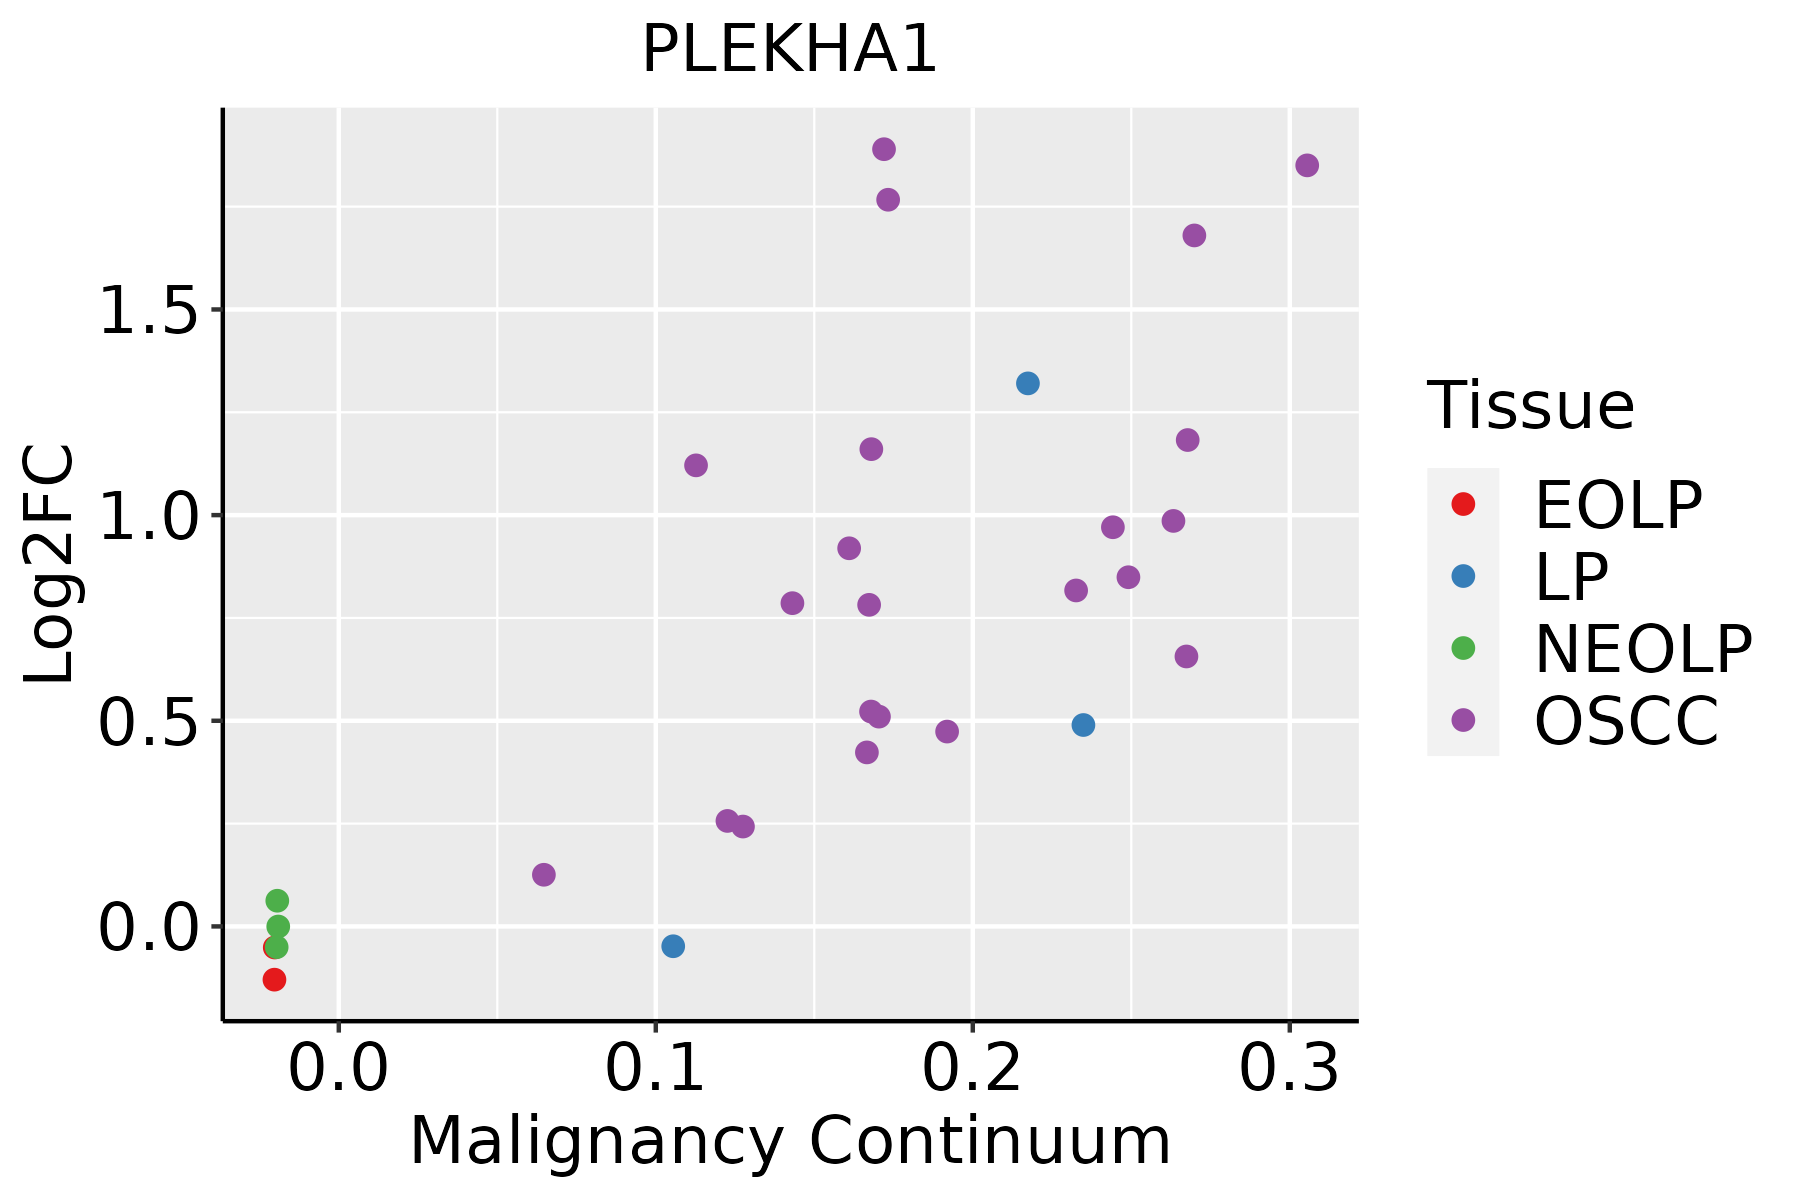 | EOLP: Erosive Oral lichen planus |
| LP: leukoplakia | ||
| NEOLP: Non-erosive oral lichen planus | ||
| OSCC: Oral squamous cell carcinoma | ||
| Skin |  | AK: Actinic keratosis |
| cSCC: Cutaneous squamous cell carcinoma | ||
| SCCIS:squamous cell carcinoma in situ | ||
| Thyroid |  | ATC: Anaplastic thyroid cancer |
| HT: Hashimoto's thyroiditis | ||
| PTC: Papillary thyroid cancer |
| ∗log2FC in expression of this searched gene in stem-like cells from each diseased tissue sample relative to stem-like cells in normal samples in each tissue plotted against the malignancy continuum. Samples are colored based on if they are from different disease stage. |
Top |
Malignant transformation related pathway analysis |
| Find out the enriched GO biological processes and KEGG pathways involved in transition from healthy to precancer to cancer |
| Tissue | Disease Stage | Enriched GO biological Processes |
| Colorectum | AD |  |
| Colorectum | SER |  |
| Colorectum | MSS |  |
| Colorectum | MSI-H |  |
| Colorectum | FAP |  |
| ∗Top 15 enriched GO BP terms are showed in the bar plot of each disease state in each tissue. Each row represents a significant GO biological process which is colored according to the -log10(p.adjust). |
| Page: 1 2 3 4 5 6 7 8 9 |
| GO ID | Tissue | Disease Stage | Description | Gene Ratio | Bg Ratio | pvalue | p.adjust | Count |
| GO:00352646 | Oral cavity | OSCC | multicellular organism growth | 65/7305 | 132/18723 | 1.06e-02 | 3.60e-02 | 65 |
| GO:00518967 | Oral cavity | OSCC | regulation of protein kinase B signaling | 88/7305 | 185/18723 | 1.07e-02 | 3.64e-02 | 88 |
| GO:0060323 | Oral cavity | OSCC | head morphogenesis | 19/7305 | 32/18723 | 1.56e-02 | 5.00e-02 | 19 |
| GO:0006979110 | Oral cavity | LP | response to oxidative stress | 181/4623 | 446/18723 | 5.74e-14 | 6.10e-12 | 181 |
| GO:0000302110 | Oral cavity | LP | response to reactive oxygen species | 95/4623 | 222/18723 | 2.23e-09 | 9.98e-08 | 95 |
| GO:0042542110 | Oral cavity | LP | response to hydrogen peroxide | 68/4623 | 146/18723 | 6.95e-09 | 2.81e-07 | 68 |
| GO:0062197110 | Oral cavity | LP | cellular response to chemical stress | 130/4623 | 337/18723 | 8.94e-09 | 3.52e-07 | 130 |
| GO:0034599110 | Oral cavity | LP | cellular response to oxidative stress | 110/4623 | 288/18723 | 2.19e-07 | 6.65e-06 | 110 |
| GO:0034614110 | Oral cavity | LP | cellular response to reactive oxygen species | 61/4623 | 155/18723 | 3.66e-05 | 5.43e-04 | 61 |
| GO:007030115 | Oral cavity | LP | cellular response to hydrogen peroxide | 40/4623 | 98/18723 | 3.12e-04 | 3.17e-03 | 40 |
| GO:003152915 | Oral cavity | LP | ruffle organization | 25/4623 | 56/18723 | 8.70e-04 | 7.54e-03 | 25 |
| GO:000979112 | Oral cavity | LP | post-embryonic development | 31/4623 | 80/18723 | 3.69e-03 | 2.44e-02 | 31 |
| GO:006145818 | Oral cavity | LP | reproductive system development | 128/4623 | 427/18723 | 6.91e-03 | 3.96e-02 | 128 |
| GO:004860817 | Oral cavity | LP | reproductive structure development | 127/4623 | 424/18723 | 7.31e-03 | 4.08e-02 | 127 |
| GO:004851119 | Skin | AK | rhythmic process | 67/1910 | 298/18723 | 3.47e-10 | 4.37e-08 | 67 |
| GO:000030227 | Skin | AK | response to reactive oxygen species | 53/1910 | 222/18723 | 2.63e-09 | 2.33e-07 | 53 |
| GO:000697928 | Skin | AK | response to oxidative stress | 86/1910 | 446/18723 | 4.23e-09 | 3.30e-07 | 86 |
| GO:006219728 | Skin | AK | cellular response to chemical stress | 66/1910 | 337/18723 | 1.46e-07 | 6.32e-06 | 66 |
| GO:004860819 | Skin | AK | reproductive structure development | 77/1910 | 424/18723 | 3.56e-07 | 1.36e-05 | 77 |
| GO:006145820 | Skin | AK | reproductive system development | 77/1910 | 427/18723 | 4.76e-07 | 1.74e-05 | 77 |
| Page: 1 2 3 4 5 6 7 8 9 |
| Pathway ID | Tissue | Disease Stage | Description | Gene Ratio | Bg Ratio | pvalue | p.adjust | qvalue | Count |
| Page: 1 |
Top |
Cell-cell communication analysis |
| Identification of potential cell-cell interactions between two cell types and their ligand-receptor pairs for different disease states |
| Ligand | Receptor | LRpair | Pathway | Tissue | Disease Stage |
| Page: 1 |
Top |
Single-cell gene regulatory network inference analysis |
| Find out the significant the regulons (TFs) and the target genes of each regulon across cell types for different disease states |
| TF | Cell Type | Tissue | Disease Stage | Target Gene | RSS | Regulon Activity |
| ∗The dot plots of a searched regulon are shown for all cell subpopulations in each disease state of each tissue based on the regulon specific score inferred using pySCENIC and by calculating the average expression. |
| Page: 1 |
Top |
Somatic mutation of malignant transformation related genes |
| Annotation of somatic variants for genes involved in malignant transformation |
| Hugo Symbol | Variant Class | Variant Classification | dbSNP RS | HGVSc | HGVSp | HGVSp Short | SWISSPROT | BIOTYPE | SIFT | PolyPhen | Tumor Sample Barcode | Tissue | Histology | Sex | Age | Stage | Therapy Types | Drugs | Outcome |
| PLEKHA1 | SNV | Missense_Mutation | c.1162N>C | p.Asp388His | p.D388H | Q9HB21 | protein_coding | tolerated(0.1) | benign(0.001) | TCGA-A2-A0YH-01 | Breast | breast invasive carcinoma | Female | <65 | III/IV | Chemotherapy | adriamycin | SD | |
| PLEKHA1 | SNV | Missense_Mutation | c.358G>C | p.Asp120His | p.D120H | Q9HB21 | protein_coding | deleterious(0.01) | possibly_damaging(0.497) | TCGA-BH-A203-01 | Breast | breast invasive carcinoma | Female | >=65 | I/II | Unknown | Unknown | PD | |
| PLEKHA1 | SNV | Missense_Mutation | c.635N>G | p.Tyr212Cys | p.Y212C | Q9HB21 | protein_coding | deleterious(0) | probably_damaging(0.998) | TCGA-E2-A14S-01 | Breast | breast invasive carcinoma | Female | >=65 | I/II | Chemotherapy | cytoxan | SD | |
| PLEKHA1 | deletion | Frame_Shift_Del | novel | c.36delN | p.Leu14Ter | p.L14* | Q9HB21 | protein_coding | TCGA-E2-A15P-01 | Breast | breast invasive carcinoma | Female | <65 | I/II | Hormone Therapy | arimidex | SD | ||
| PLEKHA1 | SNV | Missense_Mutation | rs374805648 | c.389N>A | p.Arg130His | p.R130H | Q9HB21 | protein_coding | tolerated(0.14) | benign(0.411) | TCGA-C5-A1MK-01 | Cervix | cervical & endocervical cancer | Female | >=65 | III/IV | Chemotherapy | carboplatin | PD |
| PLEKHA1 | SNV | Missense_Mutation | c.107N>G | p.Glu36Gly | p.E36G | Q9HB21 | protein_coding | tolerated(0.45) | benign(0.01) | TCGA-AA-3496-01 | Colorectum | colon adenocarcinoma | Female | >=65 | I/II | Unknown | Unknown | SD | |
| PLEKHA1 | SNV | Missense_Mutation | c.487N>C | p.Cys163Arg | p.C163R | Q9HB21 | protein_coding | tolerated(0.53) | benign(0.039) | TCGA-AZ-4615-01 | Colorectum | colon adenocarcinoma | Male | >=65 | III/IV | Chemotherapy | xeloda | PD | |
| PLEKHA1 | SNV | Missense_Mutation | rs765456729 | c.934N>A | p.Ala312Thr | p.A312T | Q9HB21 | protein_coding | tolerated(0.39) | benign(0) | TCGA-AZ-4615-01 | Colorectum | colon adenocarcinoma | Male | >=65 | III/IV | Chemotherapy | xeloda | PD |
| PLEKHA1 | SNV | Missense_Mutation | rs771484933 | c.985C>T | p.Arg329Cys | p.R329C | Q9HB21 | protein_coding | tolerated(0.19) | benign(0) | TCGA-F4-6459-01 | Colorectum | colon adenocarcinoma | Female | <65 | III/IV | Unknown | Unknown | SD |
| PLEKHA1 | SNV | Missense_Mutation | rs769179533 | c.26N>A | p.Arg9His | p.R9H | Q9HB21 | protein_coding | deleterious(0.03) | possibly_damaging(0.802) | TCGA-EI-6917-01 | Colorectum | rectum adenocarcinoma | Male | <65 | III/IV | Chemotherapy | 5fluorouracil+oxaciplatina+l-folinian | SD |
| Page: 1 2 3 4 |
Top |
Related drugs of malignant transformation related genes |
| Identification of chemicals and drugs interact with genes involved in malignant transfromation |
| (DGIdb 4.0) |
| Entrez ID | Symbol | Category | Interaction Types | Drug Claim Name | Drug Name | PMIDs |
| Page: 1 |

Copyright 2023-Present -The University of Texas Health Science Center at Houston |