
|
|||||
|
 | |
| |
| |
| |
| |
| |
|
Gene: PKIB |
Gene summary for PKIB |
| Gene information | Species | Human | Gene symbol | PKIB | Gene ID | 5570 |
| Gene name | cAMP-dependent protein kinase inhibitor beta | |
| Gene Alias | PRKACN2 | |
| Cytomap | 6q22.31 | |
| Gene Type | protein-coding | GO ID | GO:0000723 | UniProtAcc | Q9C010 |
Top |
Malignant transformation analysis |
| Identification of the aberrant gene expression in precancerous and cancerous lesions by comparing the gene expression of stem-like cells in diseased tissues with normal stem cells |
| Entrez ID | Symbol | Replicates | Species | Organ | Tissue | Adj P-value | Log2FC | Malignancy |
| 5570 | PKIB | GSM4909281 | Human | Breast | IDC | 9.32e-07 | -2.56e-01 | 0.21 |
| 5570 | PKIB | GSM4909282 | Human | Breast | IDC | 3.54e-03 | -2.17e-01 | -0.0288 |
| 5570 | PKIB | GSM4909285 | Human | Breast | IDC | 1.05e-04 | -2.50e-01 | 0.21 |
| 5570 | PKIB | GSM4909286 | Human | Breast | IDC | 5.51e-06 | -2.59e-01 | 0.1081 |
| 5570 | PKIB | GSM4909290 | Human | Breast | IDC | 5.58e-11 | 5.36e-01 | 0.2096 |
| 5570 | PKIB | GSM4909291 | Human | Breast | IDC | 1.92e-03 | -2.74e-01 | 0.1753 |
| 5570 | PKIB | GSM4909293 | Human | Breast | IDC | 2.26e-11 | 4.14e-01 | 0.1581 |
| 5570 | PKIB | GSM4909294 | Human | Breast | IDC | 4.05e-06 | 4.13e-01 | 0.2022 |
| 5570 | PKIB | GSM4909296 | Human | Breast | IDC | 1.07e-02 | -1.66e-01 | 0.1524 |
| 5570 | PKIB | GSM4909297 | Human | Breast | IDC | 1.50e-04 | -5.48e-02 | 0.1517 |
| 5570 | PKIB | GSM4909298 | Human | Breast | IDC | 2.64e-08 | -2.71e-01 | 0.1551 |
| 5570 | PKIB | GSM4909301 | Human | Breast | IDC | 9.39e-03 | 3.64e-01 | 0.1577 |
| 5570 | PKIB | GSM4909307 | Human | Breast | IDC | 1.32e-17 | 6.32e-01 | 0.1569 |
| 5570 | PKIB | GSM4909308 | Human | Breast | IDC | 1.80e-72 | 1.09e+00 | 0.158 |
| 5570 | PKIB | GSM4909311 | Human | Breast | IDC | 2.75e-14 | -2.97e-01 | 0.1534 |
| 5570 | PKIB | GSM4909312 | Human | Breast | IDC | 2.37e-11 | -2.66e-01 | 0.1552 |
| 5570 | PKIB | GSM4909319 | Human | Breast | IDC | 8.85e-12 | -2.70e-01 | 0.1563 |
| 5570 | PKIB | GSM4909320 | Human | Breast | IDC | 2.37e-03 | -2.97e-01 | 0.1575 |
| 5570 | PKIB | GSM4909321 | Human | Breast | IDC | 1.02e-05 | 1.69e-01 | 0.1559 |
| 5570 | PKIB | M5 | Human | Breast | IDC | 5.88e-05 | 6.94e-01 | 0.1598 |
| Page: 1 2 3 4 5 |
| Tissue | Expression Dynamics | Abbreviation |
| Breast | 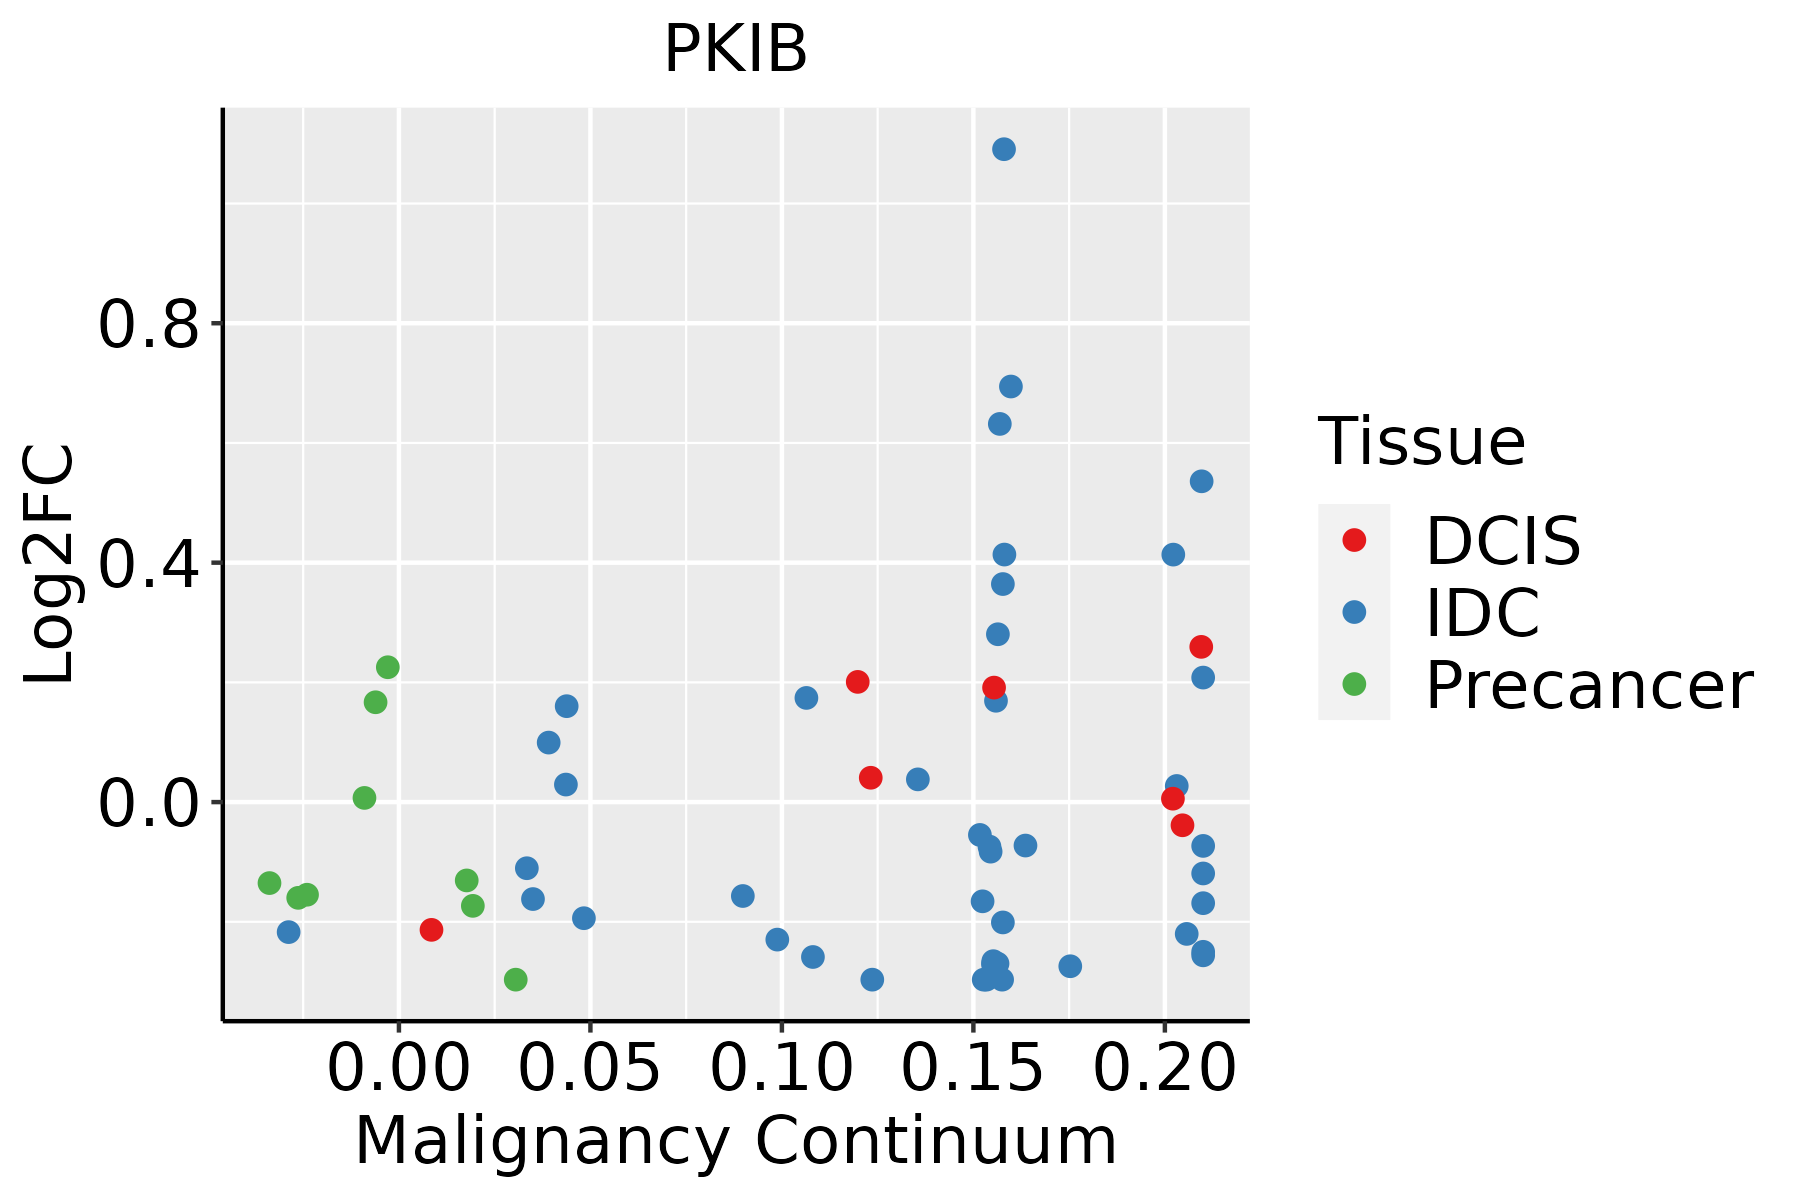 | IDC: Invasive ductal carcinoma |
| DCIS: Ductal carcinoma in situ | ||
| Precancer(BRCA1-mut): Precancerous lesion from BRCA1 mutation carriers | ||
| Colorectum (GSE201348) |  | FAP: Familial adenomatous polyposis |
| CRC: Colorectal cancer | ||
| Colorectum (HTA11) |  | AD: Adenomas |
| SER: Sessile serrated lesions | ||
| MSI-H: Microsatellite-high colorectal cancer | ||
| MSS: Microsatellite stable colorectal cancer | ||
| Esophagus | 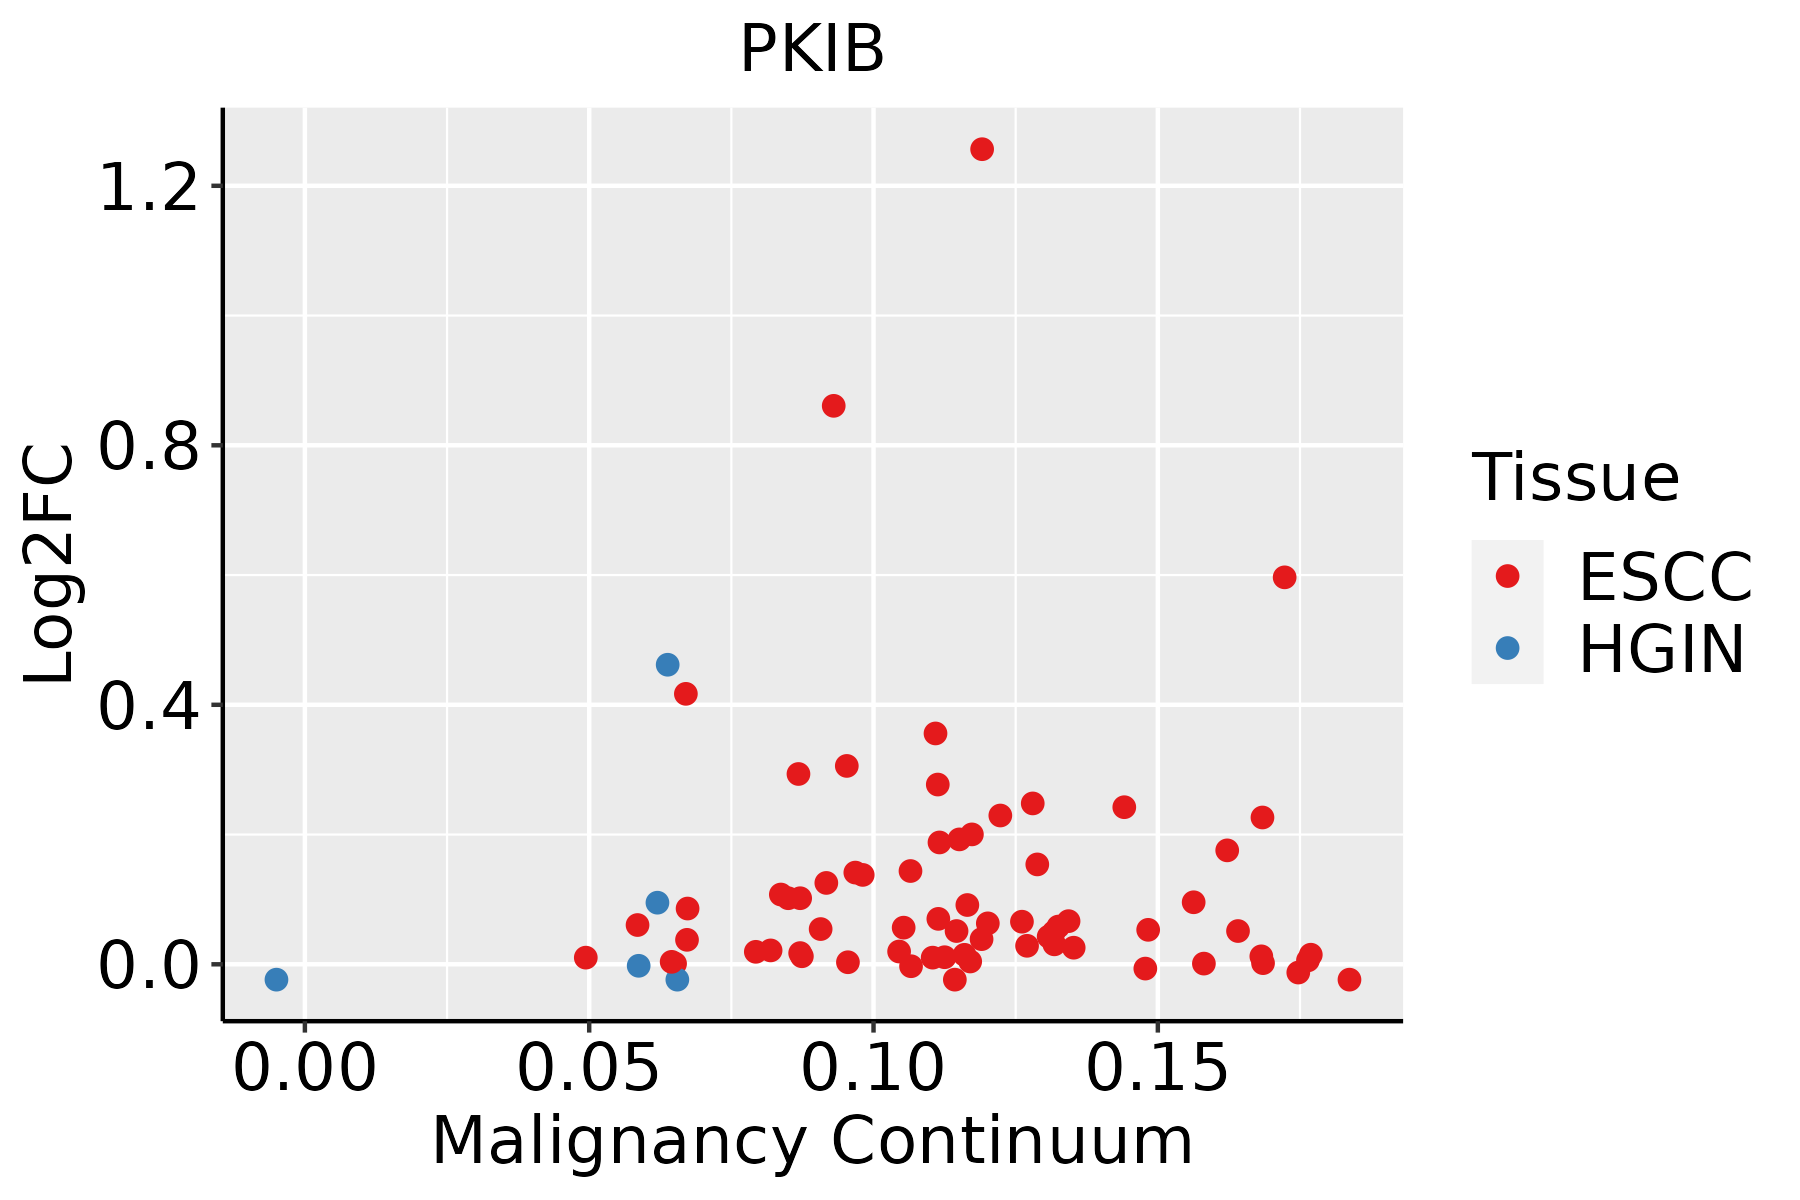 | ESCC: Esophageal squamous cell carcinoma |
| HGIN: High-grade intraepithelial neoplasias | ||
| LGIN: Low-grade intraepithelial neoplasias | ||
| Liver | 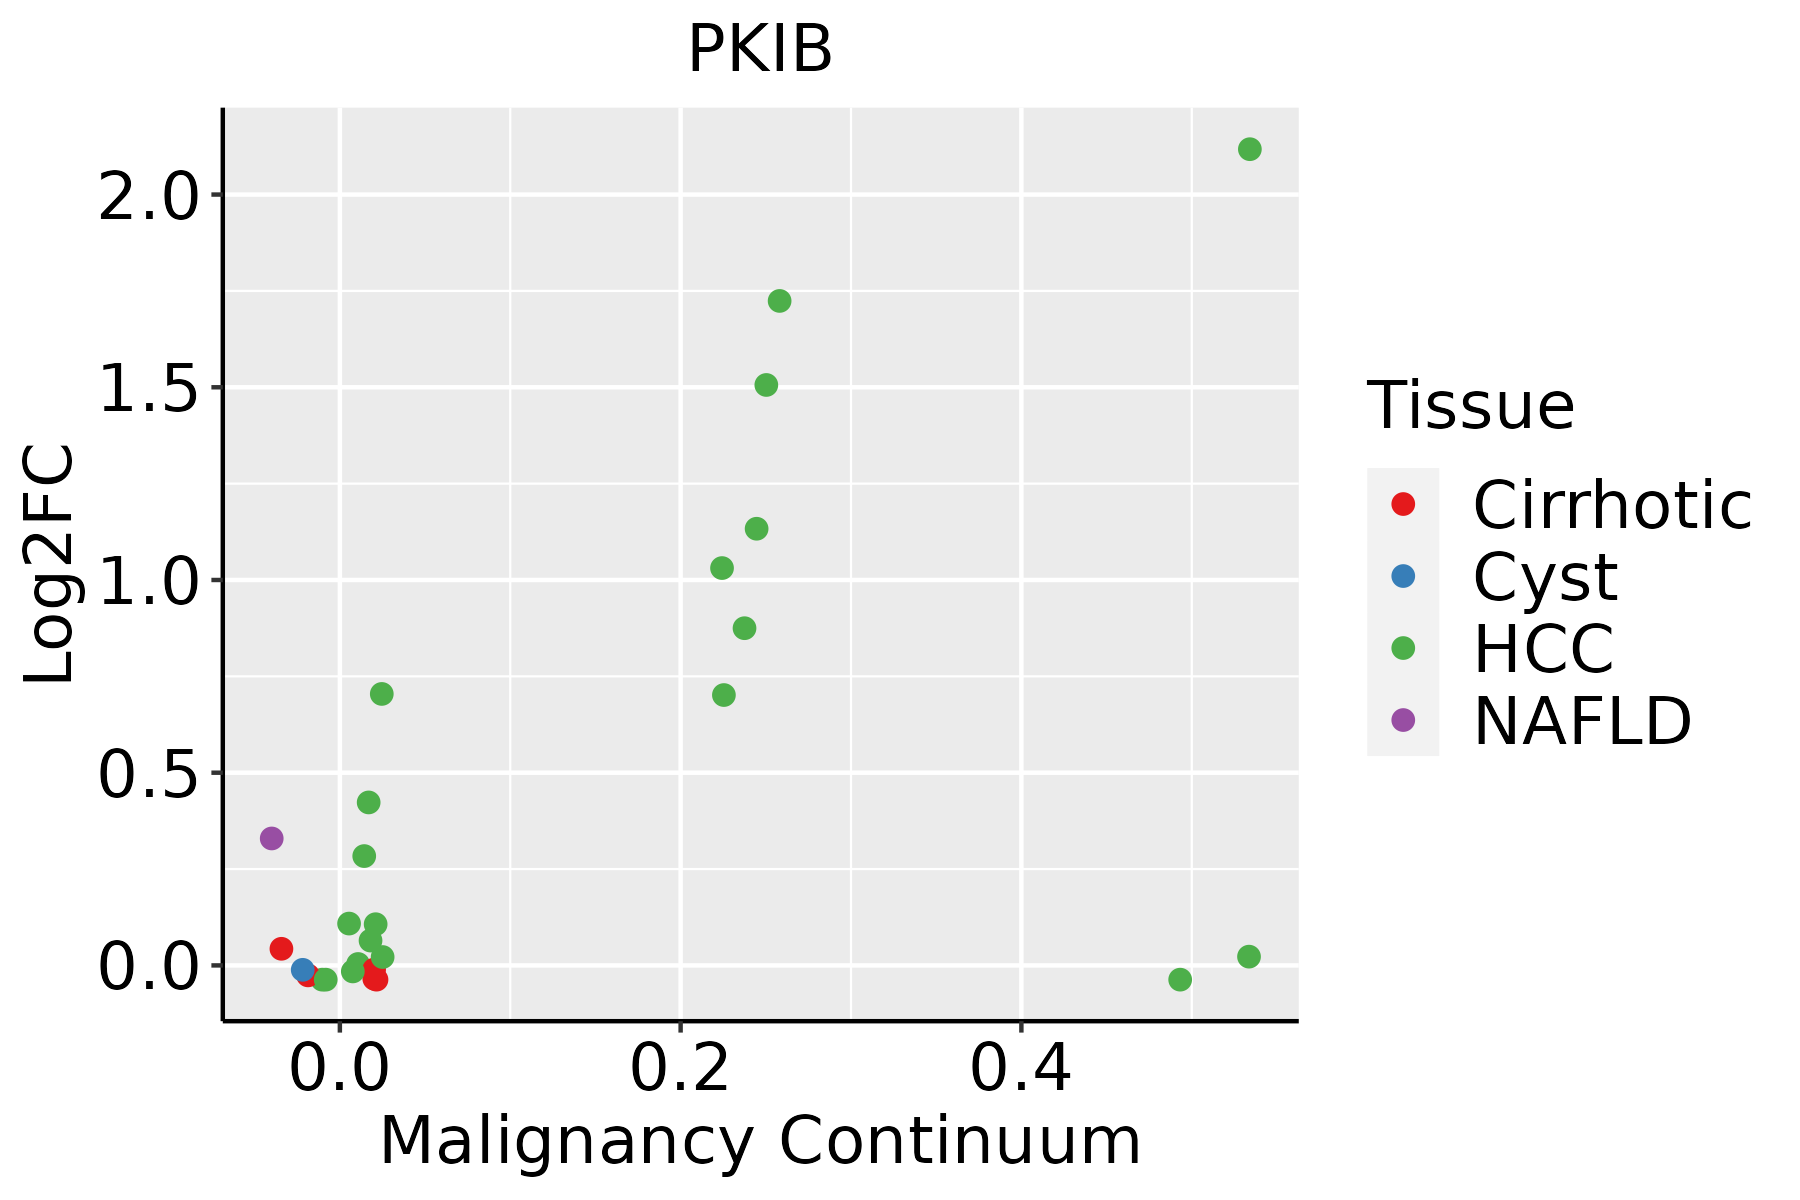 | HCC: Hepatocellular carcinoma |
| NAFLD: Non-alcoholic fatty liver disease | ||
| Lung |  | AAH: Atypical adenomatous hyperplasia |
| AIS: Adenocarcinoma in situ | ||
| IAC: Invasive lung adenocarcinoma | ||
| MIA: Minimally invasive adenocarcinoma | ||
| Prostate | 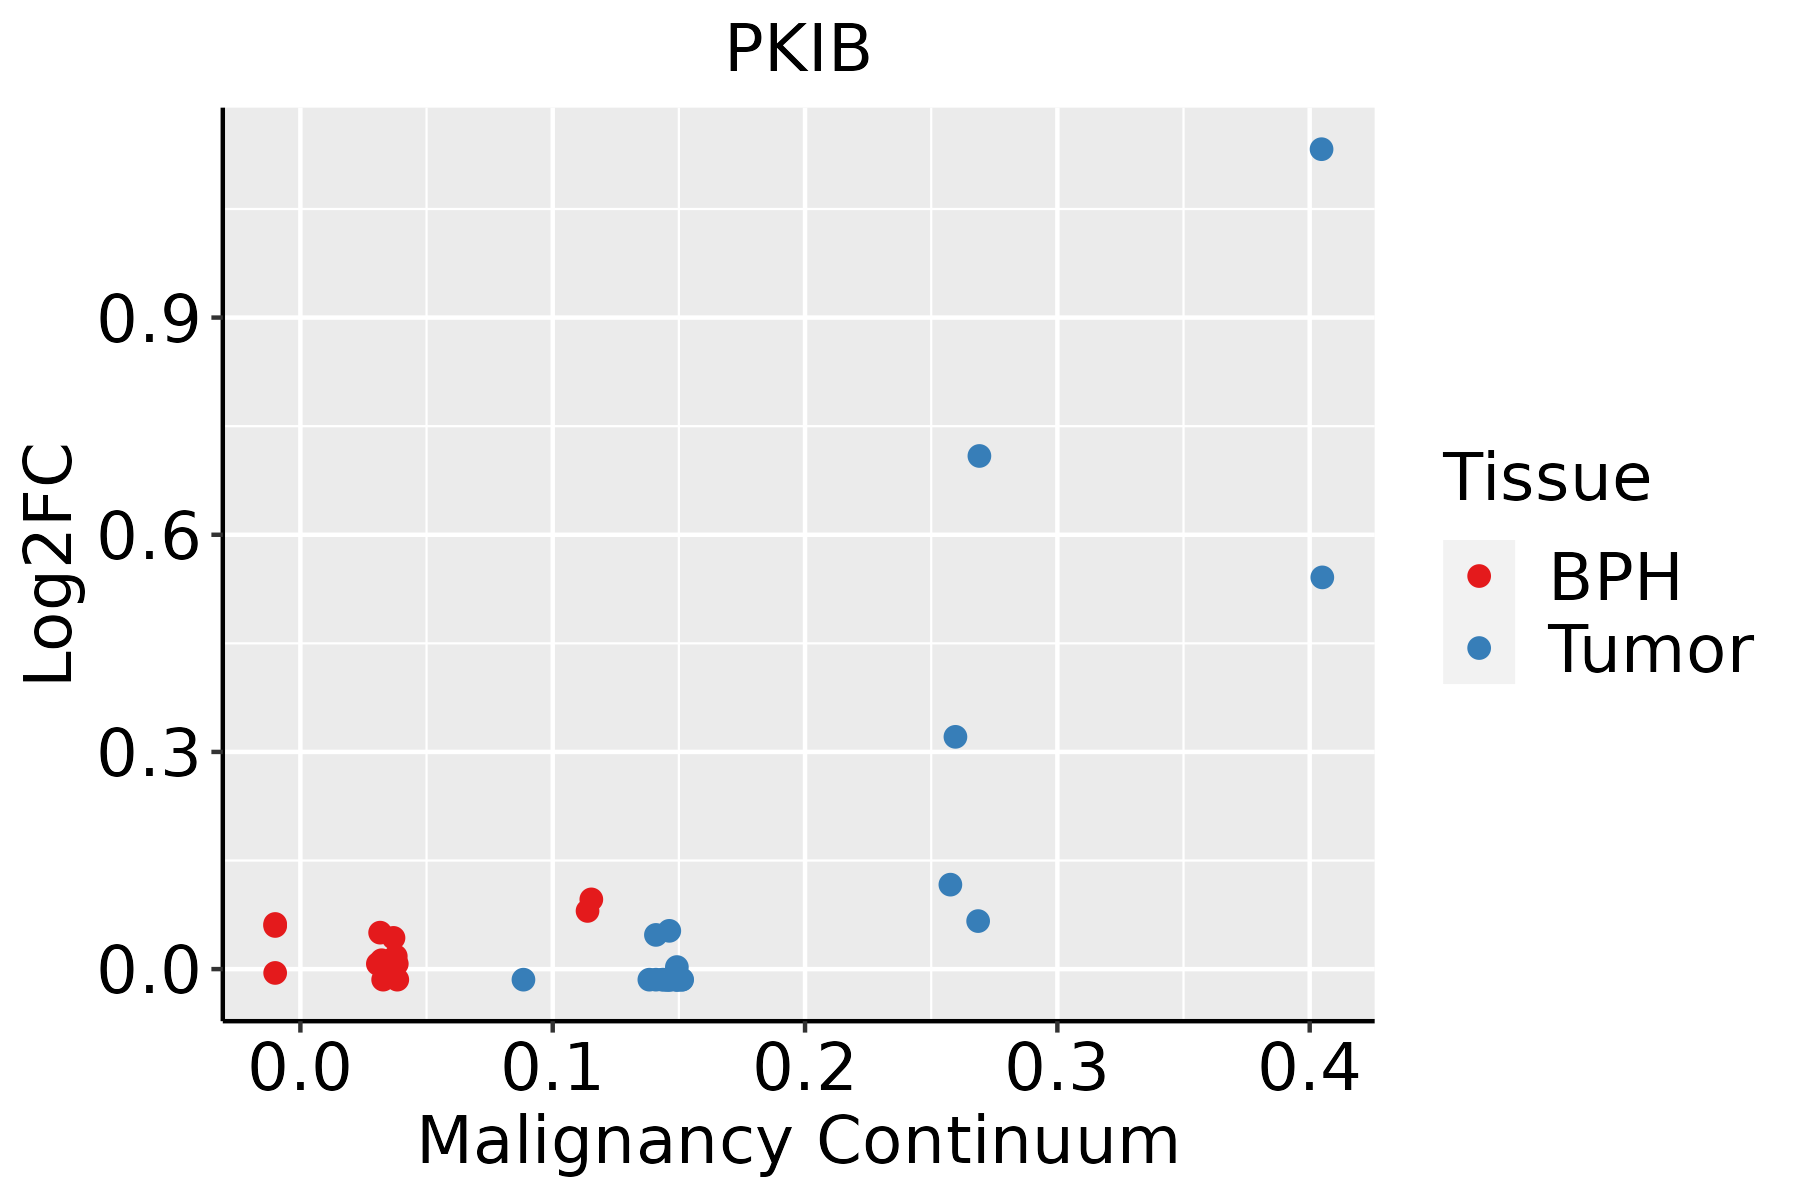 | BPH: Benign Prostatic Hyperplasia |
| ∗log2FC in expression of this searched gene in stem-like cells from each diseased tissue sample relative to stem-like cells in normal samples in each tissue plotted against the malignancy continuum. Samples are colored based on if they are from different disease stage. |
Top |
Malignant transformation related pathway analysis |
| Find out the enriched GO biological processes and KEGG pathways involved in transition from healthy to precancer to cancer |
| Tissue | Disease Stage | Enriched GO biological Processes |
| Colorectum | AD |  |
| Colorectum | SER |  |
| Colorectum | MSS |  |
| Colorectum | MSI-H |  |
| Colorectum | FAP |  |
| ∗Top 15 enriched GO BP terms are showed in the bar plot of each disease state in each tissue. Each row represents a significant GO biological process which is colored according to the -log10(p.adjust). |
| Page: 1 2 3 4 5 6 7 8 9 |
| GO ID | Tissue | Disease Stage | Description | Gene Ratio | Bg Ratio | pvalue | p.adjust | Count |
| GO:20002782 | Colorectum | MSS | regulation of DNA biosynthetic process | 37/3467 | 106/18723 | 4.48e-05 | 8.28e-04 | 37 |
| GO:00019332 | Colorectum | MSS | negative regulation of protein phosphorylation | 93/3467 | 342/18723 | 4.54e-05 | 8.35e-04 | 93 |
| GO:20005732 | Colorectum | MSS | positive regulation of DNA biosynthetic process | 26/3467 | 66/18723 | 5.97e-05 | 1.04e-03 | 26 |
| GO:00322042 | Colorectum | MSS | regulation of telomere maintenance | 29/3467 | 80/18723 | 1.35e-04 | 2.04e-03 | 29 |
| GO:00519731 | Colorectum | MSS | positive regulation of telomerase activity | 16/3467 | 34/18723 | 1.36e-04 | 2.04e-03 | 16 |
| GO:00330441 | Colorectum | MSS | regulation of chromosome organization | 55/3467 | 187/18723 | 1.86e-04 | 2.63e-03 | 55 |
| GO:00322062 | Colorectum | MSS | positive regulation of telomere maintenance | 21/3467 | 52/18723 | 1.98e-04 | 2.78e-03 | 21 |
| GO:00336732 | Colorectum | MSS | negative regulation of kinase activity | 66/3467 | 237/18723 | 2.63e-04 | 3.54e-03 | 66 |
| GO:00719002 | Colorectum | MSS | regulation of protein serine/threonine kinase activity | 93/3467 | 359/18723 | 2.98e-04 | 3.91e-03 | 93 |
| GO:00064692 | Colorectum | MSS | negative regulation of protein kinase activity | 60/3467 | 212/18723 | 3.08e-04 | 4.02e-03 | 60 |
| GO:00108332 | Colorectum | MSS | telomere maintenance via telomere lengthening | 28/3467 | 81/18723 | 4.34e-04 | 5.23e-03 | 28 |
| GO:19043582 | Colorectum | MSS | positive regulation of telomere maintenance via telomere lengthening | 16/3467 | 37/18723 | 4.51e-04 | 5.38e-03 | 16 |
| GO:00322122 | Colorectum | MSS | positive regulation of telomere maintenance via telomerase | 15/3467 | 34/18723 | 5.22e-04 | 5.99e-03 | 15 |
| GO:00007232 | Colorectum | MSS | telomere maintenance | 40/3467 | 131/18723 | 5.86e-04 | 6.49e-03 | 40 |
| GO:19043562 | Colorectum | MSS | regulation of telomere maintenance via telomere lengthening | 22/3467 | 61/18723 | 9.05e-04 | 9.21e-03 | 22 |
| GO:00070041 | Colorectum | MSS | telomere maintenance via telomerase | 24/3467 | 69/18723 | 9.79e-04 | 9.84e-03 | 24 |
| GO:00718972 | Colorectum | MSS | DNA biosynthetic process | 50/3467 | 180/18723 | 1.45e-03 | 1.35e-02 | 50 |
| GO:00062781 | Colorectum | MSS | RNA-dependent DNA biosynthetic process | 24/3467 | 75/18723 | 3.51e-03 | 2.61e-02 | 24 |
| GO:0032210 | Colorectum | MSS | regulation of telomere maintenance via telomerase | 18/3467 | 53/18723 | 5.38e-03 | 3.66e-02 | 18 |
| GO:00510524 | Colorectum | FAP | regulation of DNA metabolic process | 84/2622 | 359/18723 | 9.80e-07 | 4.38e-05 | 84 |
| Page: 1 2 3 4 5 6 7 8 9 10 11 12 13 |
| Pathway ID | Tissue | Disease Stage | Description | Gene Ratio | Bg Ratio | pvalue | p.adjust | qvalue | Count |
| Page: 1 |
Top |
Cell-cell communication analysis |
| Identification of potential cell-cell interactions between two cell types and their ligand-receptor pairs for different disease states |
| Ligand | Receptor | LRpair | Pathway | Tissue | Disease Stage |
| Page: 1 |
Top |
Single-cell gene regulatory network inference analysis |
| Find out the significant the regulons (TFs) and the target genes of each regulon across cell types for different disease states |
| TF | Cell Type | Tissue | Disease Stage | Target Gene | RSS | Regulon Activity |
| ∗The dot plots of a searched regulon are shown for all cell subpopulations in each disease state of each tissue based on the regulon specific score inferred using pySCENIC and by calculating the average expression. |
| Page: 1 |
Top |
Somatic mutation of malignant transformation related genes |
| Annotation of somatic variants for genes involved in malignant transformation |
| Hugo Symbol | Variant Class | Variant Classification | dbSNP RS | HGVSc | HGVSp | HGVSp Short | SWISSPROT | BIOTYPE | SIFT | PolyPhen | Tumor Sample Barcode | Tissue | Histology | Sex | Age | Stage | Therapy Types | Drugs | Outcome |
| PKIB | SNV | Missense_Mutation | novel | c.31G>T | p.Asp11Tyr | p.D11Y | Q9C010 | protein_coding | deleterious_low_confidence(0) | possibly_damaging(0.87) | TCGA-OL-A6VO-01 | Breast | breast invasive carcinoma | Female | <65 | I/II | Chemotherapy | taxotere | CR |
| PKIB | SNV | Missense_Mutation | c.105N>G | p.Asn35Lys | p.N35K | Q9C010 | protein_coding | deleterious(0) | probably_damaging(0.999) | TCGA-A6-2686-01 | Colorectum | colon adenocarcinoma | Female | >=65 | I/II | Unknown | Unknown | SD | |
| PKIB | SNV | Missense_Mutation | rs752581156 | c.98N>A | p.Arg33His | p.R33H | Q9C010 | protein_coding | deleterious(0) | probably_damaging(1) | TCGA-A6-3808-01 | Colorectum | colon adenocarcinoma | Male | >=65 | I/II | Unknown | Unknown | SD |
| PKIB | SNV | Missense_Mutation | c.62N>A | p.Gly21Glu | p.G21E | Q9C010 | protein_coding | tolerated(0.08) | possibly_damaging(0.522) | TCGA-G4-6304-01 | Colorectum | colon adenocarcinoma | Female | >=65 | I/II | Chemotherapy | fluorouracil | PD | |
| PKIB | deletion | Frame_Shift_Del | novel | c.64delG | p.Val22SerfsTer40 | p.V22Sfs*40 | Q9C010 | protein_coding | TCGA-AA-3949-01 | Colorectum | colon adenocarcinoma | Female | >=65 | III/IV | Unknown | Unknown | SD | ||
| PKIB | SNV | Missense_Mutation | novel | c.101N>A | p.Arg34Gln | p.R34Q | Q9C010 | protein_coding | deleterious(0) | probably_damaging(0.999) | TCGA-B5-A3FC-01 | Endometrium | uterine corpus endometrioid carcinoma | Female | <65 | I/II | Unknown | Unknown | SD |
| PKIB | SNV | Missense_Mutation | novel | c.210N>C | p.Glu70Asp | p.E70D | Q9C010 | protein_coding | deleterious(0.02) | possibly_damaging(0.755) | TCGA-BS-A0UF-01 | Endometrium | uterine corpus endometrioid carcinoma | Female | >=65 | I/II | Unknown | Unknown | SD |
| PKIB | SNV | Missense_Mutation | novel | c.116N>G | p.Asp39Gly | p.D39G | Q9C010 | protein_coding | deleterious(0) | probably_damaging(1) | TCGA-EO-A22R-01 | Endometrium | uterine corpus endometrioid carcinoma | Female | <65 | I/II | Unknown | Unknown | SD |
| PKIB | SNV | Missense_Mutation | c.199N>C | p.Glu67Gln | p.E67Q | Q9C010 | protein_coding | tolerated(0.51) | benign(0.005) | TCGA-33-6737-01 | Lung | lung squamous cell carcinoma | Male | >=65 | III/IV | Chemotherapy | gemcitabine | PD | |
| PKIB | SNV | Missense_Mutation | novel | c.45N>T | p.Met15Ile | p.M15I | Q9C010 | protein_coding | deleterious(0) | probably_damaging(0.98) | TCGA-NC-A5HI-01 | Lung | lung squamous cell carcinoma | Female | >=65 | I/II | Chemotherapy | cisplatin | CR |
| Page: 1 |
Top |
Related drugs of malignant transformation related genes |
| Identification of chemicals and drugs interact with genes involved in malignant transfromation |
| (DGIdb 4.0) |
| Entrez ID | Symbol | Category | Interaction Types | Drug Claim Name | Drug Name | PMIDs |
| Page: 1 |

Copyright 2023-Present -The University of Texas Health Science Center at Houston |