
|
|||||
|
 | |
| |
| |
| |
| |
| |
|
Gene: PIP4K2C |
Gene summary for PIP4K2C |
| Gene information | Species | Human | Gene symbol | PIP4K2C | Gene ID | 79837 |
| Gene name | phosphatidylinositol-5-phosphate 4-kinase type 2 gamma | |
| Gene Alias | PIP5K2C | |
| Cytomap | 12q13.3 | |
| Gene Type | protein-coding | GO ID | GO:0000045 | UniProtAcc | B3KQV3 |
Top |
Malignant transformation analysis |
| Identification of the aberrant gene expression in precancerous and cancerous lesions by comparing the gene expression of stem-like cells in diseased tissues with normal stem cells |
| Entrez ID | Symbol | Replicates | Species | Organ | Tissue | Adj P-value | Log2FC | Malignancy |
| 79837 | PIP4K2C | LZE4T | Human | Esophagus | ESCC | 1.37e-09 | 2.11e-01 | 0.0811 |
| 79837 | PIP4K2C | LZE7T | Human | Esophagus | ESCC | 4.08e-11 | 4.36e-01 | 0.0667 |
| 79837 | PIP4K2C | LZE8T | Human | Esophagus | ESCC | 1.42e-03 | 1.60e-01 | 0.067 |
| 79837 | PIP4K2C | LZE20T | Human | Esophagus | ESCC | 1.53e-03 | 1.68e-01 | 0.0662 |
| 79837 | PIP4K2C | LZE22T | Human | Esophagus | ESCC | 2.82e-03 | 2.68e-01 | 0.068 |
| 79837 | PIP4K2C | LZE24T | Human | Esophagus | ESCC | 1.48e-15 | 4.61e-01 | 0.0596 |
| 79837 | PIP4K2C | LZE21T | Human | Esophagus | ESCC | 6.49e-04 | 2.82e-01 | 0.0655 |
| 79837 | PIP4K2C | LZE6T | Human | Esophagus | ESCC | 9.76e-03 | 1.64e-01 | 0.0845 |
| 79837 | PIP4K2C | P1T-E | Human | Esophagus | ESCC | 2.82e-04 | 2.73e-01 | 0.0875 |
| 79837 | PIP4K2C | P2T-E | Human | Esophagus | ESCC | 5.50e-15 | 3.47e-01 | 0.1177 |
| 79837 | PIP4K2C | P4T-E | Human | Esophagus | ESCC | 1.27e-12 | 2.51e-01 | 0.1323 |
| 79837 | PIP4K2C | P5T-E | Human | Esophagus | ESCC | 3.90e-12 | 2.71e-01 | 0.1327 |
| 79837 | PIP4K2C | P8T-E | Human | Esophagus | ESCC | 1.97e-14 | 3.72e-01 | 0.0889 |
| 79837 | PIP4K2C | P9T-E | Human | Esophagus | ESCC | 1.27e-02 | 1.49e-01 | 0.1131 |
| 79837 | PIP4K2C | P10T-E | Human | Esophagus | ESCC | 5.10e-10 | 1.58e-01 | 0.116 |
| 79837 | PIP4K2C | P11T-E | Human | Esophagus | ESCC | 4.25e-05 | 4.25e-01 | 0.1426 |
| 79837 | PIP4K2C | P12T-E | Human | Esophagus | ESCC | 1.63e-17 | 3.19e-01 | 0.1122 |
| 79837 | PIP4K2C | P15T-E | Human | Esophagus | ESCC | 7.74e-18 | 4.03e-01 | 0.1149 |
| 79837 | PIP4K2C | P16T-E | Human | Esophagus | ESCC | 1.67e-10 | 1.93e-01 | 0.1153 |
| 79837 | PIP4K2C | P17T-E | Human | Esophagus | ESCC | 1.10e-10 | 4.94e-01 | 0.1278 |
| Page: 1 2 3 4 5 |
| Tissue | Expression Dynamics | Abbreviation |
| Esophagus | 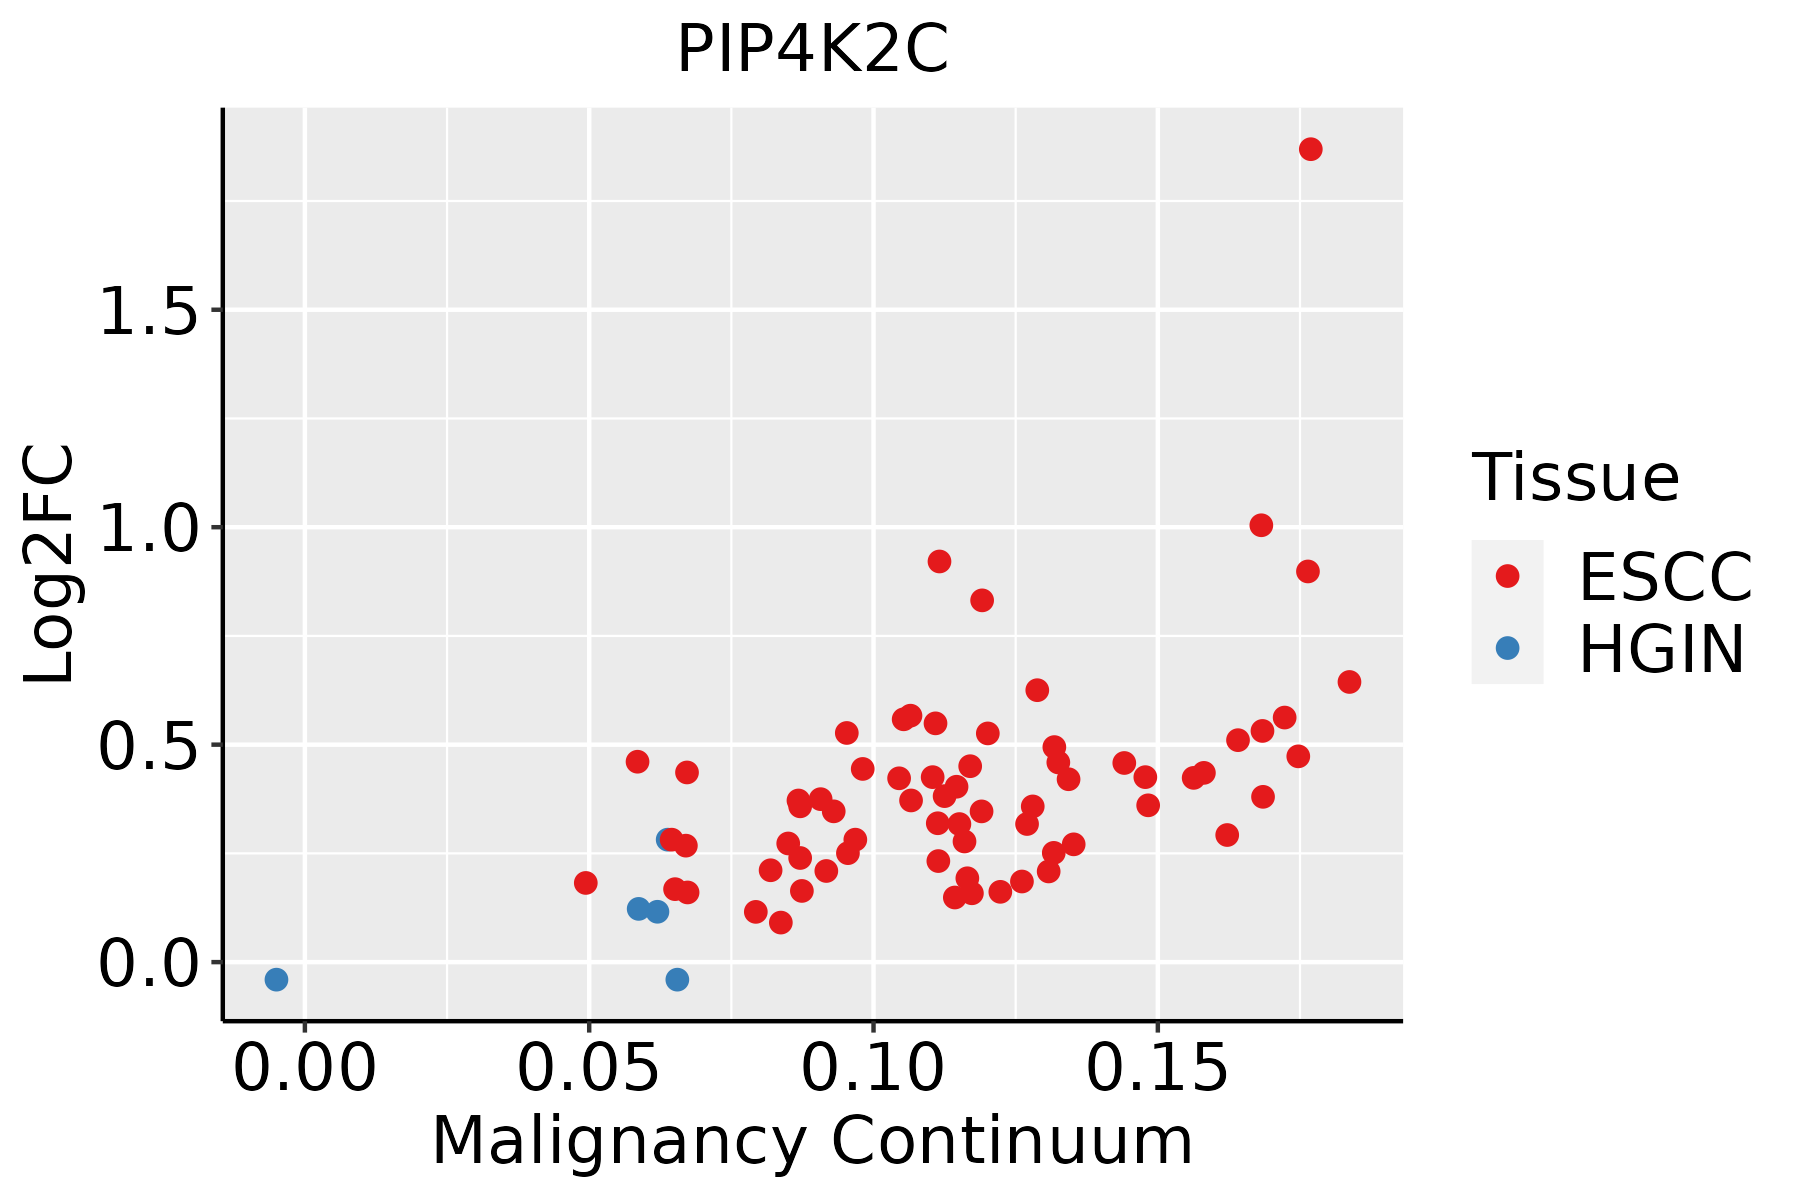 | ESCC: Esophageal squamous cell carcinoma |
| HGIN: High-grade intraepithelial neoplasias | ||
| LGIN: Low-grade intraepithelial neoplasias | ||
| Liver |  | HCC: Hepatocellular carcinoma |
| NAFLD: Non-alcoholic fatty liver disease | ||
| Oral Cavity | 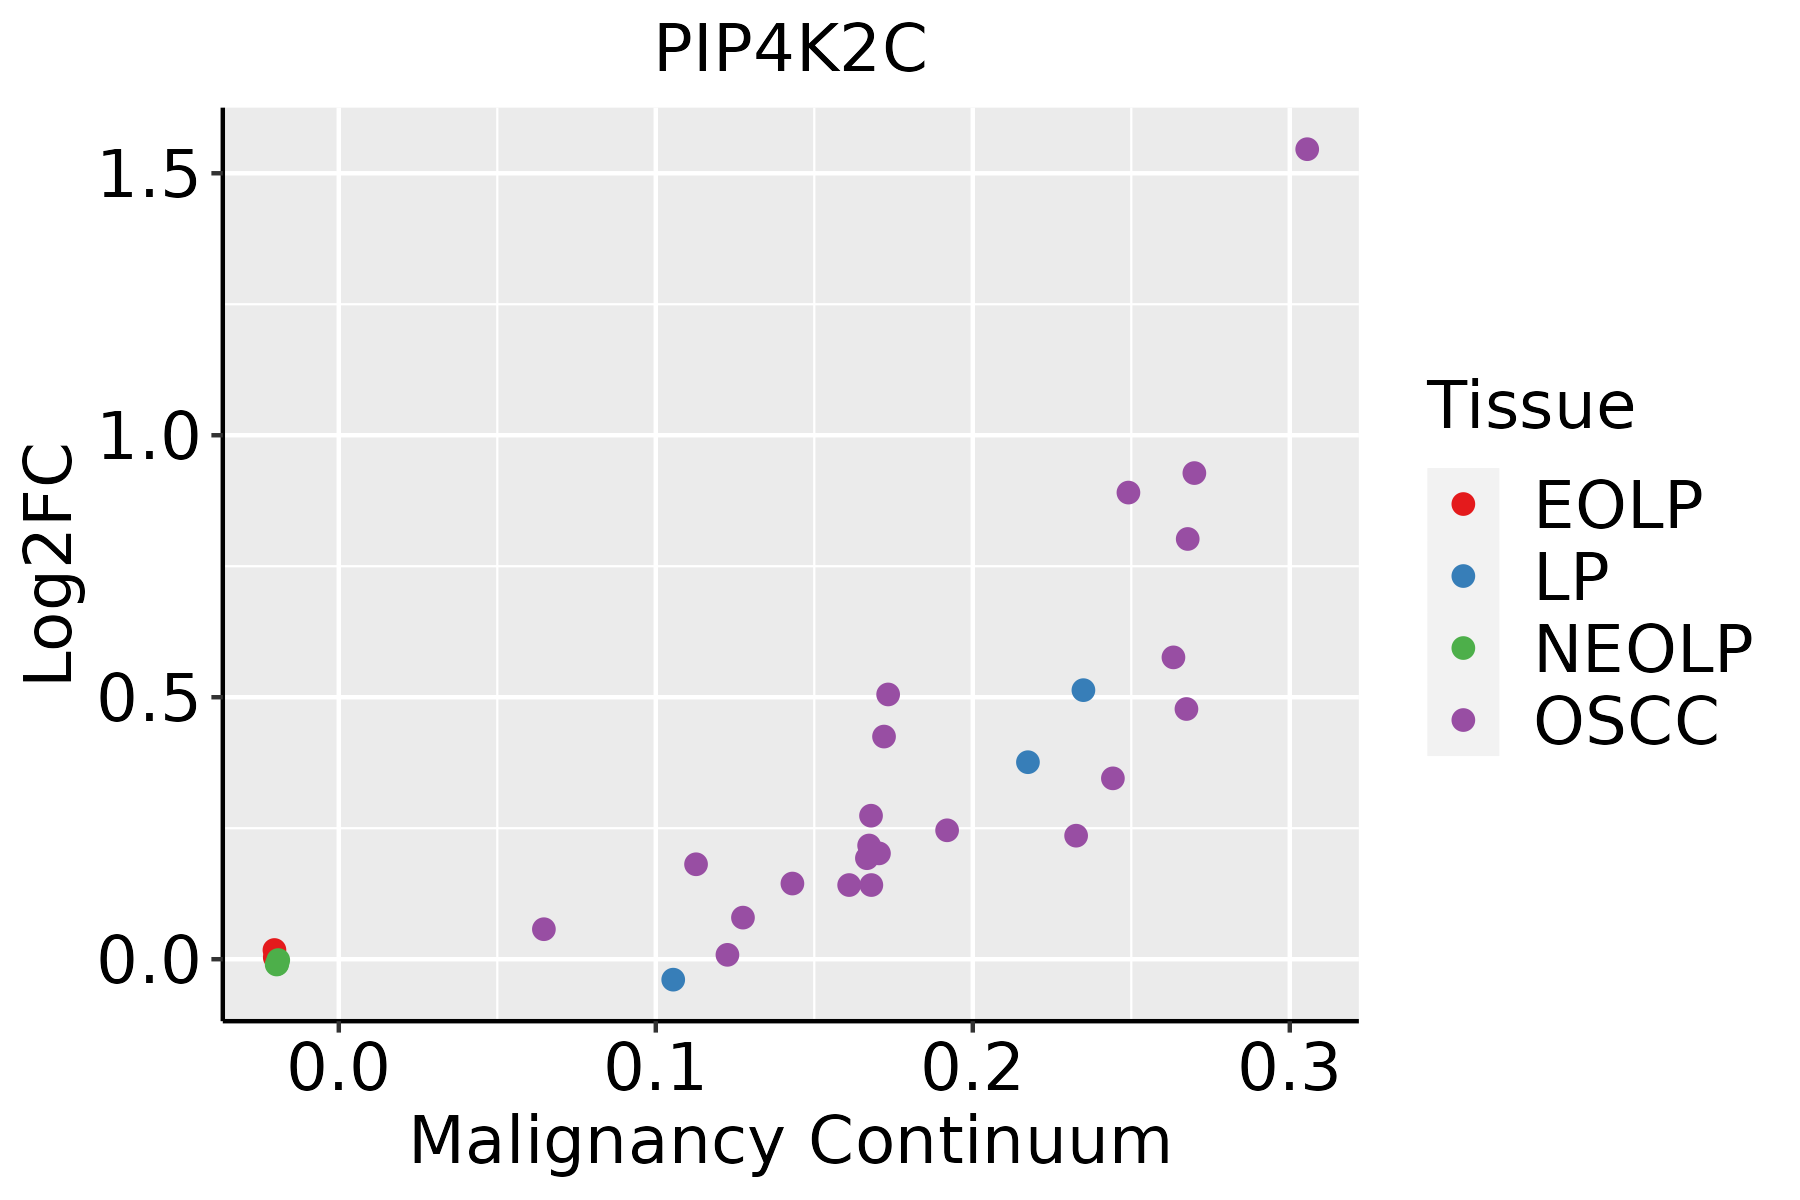 | EOLP: Erosive Oral lichen planus |
| LP: leukoplakia | ||
| NEOLP: Non-erosive oral lichen planus | ||
| OSCC: Oral squamous cell carcinoma |
| ∗log2FC in expression of this searched gene in stem-like cells from each diseased tissue sample relative to stem-like cells in normal samples in each tissue plotted against the malignancy continuum. Samples are colored based on if they are from different disease stage. |
Top |
Malignant transformation related pathway analysis |
| Find out the enriched GO biological processes and KEGG pathways involved in transition from healthy to precancer to cancer |
| Tissue | Disease Stage | Enriched GO biological Processes |
| Colorectum | AD |  |
| Colorectum | SER |  |
| Colorectum | MSS |  |
| Colorectum | MSI-H |  |
| Colorectum | FAP |  |
| ∗Top 15 enriched GO BP terms are showed in the bar plot of each disease state in each tissue. Each row represents a significant GO biological process which is colored according to the -log10(p.adjust). |
| Page: 1 2 3 4 5 6 7 8 9 |
| GO ID | Tissue | Disease Stage | Description | Gene Ratio | Bg Ratio | pvalue | p.adjust | Count |
| GO:004232619 | Oral cavity | OSCC | negative regulation of phosphorylation | 214/7305 | 385/18723 | 2.30e-11 | 7.74e-10 | 214 |
| GO:003367317 | Oral cavity | OSCC | negative regulation of kinase activity | 140/7305 | 237/18723 | 2.74e-10 | 7.57e-09 | 140 |
| GO:190165316 | Oral cavity | OSCC | cellular response to peptide | 194/7305 | 359/18723 | 4.31e-09 | 9.57e-08 | 194 |
| GO:19021155 | Oral cavity | OSCC | regulation of organelle assembly | 109/7305 | 186/18723 | 4.54e-08 | 8.45e-07 | 109 |
| GO:00105087 | Oral cavity | OSCC | positive regulation of autophagy | 77/7305 | 124/18723 | 1.59e-07 | 2.61e-06 | 77 |
| GO:003286916 | Oral cavity | OSCC | cellular response to insulin stimulus | 114/7305 | 203/18723 | 5.07e-07 | 7.41e-06 | 114 |
| GO:007137510 | Oral cavity | OSCC | cellular response to peptide hormone stimulus | 153/7305 | 290/18723 | 1.23e-06 | 1.63e-05 | 153 |
| GO:004343419 | Oral cavity | OSCC | response to peptide hormone | 208/7305 | 414/18723 | 1.83e-06 | 2.35e-05 | 208 |
| GO:19050374 | Oral cavity | OSCC | autophagosome organization | 63/7305 | 103/18723 | 4.30e-06 | 4.98e-05 | 63 |
| GO:003286816 | Oral cavity | OSCC | response to insulin | 138/7305 | 264/18723 | 7.54e-06 | 8.15e-05 | 138 |
| GO:00000454 | Oral cavity | OSCC | autophagosome assembly | 60/7305 | 99/18723 | 1.09e-05 | 1.14e-04 | 60 |
| GO:00082868 | Oral cavity | OSCC | insulin receptor signaling pathway | 67/7305 | 116/18723 | 3.23e-05 | 2.91e-04 | 67 |
| GO:00086543 | Oral cavity | OSCC | phospholipid biosynthetic process | 130/7305 | 253/18723 | 3.96e-05 | 3.46e-04 | 130 |
| GO:00440883 | Oral cavity | OSCC | regulation of vacuole organization | 31/7305 | 45/18723 | 4.70e-05 | 3.95e-04 | 31 |
| GO:00162393 | Oral cavity | OSCC | positive regulation of macroautophagy | 40/7305 | 63/18723 | 7.19e-05 | 5.67e-04 | 40 |
| GO:19021173 | Oral cavity | OSCC | positive regulation of organelle assembly | 41/7305 | 67/18723 | 1.94e-04 | 1.30e-03 | 41 |
| GO:20007852 | Oral cavity | OSCC | regulation of autophagosome assembly | 26/7305 | 39/18723 | 4.33e-04 | 2.63e-03 | 26 |
| GO:00466263 | Oral cavity | OSCC | regulation of insulin receptor signaling pathway | 38/7305 | 66/18723 | 1.70e-03 | 8.07e-03 | 38 |
| GO:19000763 | Oral cavity | OSCC | regulation of cellular response to insulin stimulus | 37/7305 | 64/18723 | 1.76e-03 | 8.31e-03 | 37 |
| GO:00192167 | Oral cavity | OSCC | regulation of lipid metabolic process | 154/7305 | 331/18723 | 3.00e-03 | 1.30e-02 | 154 |
| Page: 1 2 3 4 5 6 7 |
| Pathway ID | Tissue | Disease Stage | Description | Gene Ratio | Bg Ratio | pvalue | p.adjust | qvalue | Count |
| hsa0481028 | Esophagus | ESCC | Regulation of actin cytoskeleton | 133/4205 | 229/8465 | 5.94e-03 | 1.48e-02 | 7.56e-03 | 133 |
| hsa04810112 | Esophagus | ESCC | Regulation of actin cytoskeleton | 133/4205 | 229/8465 | 5.94e-03 | 1.48e-02 | 7.56e-03 | 133 |
| hsa0481041 | Liver | HCC | Regulation of actin cytoskeleton | 134/4020 | 229/8465 | 4.48e-04 | 1.94e-03 | 1.08e-03 | 134 |
| hsa0481051 | Liver | HCC | Regulation of actin cytoskeleton | 134/4020 | 229/8465 | 4.48e-04 | 1.94e-03 | 1.08e-03 | 134 |
| hsa0481026 | Oral cavity | OSCC | Regulation of actin cytoskeleton | 129/3704 | 229/8465 | 7.14e-05 | 2.74e-04 | 1.40e-04 | 129 |
| hsa04810111 | Oral cavity | OSCC | Regulation of actin cytoskeleton | 129/3704 | 229/8465 | 7.14e-05 | 2.74e-04 | 1.40e-04 | 129 |
| Page: 1 |
Top |
Cell-cell communication analysis |
| Identification of potential cell-cell interactions between two cell types and their ligand-receptor pairs for different disease states |
| Ligand | Receptor | LRpair | Pathway | Tissue | Disease Stage |
| Page: 1 |
Top |
Single-cell gene regulatory network inference analysis |
| Find out the significant the regulons (TFs) and the target genes of each regulon across cell types for different disease states |
| TF | Cell Type | Tissue | Disease Stage | Target Gene | RSS | Regulon Activity |
| ∗The dot plots of a searched regulon are shown for all cell subpopulations in each disease state of each tissue based on the regulon specific score inferred using pySCENIC and by calculating the average expression. |
| Page: 1 |
Top |
Somatic mutation of malignant transformation related genes |
| Annotation of somatic variants for genes involved in malignant transformation |
| Hugo Symbol | Variant Class | Variant Classification | dbSNP RS | HGVSc | HGVSp | HGVSp Short | SWISSPROT | BIOTYPE | SIFT | PolyPhen | Tumor Sample Barcode | Tissue | Histology | Sex | Age | Stage | Therapy Types | Drugs | Outcome |
| PIP4K2C | SNV | Missense_Mutation | c.777N>C | p.Lys259Asn | p.K259N | Q8TBX8 | protein_coding | deleterious(0.03) | possibly_damaging(0.838) | TCGA-A8-A094-01 | Breast | breast invasive carcinoma | Female | >=65 | I/II | Unknown | Unknown | SD | |
| PIP4K2C | SNV | Missense_Mutation | c.955N>G | p.Pro319Ala | p.P319A | Q8TBX8 | protein_coding | tolerated(0.3) | benign(0.003) | TCGA-AC-A2B8-01 | Breast | breast invasive carcinoma | Female | >=65 | I/II | Chemotherapy | chemo | PD | |
| PIP4K2C | SNV | Missense_Mutation | c.494N>G | p.Asn165Ser | p.N165S | Q8TBX8 | protein_coding | deleterious(0) | benign(0.005) | TCGA-B6-A0RP-01 | Breast | breast invasive carcinoma | Female | >=65 | I/II | Unknown | Unknown | PD | |
| PIP4K2C | SNV | Missense_Mutation | c.192N>T | p.Gln64His | p.Q64H | Q8TBX8 | protein_coding | tolerated(1) | benign(0) | TCGA-E2-A15S-01 | Breast | breast invasive carcinoma | Female | <65 | I/II | Chemotherapy | doxorubicin | SD | |
| PIP4K2C | SNV | Missense_Mutation | novel | c.910N>A | p.Glu304Lys | p.E304K | Q8TBX8 | protein_coding | tolerated(0.33) | possibly_damaging(0.881) | TCGA-LD-A74U-01 | Breast | breast invasive carcinoma | Female | >=65 | III/IV | Chemotherapy | taxotere | SD |
| PIP4K2C | SNV | Missense_Mutation | novel | c.259C>T | p.His87Tyr | p.H87Y | Q8TBX8 | protein_coding | deleterious(0.02) | possibly_damaging(0.742) | TCGA-PE-A5DE-01 | Breast | breast invasive carcinoma | Female | <65 | I/II | Chemotherapy | taxotere | CR |
| PIP4K2C | deletion | Frame_Shift_Del | c.333delN | p.Arg112ValfsTer63 | p.R112Vfs*63 | Q8TBX8 | protein_coding | TCGA-BH-A18T-01 | Breast | breast invasive carcinoma | Female | >=65 | I/II | Unknown | Unknown | PD | |||
| PIP4K2C | deletion | Frame_Shift_Del | novel | c.558delN | p.Met188CysfsTer15 | p.M188Cfs*15 | Q8TBX8 | protein_coding | TCGA-D8-A27V-01 | Breast | breast invasive carcinoma | Female | <65 | I/II | Hormone Therapy | tamoxiphen | SD | ||
| PIP4K2C | SNV | Missense_Mutation | novel | c.679N>A | p.Glu227Lys | p.E227K | Q8TBX8 | protein_coding | deleterious(0.04) | possibly_damaging(0.775) | TCGA-C5-A8YR-01 | Cervix | cervical & endocervical cancer | Female | <65 | I/II | Unknown | Unknown | PD |
| PIP4K2C | SNV | Missense_Mutation | rs140234878 | c.611N>A | p.Arg204His | p.R204H | Q8TBX8 | protein_coding | deleterious(0.03) | probably_damaging(0.996) | TCGA-AA-3977-01 | Colorectum | colon adenocarcinoma | Male | >=65 | I/II | Unknown | Unknown | SD |
| Page: 1 2 3 4 5 |
Top |
Related drugs of malignant transformation related genes |
| Identification of chemicals and drugs interact with genes involved in malignant transfromation |
| (DGIdb 4.0) |
| Entrez ID | Symbol | Category | Interaction Types | Drug Claim Name | Drug Name | PMIDs |
| Page: 1 |

Copyright 2023-Present -The University of Texas Health Science Center at Houston |