Schematic overview of the cellular and molecular mechanisms involved in the cancer progression, including the proposed cellular and molecular mechanisms in cancer cells trajectory. AT1: alveolar type 1 cells; AT2: alveolar type 2 cells; AAH: atypical adenomatous hyperplasia; AIS: adenocarcinoma in situ; MIA: minimally invasive adenocarcinoma; IA: invasive adenocarcinoma; EMT: epithelial-mesenchymal transition

Home

Download

Statistics

Help

Contact

Center for Computational Systems Medicine
leaf

Gene summary

leaf

Malignant transformation analysis

leaf

Malignant transformation related pathway analysis

leaf

Cell-cell communication analysis

leaf

Single-cell gene regulatory network inference analysis

leaf

Somatic mutation of malignant transformation related genes

leaf

Related drugs of malignant transformation related genes

Gene: PHF23

Gene summary for PHF23

check button Gene summary.

Gene informationSpeciesHuman
Gene symbol

PHF23

Gene ID

79142

Gene namePHD finger protein 23
Gene AliashJUNE-1b
Cytomap17p13.1
Gene Typeprotein-coding
GO ID

GO:0000045

UniProtAcc

Q9BUL5


Top

Malignant transformation analysis

check button Identification of the aberrant gene expression in precancerous and cancerous lesions by comparing the gene expression of stem-like cells in diseased tissues with normal stem cells
check button Malignant transformation involving gene list.
Entrez IDSymbolReplicatesSpeciesOrganTissueAdj P-valueLog2FCMalignancy
79142PHF23LZE4THumanEsophagusESCC9.87e-079.05e-020.0811
79142PHF23LZE7THumanEsophagusESCC2.42e-021.59e-010.0667
79142PHF23LZE20THumanEsophagusESCC1.35e-023.37e-020.0662
79142PHF23LZE24THumanEsophagusESCC6.57e-123.82e-010.0596
79142PHF23P1T-EHumanEsophagusESCC3.59e-032.73e-010.0875
79142PHF23P2T-EHumanEsophagusESCC1.38e-112.71e-010.1177
79142PHF23P4T-EHumanEsophagusESCC5.98e-204.73e-010.1323
79142PHF23P5T-EHumanEsophagusESCC2.18e-129.24e-020.1327
79142PHF23P8T-EHumanEsophagusESCC4.69e-141.17e-010.0889
79142PHF23P9T-EHumanEsophagusESCC1.13e-081.97e-010.1131
79142PHF23P10T-EHumanEsophagusESCC7.63e-101.25e-010.116
79142PHF23P12T-EHumanEsophagusESCC7.05e-163.83e-010.1122
79142PHF23P15T-EHumanEsophagusESCC5.82e-081.05e-010.1149
79142PHF23P16T-EHumanEsophagusESCC4.38e-102.58e-010.1153
79142PHF23P17T-EHumanEsophagusESCC4.10e-082.45e-010.1278
79142PHF23P20T-EHumanEsophagusESCC1.63e-089.66e-020.1124
79142PHF23P21T-EHumanEsophagusESCC1.23e-121.82e-010.1617
79142PHF23P22T-EHumanEsophagusESCC2.23e-111.90e-010.1236
79142PHF23P23T-EHumanEsophagusESCC2.41e-143.67e-010.108
79142PHF23P24T-EHumanEsophagusESCC1.47e-102.28e-010.1287
Page: 1 2 3 4 

check button Transcriptomic changes along malignancy continuum.
TissueExpression DynamicsAbbreviation
EsophagusThe image shows the transcriptomic changes along malignancy continuum.log2FC in expression of this searched gene in stem-like cells from each diseased tissue sample relative to stem-like cells in normal samples in each tissue plotted against the malignancy continuum. Samples are colored based on if they are from different disease stage.
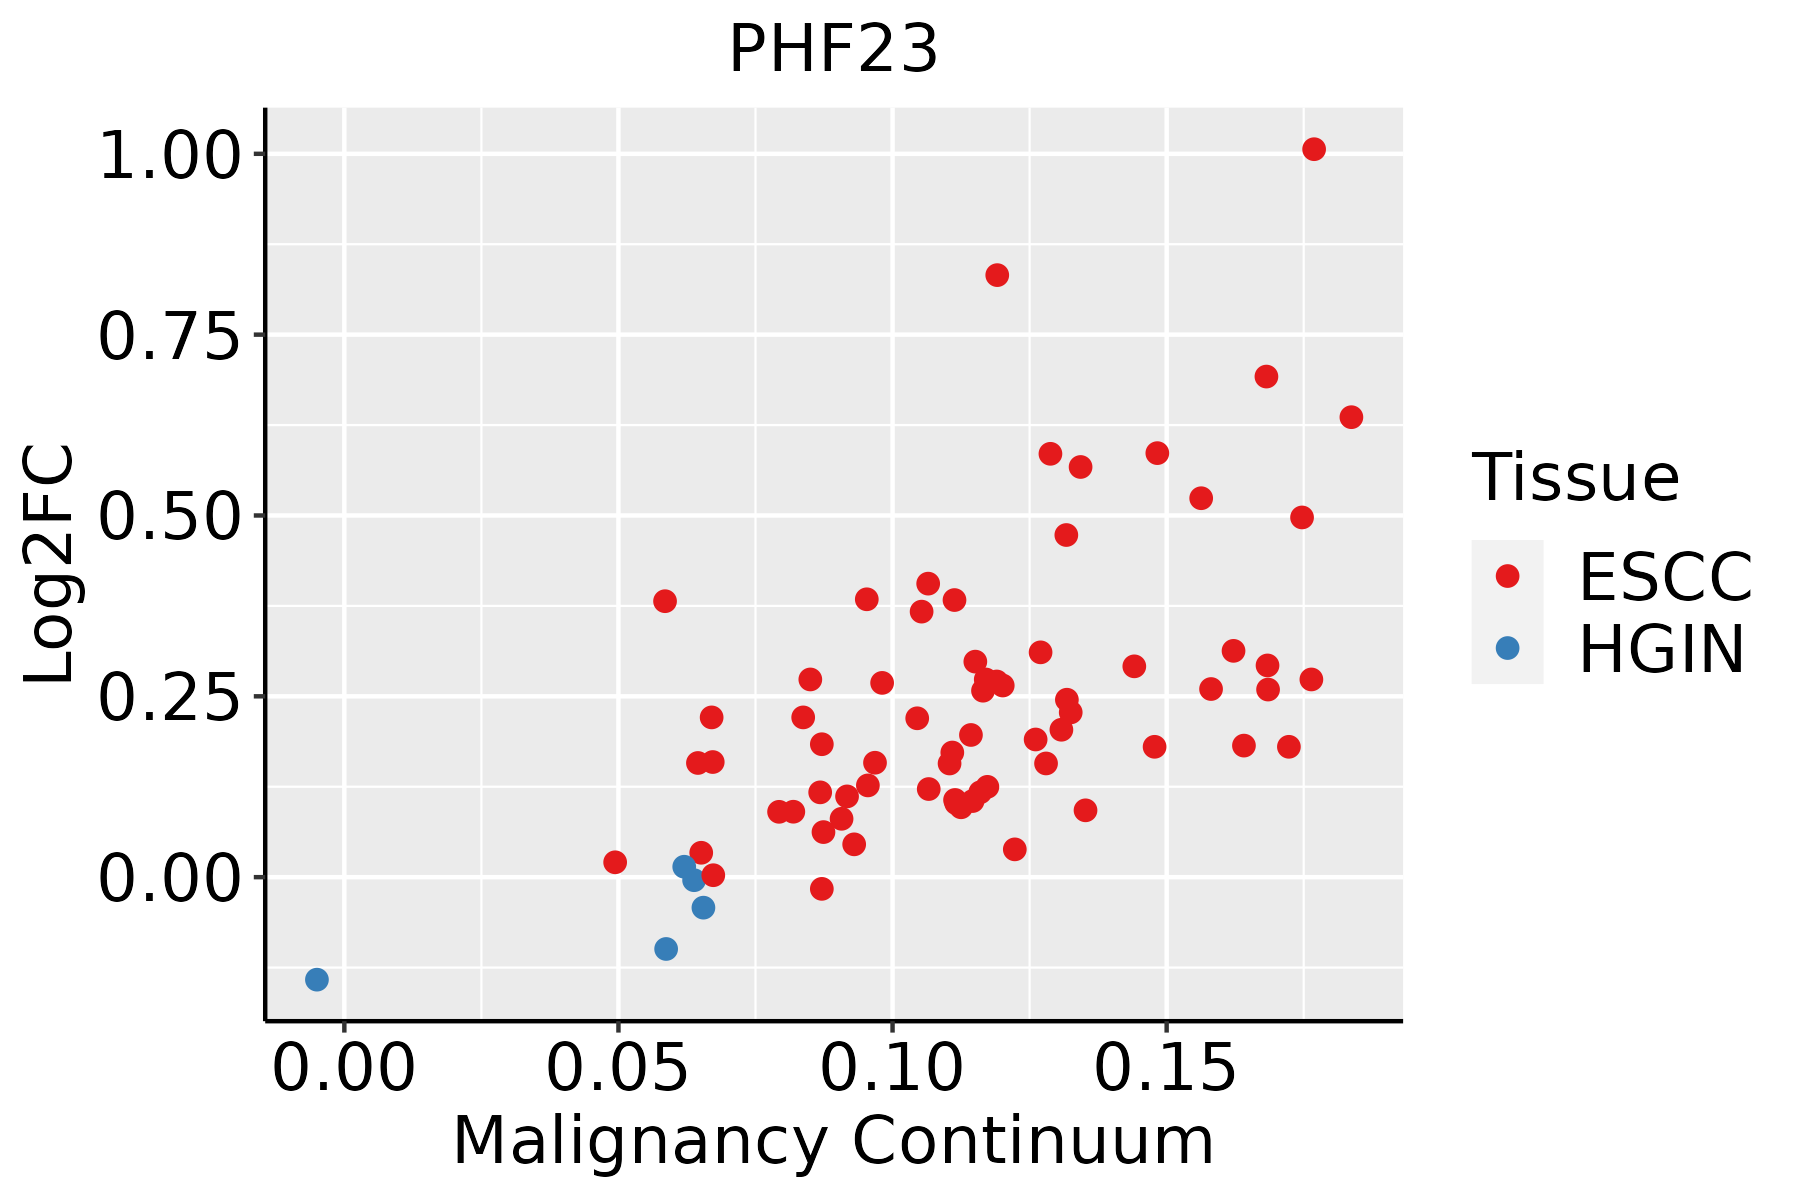
ESCC: Esophageal squamous cell carcinoma
HGIN: High-grade intraepithelial neoplasias
LGIN: Low-grade intraepithelial neoplasias
LiverThe image shows the transcriptomic changes along malignancy continuum.log2FC in expression of this searched gene in stem-like cells from each diseased tissue sample relative to stem-like cells in normal samples in each tissue plotted against the malignancy continuum. Samples are colored based on if they are from different disease stage.
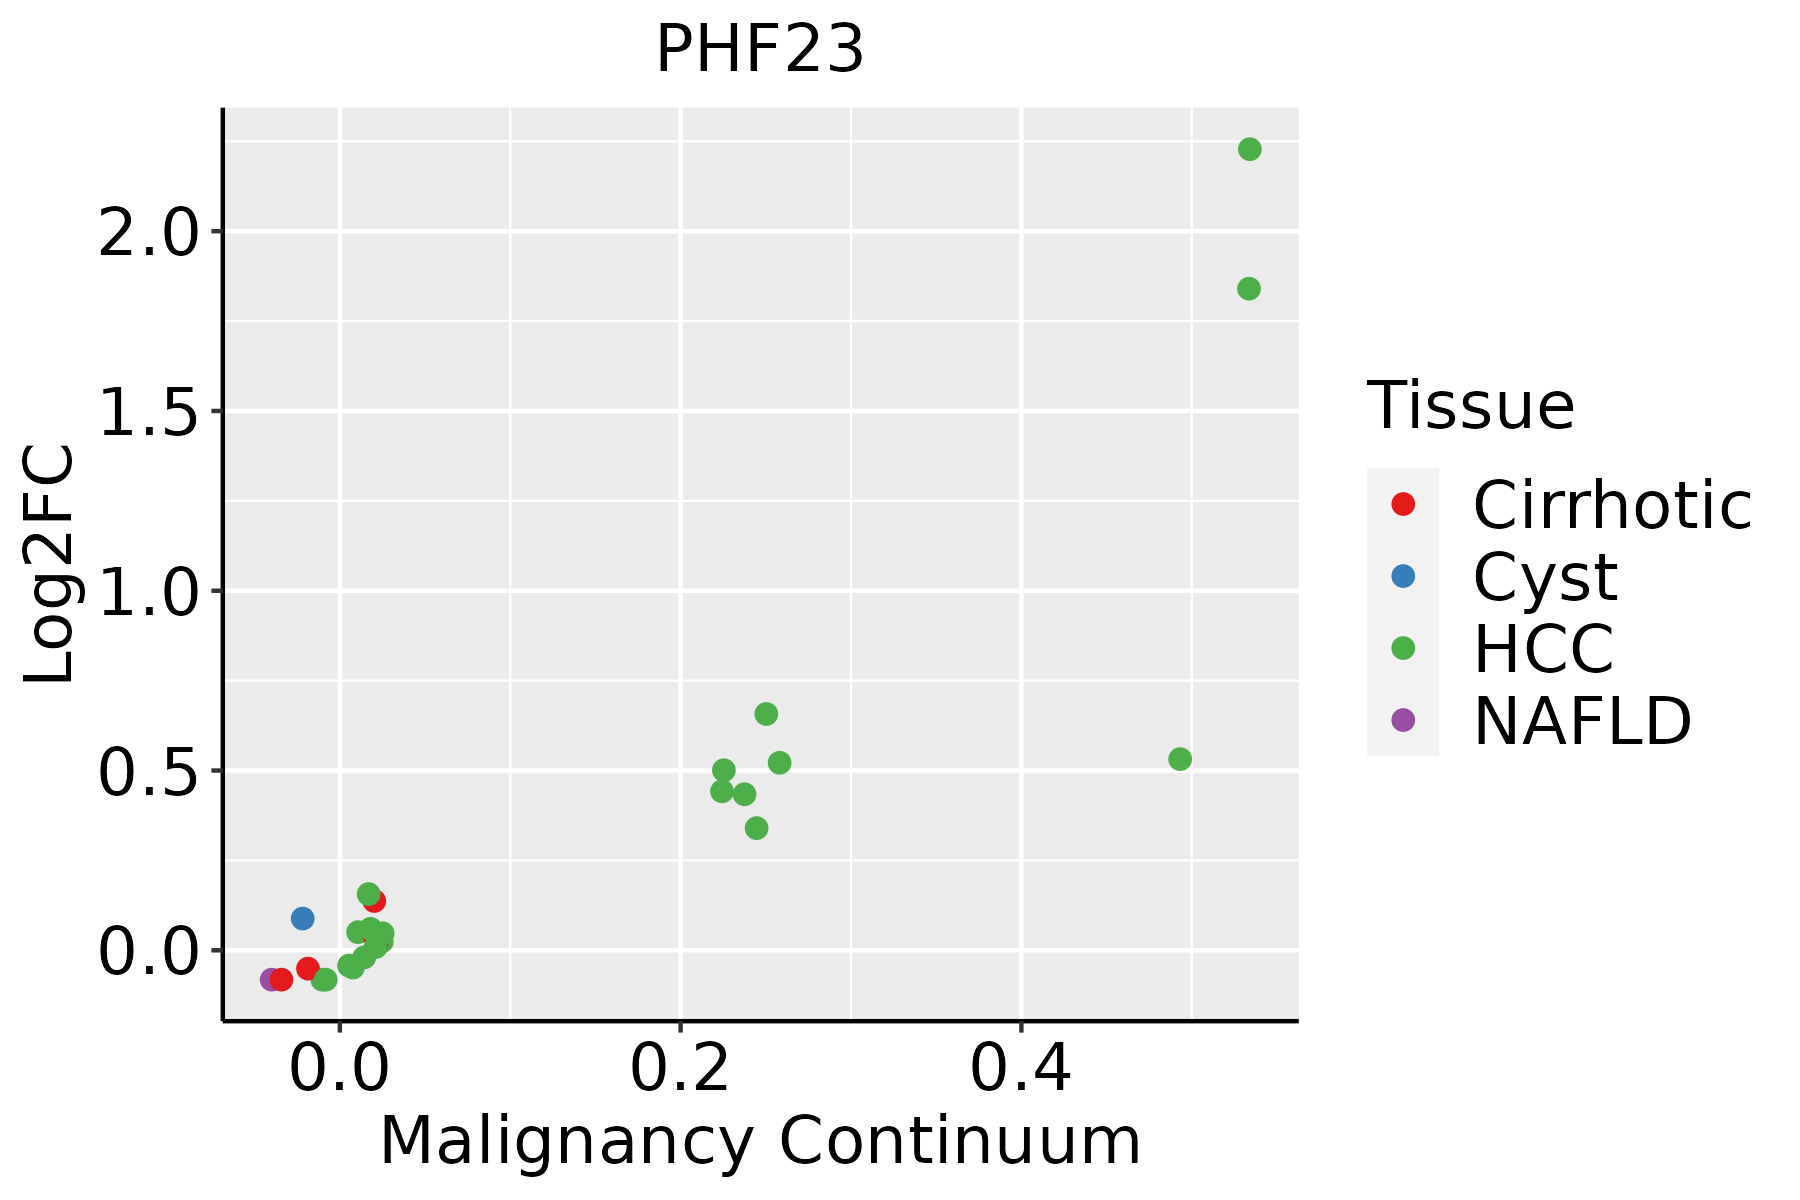
HCC: Hepatocellular carcinoma
NAFLD: Non-alcoholic fatty liver disease
Oral CavityThe image shows the transcriptomic changes along malignancy continuum.log2FC in expression of this searched gene in stem-like cells from each diseased tissue sample relative to stem-like cells in normal samples in each tissue plotted against the malignancy continuum. Samples are colored based on if they are from different disease stage.
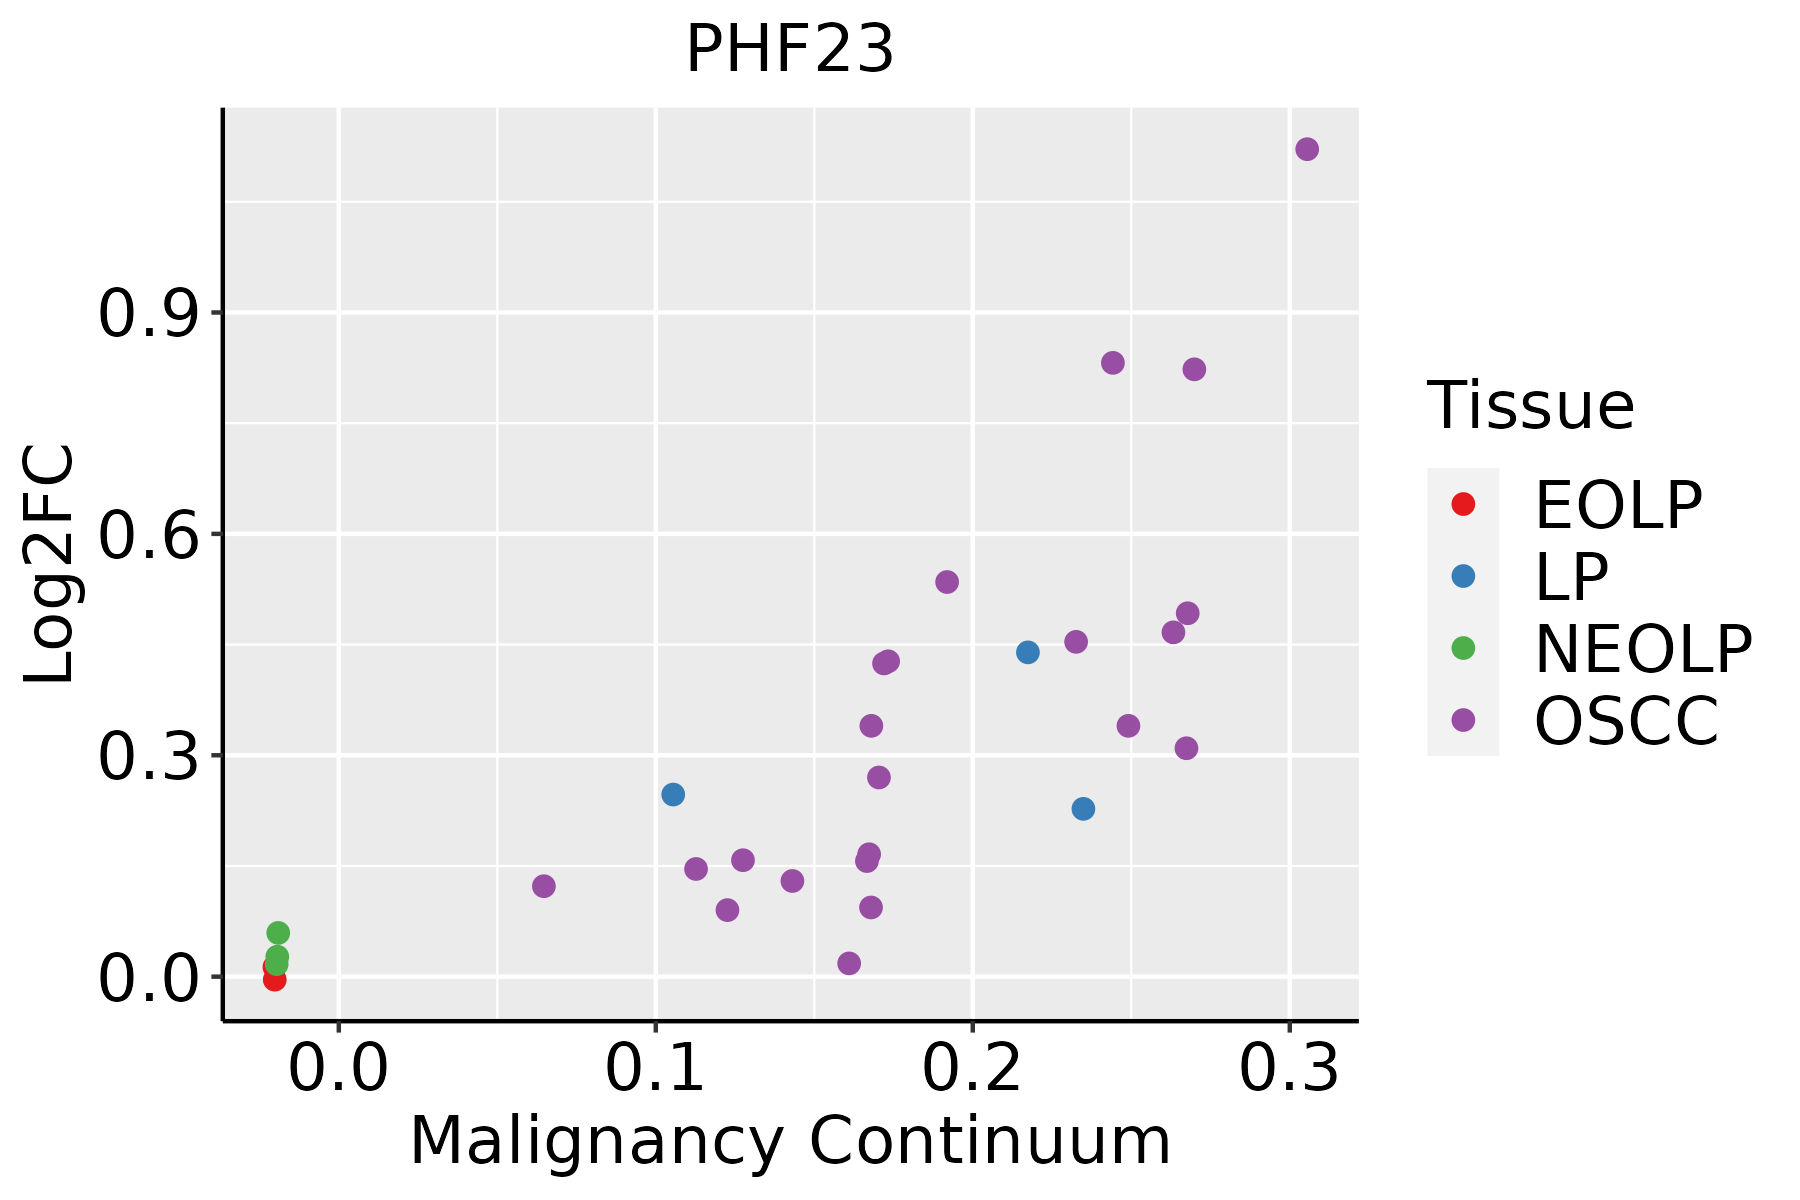
EOLP: Erosive Oral lichen planus
LP: leukoplakia
NEOLP: Non-erosive oral lichen planus
OSCC: Oral squamous cell carcinoma
SkinThe image shows the transcriptomic changes along malignancy continuum.log2FC in expression of this searched gene in stem-like cells from each diseased tissue sample relative to stem-like cells in normal samples in each tissue plotted against the malignancy continuum. Samples are colored based on if they are from different disease stage.
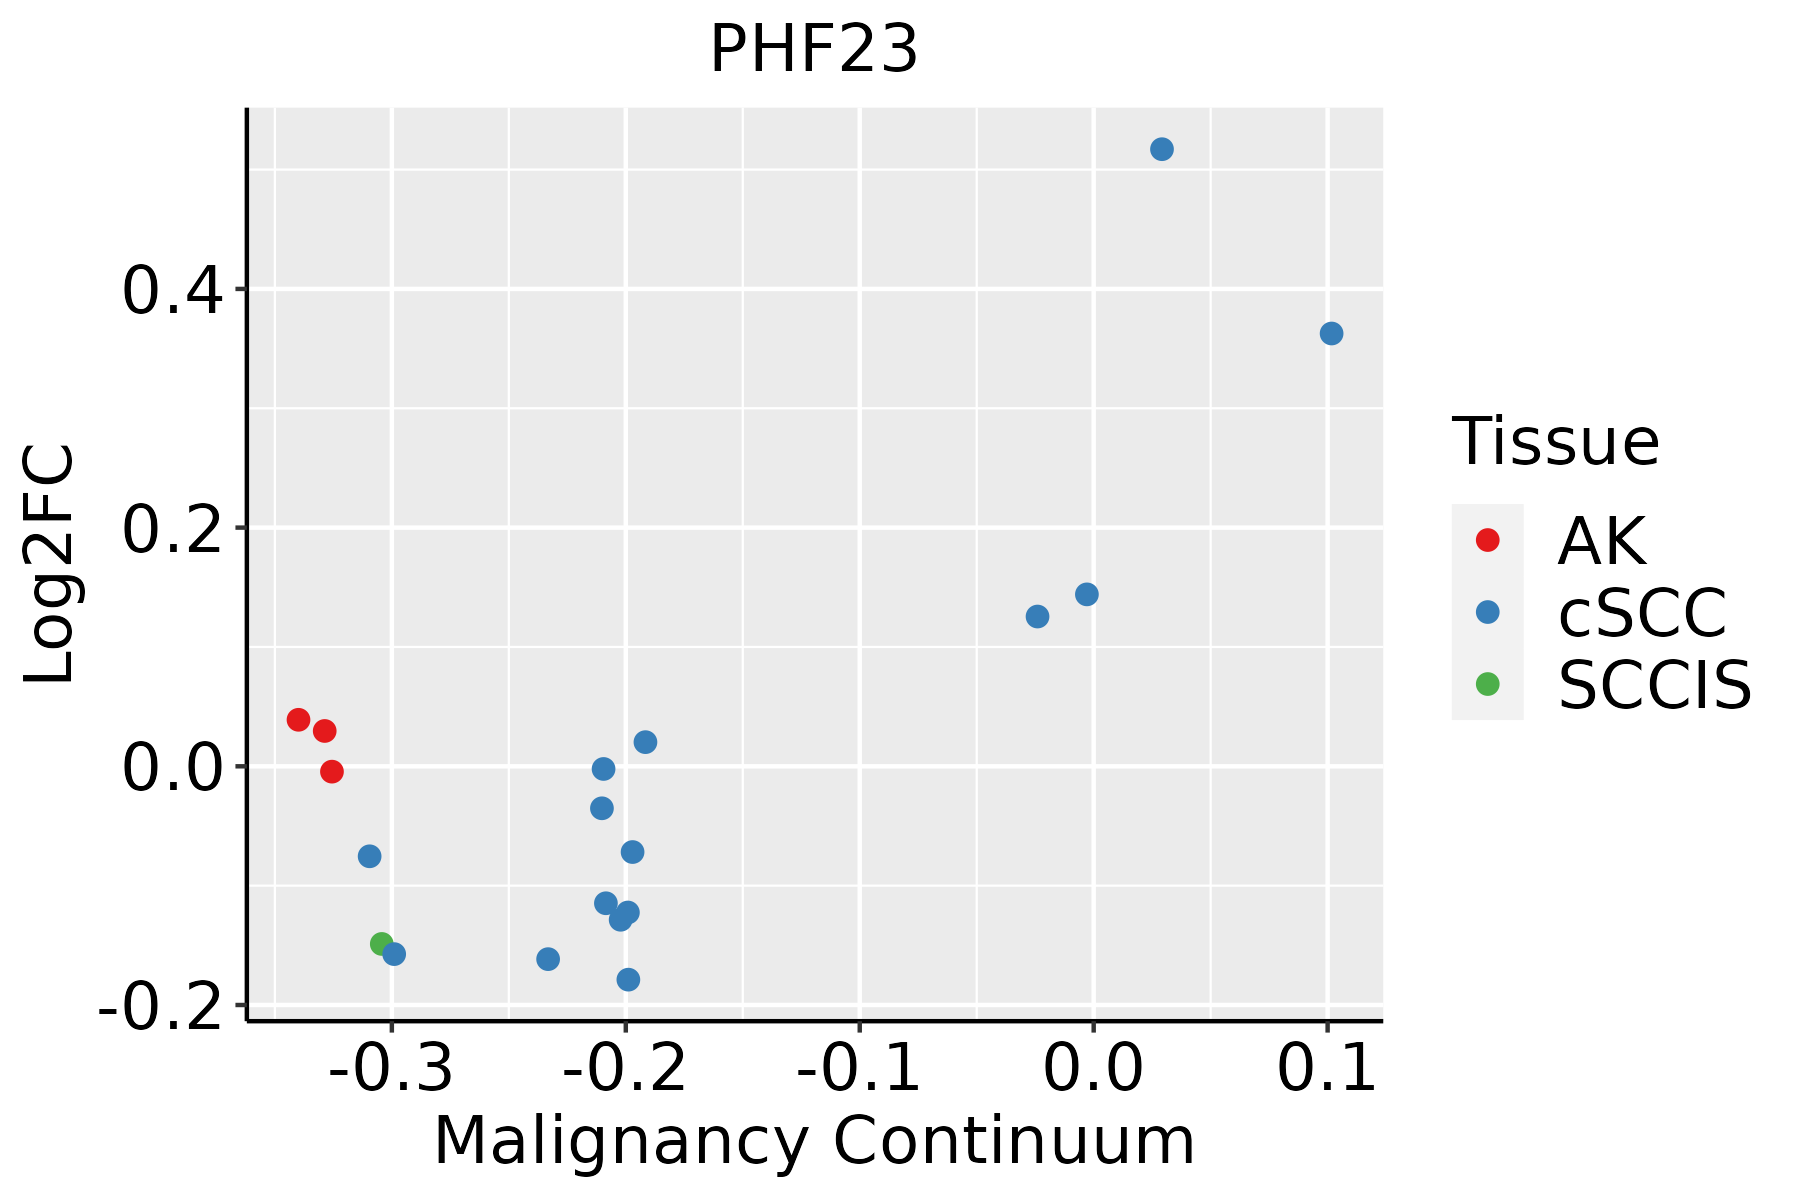
AK: Actinic keratosis
cSCC: Cutaneous squamous cell carcinoma
SCCIS:squamous cell carcinoma in situ
∗log2FC in expression of this searched gene in stem-like cells from each diseased tissue sample relative to stem-like cells in normal samples in each tissue plotted against the malignancy continuum. Samples are colored based on if they are from different disease stage.

Top

Malignant transformation related pathway analysis

check buttonFind out the enriched GO biological processes and KEGG pathways involved in transition from healthy to precancer to cancer
check button Figure of enriched GO biological processes.
TissueDisease StageEnriched GO biological Processes
ColorectumADGO analysis - Figure of enriched GO biological processes: Top 15 enriched GO BP terms are showed in the bar plot of each disease state in each tissue. Each row represents a significant GO biological process which is colored according to the -log10(p.adjust).
ColorectumSERGO analysis - Figure of enriched GO biological processes: Top 15 enriched GO BP terms are showed in the bar plot of each disease state in each tissue. Each row represents a significant GO biological process which is colored according to the -log10(p.adjust).
ColorectumMSSGO analysis - Figure of enriched GO biological processes: Top 15 enriched GO BP terms are showed in the bar plot of each disease state in each tissue. Each row represents a significant GO biological process which is colored according to the -log10(p.adjust).
ColorectumMSI-HGO analysis - Figure of enriched GO biological processes: Top 15 enriched GO BP terms are showed in the bar plot of each disease state in each tissue. Each row represents a significant GO biological process which is colored according to the -log10(p.adjust).
ColorectumFAPGO analysis - Figure of enriched GO biological processes: Top 15 enriched GO BP terms are showed in the bar plot of each disease state in each tissue. Each row represents a significant GO biological process which is colored according to the -log10(p.adjust).
∗Top 15 enriched GO BP terms are showed in the bar plot of each disease state in each tissue. Each row represents a significant GO biological process which is colored according to the -log10(p.adjust).
Page: 1 2 3 4 5 6 7 8 9 

check button Enriched GO biological processes.
GO IDTissueDisease StageDescriptionGene RatioBg Ratiopvaluep.adjustCount
GO:19050374Oral cavityOSCCautophagosome organization63/7305103/187234.30e-064.98e-0563
GO:00000454Oral cavityOSCCautophagosome assembly60/730599/187231.09e-051.14e-0460
GO:00440883Oral cavityOSCCregulation of vacuole organization31/730545/187234.70e-053.95e-0431
GO:00973522Oral cavityOSCCautophagosome maturation28/730540/187237.00e-055.60e-0428
GO:00105075Oral cavityOSCCnegative regulation of autophagy51/730585/187237.08e-055.62e-0451
GO:20007852Oral cavityOSCCregulation of autophagosome assembly26/730539/187234.33e-042.63e-0326
GO:00162421Oral cavityOSCCnegative regulation of macroautophagy23/730534/187236.77e-043.78e-0323
GO:00432445Oral cavityOSCCregulation of protein-containing complex disassembly65/7305121/187237.08e-043.90e-0365
GO:19021161Oral cavityOSCCnegative regulation of organelle assembly26/730541/187231.34e-036.62e-0326
GO:1902902Oral cavityOSCCnegative regulation of autophagosome assembly12/730515/187231.49e-037.13e-0312
GO:0022411112SkincSCCcellular component disassembly201/4864443/187234.09e-195.69e-17201
GO:190332029SkincSCCregulation of protein modification by small protein conjugation or removal125/4864242/187239.50e-181.05e-15125
GO:003139629SkincSCCregulation of protein ubiquitination107/4864210/187237.17e-155.35e-13107
GO:001623619SkincSCCmacroautophagy136/4864291/187231.36e-149.78e-13136
GO:003133028SkincSCCnegative regulation of cellular catabolic process115/4864262/187232.03e-108.72e-09115
GO:000989527SkincSCCnegative regulation of catabolic process133/4864320/187236.99e-102.77e-08133
GO:0010639111SkincSCCnegative regulation of organelle organization140/4864348/187233.35e-091.15e-07140
GO:003298418SkincSCCprotein-containing complex disassembly98/4864224/187235.31e-091.77e-0798
GO:001050619SkincSCCregulation of autophagy127/4864317/187232.36e-086.71e-07127
GO:190332217SkincSCCpositive regulation of protein modification by small protein conjugation or removal64/4864138/187231.79e-073.94e-0664
Page: 1 2 3 4 5 6 

check button Enriched KEGG pathways.
Pathway IDTissueDisease StageDescriptionGene RatioBg Ratiopvaluep.adjustqvalueCount
Page: 1 

Top

Cell-cell communication analysis

check buttonIdentification of potential cell-cell interactions between two cell types and their ligand-receptor pairs for different disease states
LigandReceptorLRpairPathwayTissueDisease Stage
Page: 1 

Top

Single-cell gene regulatory network inference analysis

check buttonFind out the significant the regulons (TFs) and the target genes of each regulon across cell types for different disease states
TFCell TypeTissueDisease StageTarget GeneRSSRegulon Activity
∗The dot plots of a searched regulon are shown for all cell subpopulations in each disease state of each tissue based on the regulon specific score inferred using pySCENIC and by calculating the average expression.
Page: 1 

Top

Somatic mutation of malignant transformation related genes

check buttonAnnotation of somatic variants for genes involved in malignant transformation
Hugo SymbolVariant ClassVariant ClassificationdbSNP RSHGVScHGVSpHGVSp ShortSWISSPROTBIOTYPESIFTPolyPhenTumor Sample BarcodeTissueHistologySexAgeStageTherapy TypesDrugsOutcome
PHF23SNVMissense_Mutationnovelc.536N>Ap.Arg179Glnp.R179QQ9BUL5protein_codingtolerated_low_confidence(0.17)possibly_damaging(0.457)TCGA-AN-A046-01Breastbreast invasive carcinomaFemale>=65I/IIUnknownUnknownSD
PHF23SNVMissense_Mutationc.157N>Cp.Glu53Glnp.E53QQ9BUL5protein_codingtolerated(0.05)benign(0.27)TCGA-D8-A1J8-01Breastbreast invasive carcinomaFemale>=65I/IIHormone TherapynolvadexSD
PHF23insertionFrame_Shift_Insnovelc.1087_1088insCTTCCTGGGTATCp.Ile363ThrfsTer11p.I363Tfs*11Q9BUL5protein_codingTCGA-B6-A0IN-01Breastbreast invasive carcinomaFemale<65I/IIUnknownUnknownPD
PHF23SNVMissense_Mutationrs201898433c.557N>Ap.Arg186Glnp.R186QQ9BUL5protein_codingtolerated_low_confidence(0.05)possibly_damaging(0.629)TCGA-2W-A8YY-01Cervixcervical & endocervical cancerFemale<65I/IIChemotherapycisplatinCR
PHF23SNVMissense_Mutationc.64N>Ap.Gln22Lysp.Q22KQ9BUL5protein_codingtolerated(1)benign(0.258)TCGA-EK-A2PL-01Cervixcervical & endocervical cancerFemale<65III/IVUnknownUnknownSD
PHF23SNVMissense_Mutationc.552N>Tp.Lys184Asnp.K184NQ9BUL5protein_codingdeleterious_low_confidence(0.02)probably_damaging(0.991)TCGA-AA-3977-01Colorectumcolon adenocarcinomaMale>=65I/IIUnknownUnknownSD
PHF23SNVMissense_Mutationnovelc.86N>Tp.Arg29Ilep.R29IQ9BUL5protein_codingdeleterious(0)possibly_damaging(0.694)TCGA-AA-A00N-01Colorectumcolon adenocarcinomaMale>=65I/IIUnknownUnknownPD
PHF23SNVMissense_Mutationnovelc.815N>Cp.Val272Alap.V272AQ9BUL5protein_codingtolerated_low_confidence(0.89)benign(0)TCGA-AZ-6598-01Colorectumcolon adenocarcinomaFemale>=65I/IIUnknownUnknownSD
PHF23SNVMissense_Mutationc.1072N>Ap.Leu358Metp.L358MQ9BUL5protein_codingtolerated(0.14)possibly_damaging(0.652)TCGA-G4-6586-01Colorectumcolon adenocarcinomaFemale>=65I/IIUnknownUnknownSD
PHF23SNVMissense_Mutationrs201898433c.557N>Ap.Arg186Glnp.R186QQ9BUL5protein_codingtolerated_low_confidence(0.05)possibly_damaging(0.629)TCGA-A5-A0G2-01Endometriumuterine corpus endometrioid carcinomaFemale<65III/IVUnknownUnknownSD
Page: 1 2 3 4 5 

Top

Related drugs of malignant transformation related genes

check buttonIdentification of chemicals and drugs interact with genes involved in malignant transfromation
(DGIdb 4.0)
Entrez IDSymbolCategoryInteraction TypesDrug Claim NameDrug NamePMIDs
Page: 1