Schematic overview of the cellular and molecular mechanisms involved in the cancer progression, including the proposed cellular and molecular mechanisms in cancer cells trajectory. AT1: alveolar type 1 cells; AT2: alveolar type 2 cells; AAH: atypical adenomatous hyperplasia; AIS: adenocarcinoma in situ; MIA: minimally invasive adenocarcinoma; IA: invasive adenocarcinoma; EMT: epithelial-mesenchymal transition

Home

Download

Statistics

Help

Contact

Center for Computational Systems Medicine
leaf

Gene summary

leaf

Malignant transformation analysis

leaf

Malignant transformation related pathway analysis

leaf

Cell-cell communication analysis

leaf

Single-cell gene regulatory network inference analysis

leaf

Somatic mutation of malignant transformation related genes

leaf

Related drugs of malignant transformation related genes

Gene: PCID2

Gene summary for PCID2

check button Gene summary.

Gene informationSpeciesHuman
Gene symbol

PCID2

Gene ID

55795

Gene namePCI domain containing 2
Gene AliasF10
Cytomap13q34
Gene Typeprotein-coding
GO ID

GO:0000070

UniProtAcc

Q5JVF3


Top

Malignant transformation analysis

check button Identification of the aberrant gene expression in precancerous and cancerous lesions by comparing the gene expression of stem-like cells in diseased tissues with normal stem cells
check button Malignant transformation involving gene list.
Entrez IDSymbolReplicatesSpeciesOrganTissueAdj P-valueLog2FCMalignancy
55795PCID2HTA11_99999965104_69814HumanColorectumMSS5.01e-138.03e-010.281
55795PCID2HTA11_99999971662_82457HumanColorectumMSS4.99e-137.49e-010.3859
55795PCID2A015-C-203HumanColorectumFAP1.02e-05-9.66e-02-0.1294
55795PCID2A001-C-119HumanColorectumFAP1.39e-04-2.97e-01-0.1557
55795PCID2A001-C-108HumanColorectumFAP2.07e-03-1.16e-01-0.0272
55795PCID2A002-C-205HumanColorectumFAP3.71e-07-2.45e-01-0.1236
55795PCID2A015-C-006HumanColorectumFAP8.41e-036.79e-02-0.0994
55795PCID2A002-C-114HumanColorectumFAP2.89e-05-2.26e-01-0.1561
55795PCID2A015-C-104HumanColorectumFAP1.69e-10-2.31e-01-0.1899
55795PCID2A002-C-116HumanColorectumFAP2.17e-07-1.94e-01-0.0452
55795PCID2A014-C-008HumanColorectumFAP3.37e-02-2.11e-01-0.191
55795PCID2A018-E-020HumanColorectumFAP5.16e-03-1.60e-01-0.2034
55795PCID2F034HumanColorectumFAP2.46e-02-8.74e-02-0.0665
55795PCID2LZE4THumanEsophagusESCC1.23e-082.62e-010.0811
55795PCID2LZE7THumanEsophagusESCC1.68e-054.40e-010.0667
55795PCID2LZE8THumanEsophagusESCC1.68e-072.08e-010.067
55795PCID2LZE24THumanEsophagusESCC3.68e-072.02e-010.0596
55795PCID2LZE6THumanEsophagusESCC6.15e-043.68e-010.0845
55795PCID2P1T-EHumanEsophagusESCC8.29e-052.39e-010.0875
55795PCID2P2T-EHumanEsophagusESCC6.70e-133.68e-010.1177
Page: 1 2 3 4 5 6 

check button Transcriptomic changes along malignancy continuum.
TissueExpression DynamicsAbbreviation
Colorectum (GSE201348)The image shows the transcriptomic changes along malignancy continuum.log2FC in expression of this searched gene in stem-like cells from each diseased tissue sample relative to stem-like cells in normal samples in each tissue plotted against the malignancy continuum. Samples are colored based on if they are from different disease stage.FAP: Familial adenomatous polyposis
CRC: Colorectal cancer
Colorectum (HTA11)The image shows the transcriptomic changes along malignancy continuum.log2FC in expression of this searched gene in stem-like cells from each diseased tissue sample relative to stem-like cells in normal samples in each tissue plotted against the malignancy continuum. Samples are colored based on if they are from different disease stage.AD: Adenomas
SER: Sessile serrated lesions
MSI-H: Microsatellite-high colorectal cancer
MSS: Microsatellite stable colorectal cancer
EsophagusThe image shows the transcriptomic changes along malignancy continuum.log2FC in expression of this searched gene in stem-like cells from each diseased tissue sample relative to stem-like cells in normal samples in each tissue plotted against the malignancy continuum. Samples are colored based on if they are from different disease stage.ESCC: Esophageal squamous cell carcinoma
HGIN: High-grade intraepithelial neoplasias
LGIN: Low-grade intraepithelial neoplasias
LiverThe image shows the transcriptomic changes along malignancy continuum.log2FC in expression of this searched gene in stem-like cells from each diseased tissue sample relative to stem-like cells in normal samples in each tissue plotted against the malignancy continuum. Samples are colored based on if they are from different disease stage.
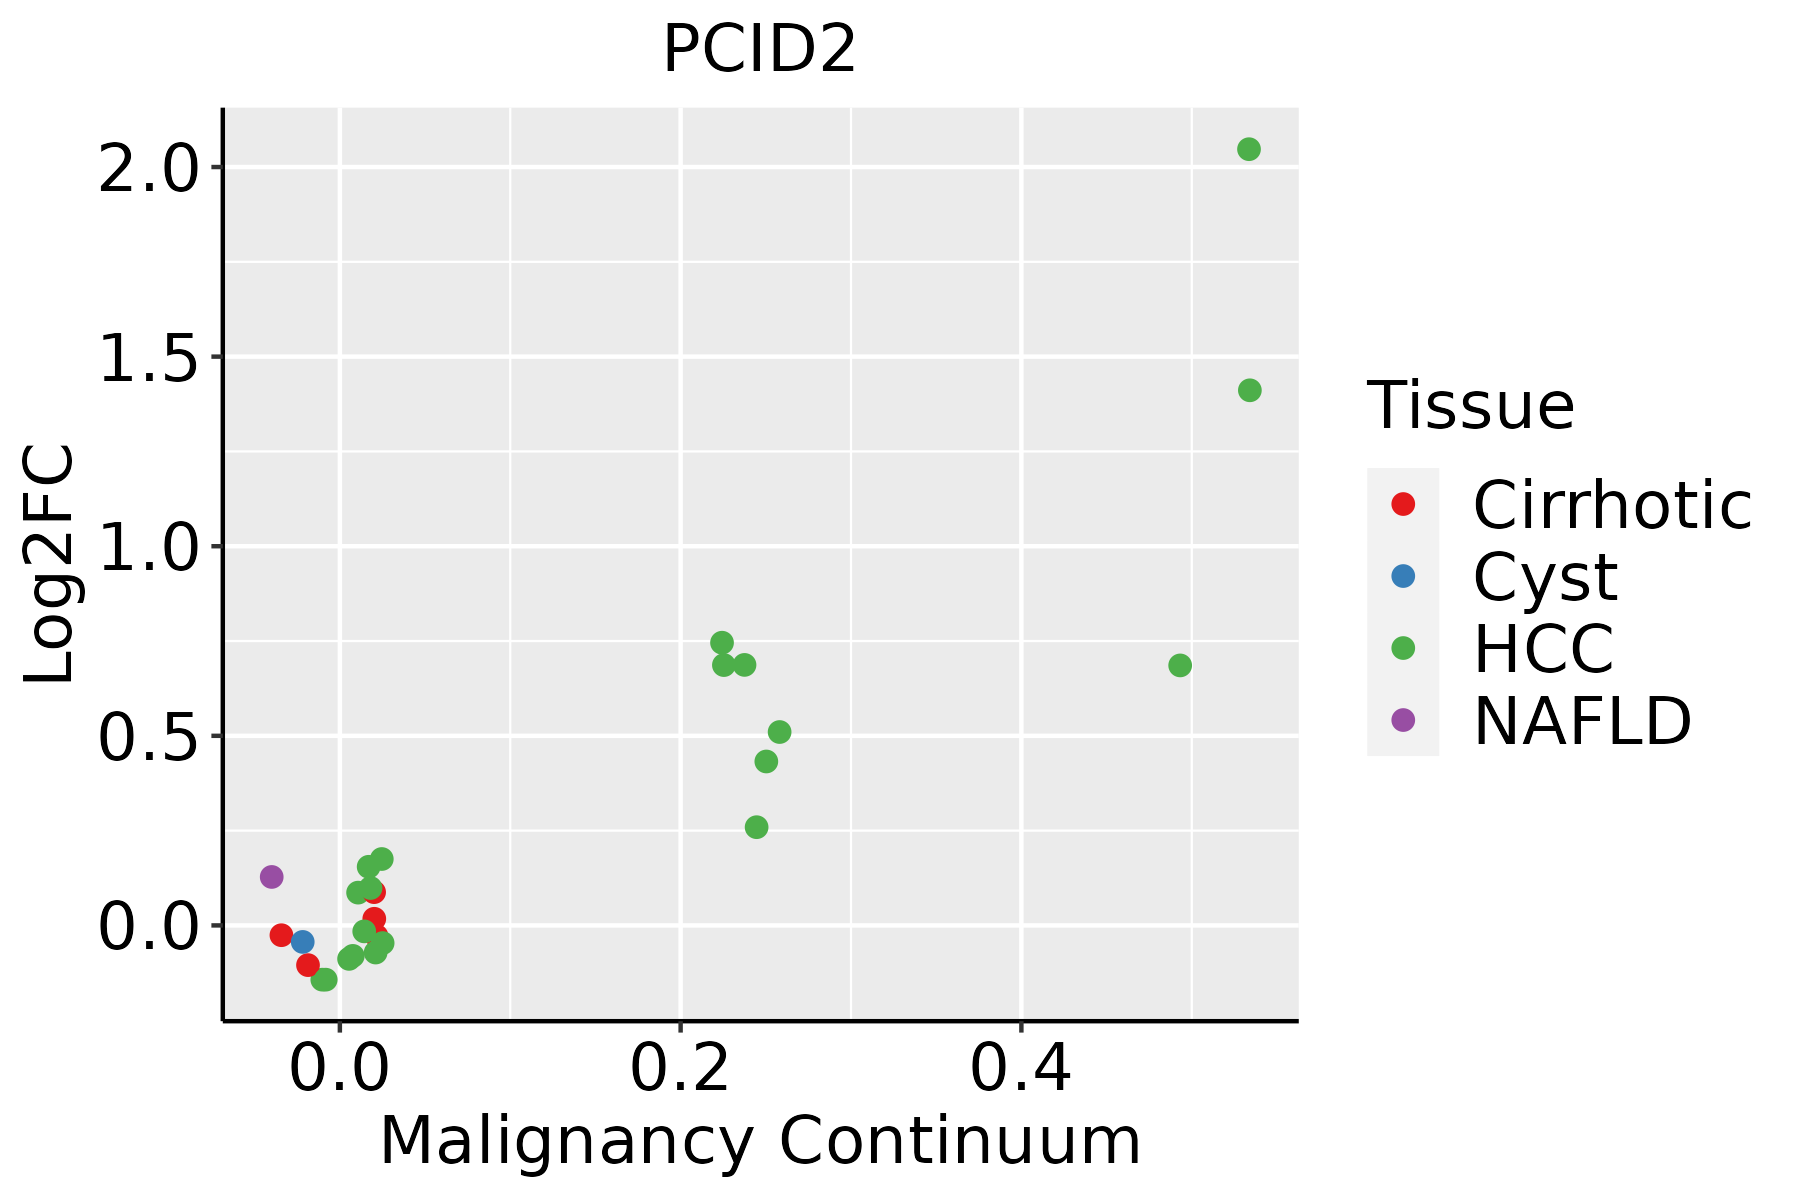
HCC: Hepatocellular carcinoma
NAFLD: Non-alcoholic fatty liver disease
Oral CavityThe image shows the transcriptomic changes along malignancy continuum.log2FC in expression of this searched gene in stem-like cells from each diseased tissue sample relative to stem-like cells in normal samples in each tissue plotted against the malignancy continuum. Samples are colored based on if they are from different disease stage.
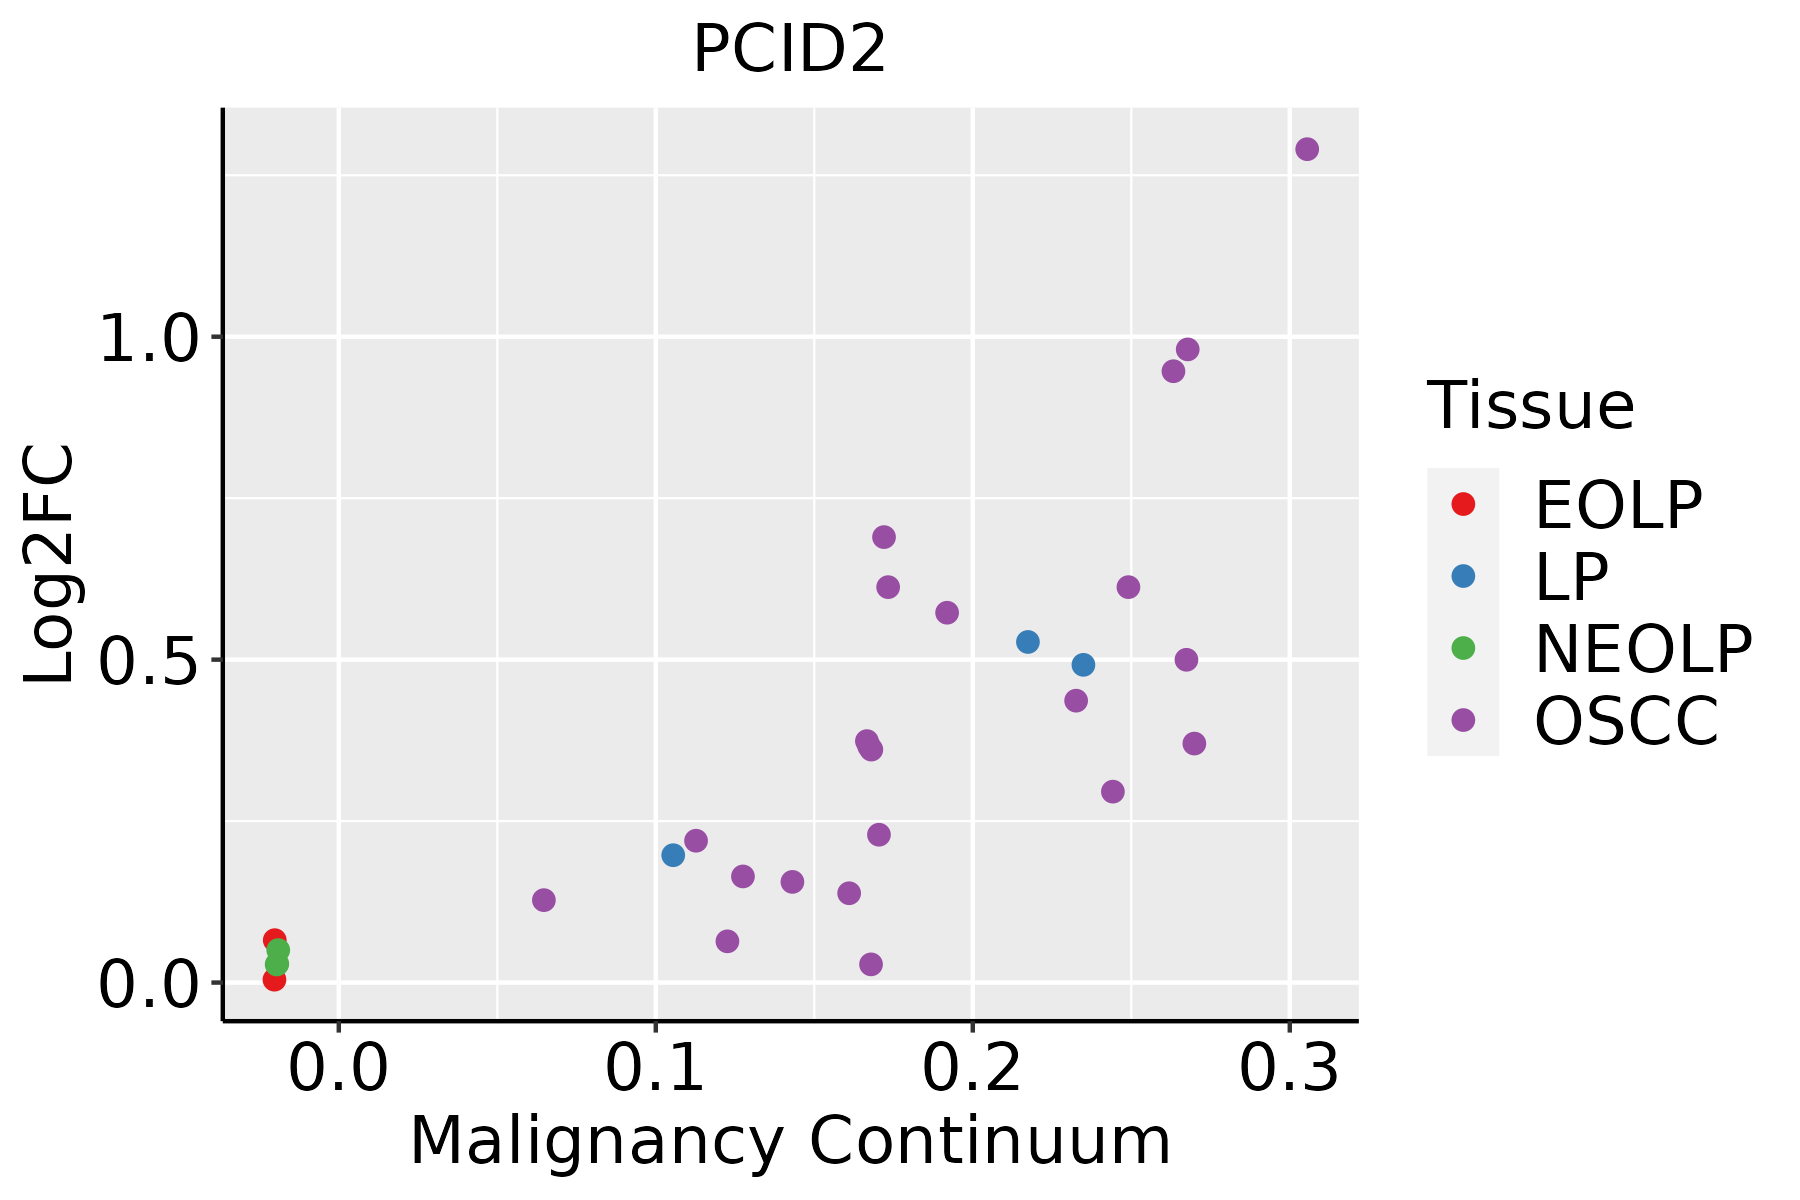
EOLP: Erosive Oral lichen planus
LP: leukoplakia
NEOLP: Non-erosive oral lichen planus
OSCC: Oral squamous cell carcinoma
ThyroidThe image shows the transcriptomic changes along malignancy continuum.log2FC in expression of this searched gene in stem-like cells from each diseased tissue sample relative to stem-like cells in normal samples in each tissue plotted against the malignancy continuum. Samples are colored based on if they are from different disease stage.
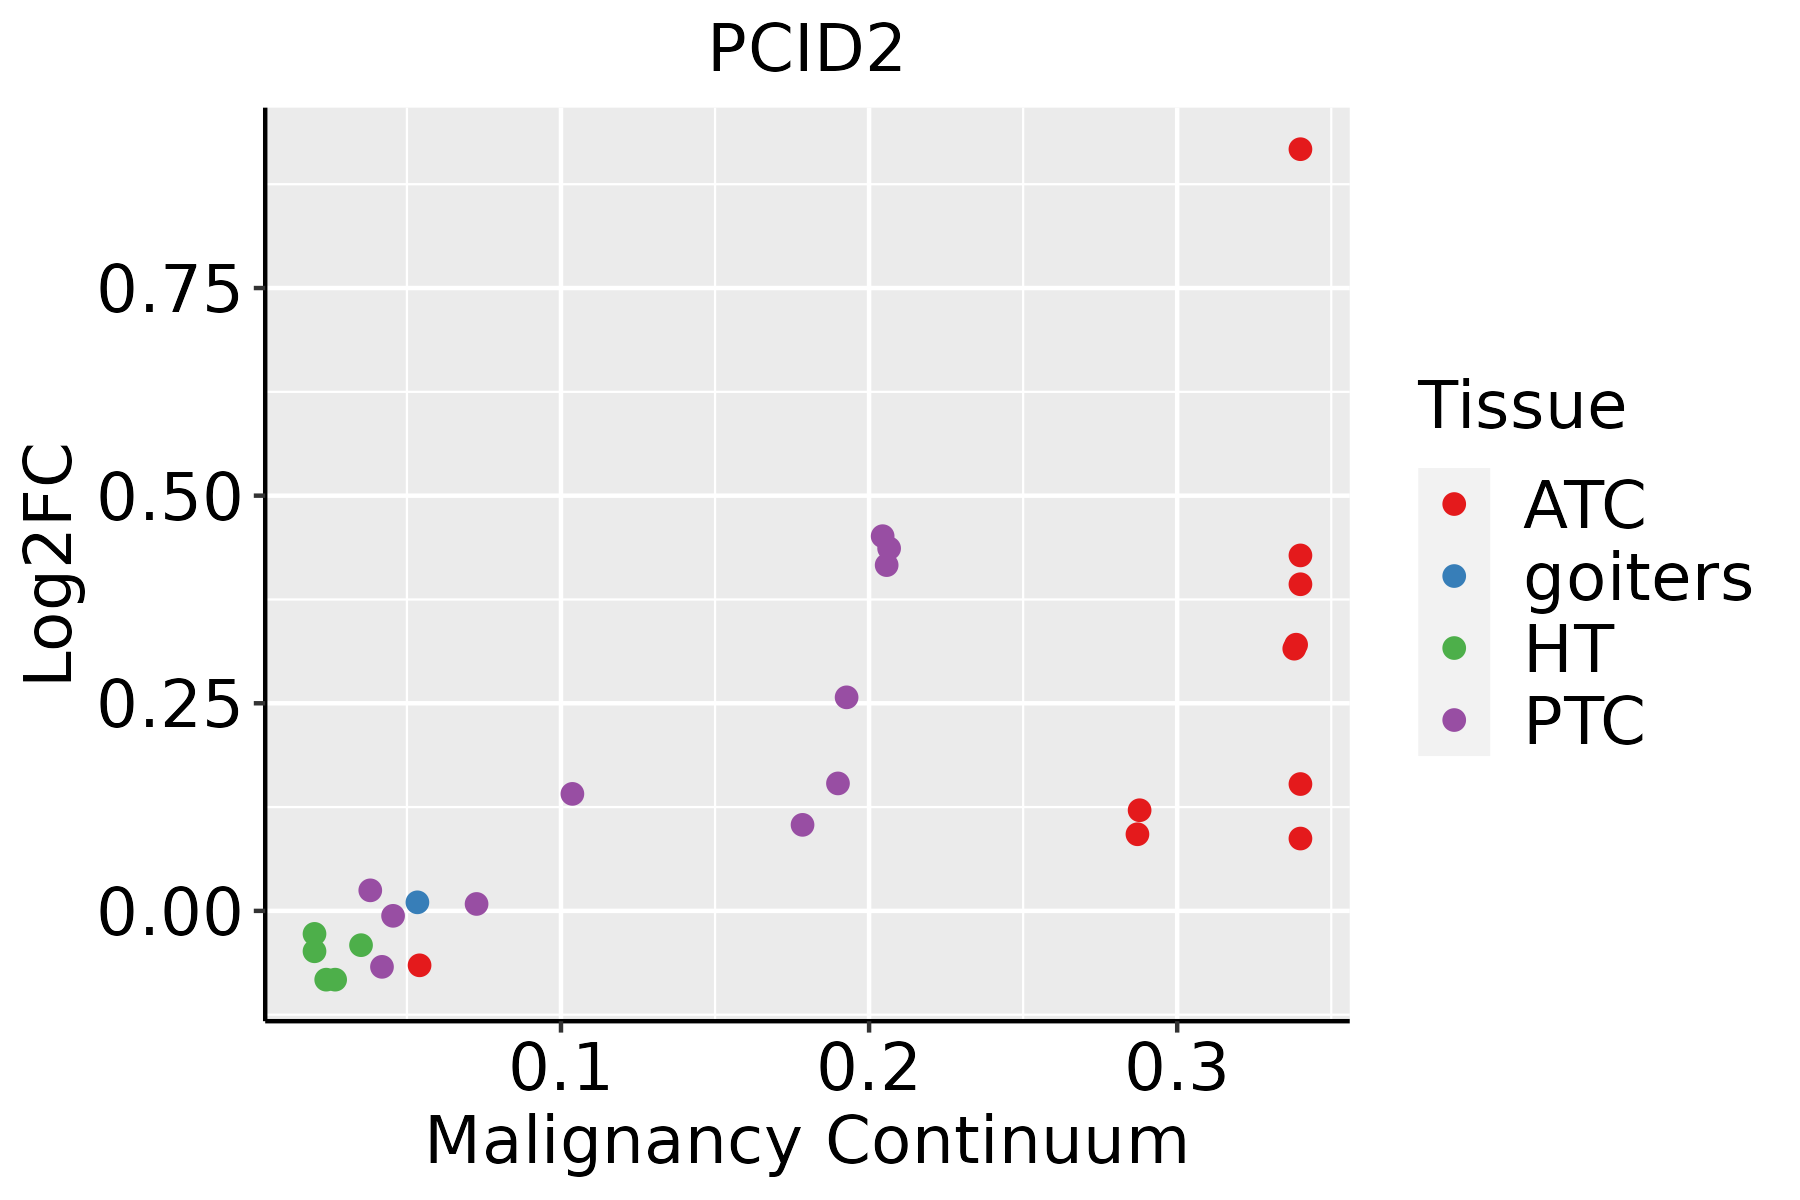
ATC: Anaplastic thyroid cancer
HT: Hashimoto's thyroiditis
PTC: Papillary thyroid cancer
∗log2FC in expression of this searched gene in stem-like cells from each diseased tissue sample relative to stem-like cells in normal samples in each tissue plotted against the malignancy continuum. Samples are colored based on if they are from different disease stage.

Top

Malignant transformation related pathway analysis

check buttonFind out the enriched GO biological processes and KEGG pathways involved in transition from healthy to precancer to cancer
check button Figure of enriched GO biological processes.
TissueDisease StageEnriched GO biological Processes
ColorectumADGO analysis - Figure of enriched GO biological processes: Top 15 enriched GO BP terms are showed in the bar plot of each disease state in each tissue. Each row represents a significant GO biological process which is colored according to the -log10(p.adjust).
ColorectumSERGO analysis - Figure of enriched GO biological processes: Top 15 enriched GO BP terms are showed in the bar plot of each disease state in each tissue. Each row represents a significant GO biological process which is colored according to the -log10(p.adjust).
ColorectumMSSGO analysis - Figure of enriched GO biological processes: Top 15 enriched GO BP terms are showed in the bar plot of each disease state in each tissue. Each row represents a significant GO biological process which is colored according to the -log10(p.adjust).
ColorectumMSI-HGO analysis - Figure of enriched GO biological processes: Top 15 enriched GO BP terms are showed in the bar plot of each disease state in each tissue. Each row represents a significant GO biological process which is colored according to the -log10(p.adjust).
ColorectumFAPGO analysis - Figure of enriched GO biological processes: Top 15 enriched GO BP terms are showed in the bar plot of each disease state in each tissue. Each row represents a significant GO biological process which is colored according to the -log10(p.adjust).
∗Top 15 enriched GO BP terms are showed in the bar plot of each disease state in each tissue. Each row represents a significant GO biological process which is colored according to the -log10(p.adjust).
Page: 1 2 3 4 5 6 7 8 9 

check button Enriched GO biological processes.
GO IDTissueDisease StageDescriptionGene RatioBg Ratiopvaluep.adjustCount
GO:00008194EsophagusESCCsister chromatid segregation157/8552202/187238.41e-211.33e-18157
GO:005123617EsophagusESCCestablishment of RNA localization134/8552166/187231.23e-201.81e-18134
GO:0051168110EsophagusESCCnuclear export126/8552154/187231.88e-202.65e-18126
GO:005102815EsophagusESCCmRNA transport110/8552130/187232.76e-203.80e-18110
GO:005065717EsophagusESCCnucleic acid transport131/8552163/187236.94e-208.46e-18131
GO:005065817EsophagusESCCRNA transport131/8552163/187236.94e-208.46e-18131
GO:003304416EsophagusESCCregulation of chromosome organization145/8552187/187233.80e-194.31e-17145
GO:000705911EsophagusESCCchromosome segregation238/8552346/187231.72e-181.82e-16238
GO:0034655110EsophagusESCCnucleobase-containing compound catabolic process272/8552407/187232.92e-182.90e-16272
GO:004477216EsophagusESCCmitotic cell cycle phase transition281/8552424/187234.63e-184.45e-16281
GO:0006402110EsophagusESCCmRNA catabolic process170/8552232/187238.70e-188.00e-16170
GO:001593117EsophagusESCCnucleobase-containing compound transport162/8552222/187239.87e-177.93e-15162
GO:000734615EsophagusESCCregulation of mitotic cell cycle293/8552457/187238.00e-165.64e-14293
GO:004670018EsophagusESCCheterocycle catabolic process286/8552445/187231.12e-157.47e-14286
GO:004427019EsophagusESCCcellular nitrogen compound catabolic process288/8552451/187233.03e-151.79e-13288
GO:001943918EsophagusESCCaromatic compound catabolic process295/8552467/187231.09e-145.98e-13295
GO:000635414EsophagusESCCDNA-templated transcription, elongation76/855291/187238.35e-144.11e-1276
GO:190136118EsophagusESCCorganic cyclic compound catabolic process307/8552495/187239.99e-144.80e-12307
GO:007116612EsophagusESCCribonucleoprotein complex localization66/855277/187232.94e-131.38e-1166
GO:00482853EsophagusESCCorganelle fission301/8552488/187234.64e-132.12e-11301
Page: 1 2 3 4 5 6 7 8 9 10 11 12 13 14 15 16 17 18 19 20 21 22 23 24 25 26 27 

check button Enriched KEGG pathways.
Pathway IDTissueDisease StageDescriptionGene RatioBg Ratiopvaluep.adjustqvalueCount
Page: 1 

Top

Cell-cell communication analysis

check buttonIdentification of potential cell-cell interactions between two cell types and their ligand-receptor pairs for different disease states
LigandReceptorLRpairPathwayTissueDisease Stage
Page: 1 

Top

Single-cell gene regulatory network inference analysis

check buttonFind out the significant the regulons (TFs) and the target genes of each regulon across cell types for different disease states
TFCell TypeTissueDisease StageTarget GeneRSSRegulon Activity
∗The dot plots of a searched regulon are shown for all cell subpopulations in each disease state of each tissue based on the regulon specific score inferred using pySCENIC and by calculating the average expression.
Page: 1 

Top

Somatic mutation of malignant transformation related genes

check buttonAnnotation of somatic variants for genes involved in malignant transformation
Hugo SymbolVariant ClassVariant ClassificationdbSNP RSHGVScHGVSpHGVSp ShortSWISSPROTBIOTYPESIFTPolyPhenTumor Sample BarcodeTissueHistologySexAgeStageTherapy TypesDrugsOutcome
PCID2SNVMissense_Mutationc.509N>Cp.Arg170Prop.R170PQ5JVF3protein_codingdeleterious(0)probably_damaging(0.998)TCGA-A8-A08L-01Breastbreast invasive carcinomaFemale>=65III/IVUnknownUnknownSD
PCID2SNVMissense_Mutationrs750326771c.301A>Gp.Arg101Glyp.R101GQ5JVF3protein_codingtolerated(0.09)benign(0)TCGA-A8-A09W-01Breastbreast invasive carcinomaFemale>=65III/IVUnknownUnknownSD
PCID2SNVMissense_Mutationc.419N>Tp.Ser140Leup.S140LQ5JVF3protein_codingtolerated(0.44)benign(0)TCGA-C8-A12P-01Breastbreast invasive carcinomaFemale<65I/IIUnknownUnknownSD
PCID2SNVMissense_Mutationc.331G>Cp.Glu111Glnp.E111QQ5JVF3protein_codingtolerated(0.42)benign(0)TCGA-D8-A1JA-01Breastbreast invasive carcinomaFemale<65III/IVChemotherapyadriamycinPD
PCID2insertionNonsense_Mutationnovelc.1295_1296insTCCCAAGTAGCTGGGAGCACAGGTGCATGCCACCACACCCAp.His433ProfsTer3p.H433Pfs*3Q5JVF3protein_codingTCGA-AN-A04C-01Breastbreast invasive carcinomaFemale<65I/IIUnknownUnknownSD
PCID2insertionIn_Frame_Insnovelc.1027_1028insTACCACATTTCATCAp.Gly343delinsValProHisPheIleSerp.G343delinsVPHFISQ5JVF3protein_codingTCGA-AN-A0FK-01Breastbreast invasive carcinomaFemale>=65III/IVUnknownUnknownSD
PCID2SNVMissense_Mutationnovelc.814C>Tp.Arg272Cysp.R272CQ5JVF3protein_codingdeleterious(0.05)possibly_damaging(0.854)TCGA-2W-A8YY-01Cervixcervical & endocervical cancerFemale<65I/IIChemotherapycisplatinCR
PCID2SNVMissense_Mutationrs768260894c.497C>Tp.Ala166Valp.A166VQ5JVF3protein_codingtolerated(0.27)benign(0.038)TCGA-2W-A8YY-01Cervixcervical & endocervical cancerFemale<65I/IIChemotherapycisplatinCR
PCID2SNVMissense_Mutationc.912N>Ap.Met304Ilep.M304IQ5JVF3protein_codingdeleterious(0.04)benign(0.015)TCGA-Q1-A73O-01Cervixcervical & endocervical cancerFemale<65I/IIChemotherapycisplatinCR
PCID2SNVMissense_Mutationc.811N>Ap.Gly271Argp.G271RQ5JVF3protein_codingdeleterious(0)probably_damaging(1)TCGA-4T-AA8H-01Colorectumcolon adenocarcinomaFemale<65I/IIUnknownUnknownSD
Page: 1 2 3 4 5 

Top

Related drugs of malignant transformation related genes

check buttonIdentification of chemicals and drugs interact with genes involved in malignant transfromation
(DGIdb 4.0)
Entrez IDSymbolCategoryInteraction TypesDrug Claim NameDrug NamePMIDs
Page: 1