| Tissue | Expression Dynamics | Abbreviation |
| Cervix | 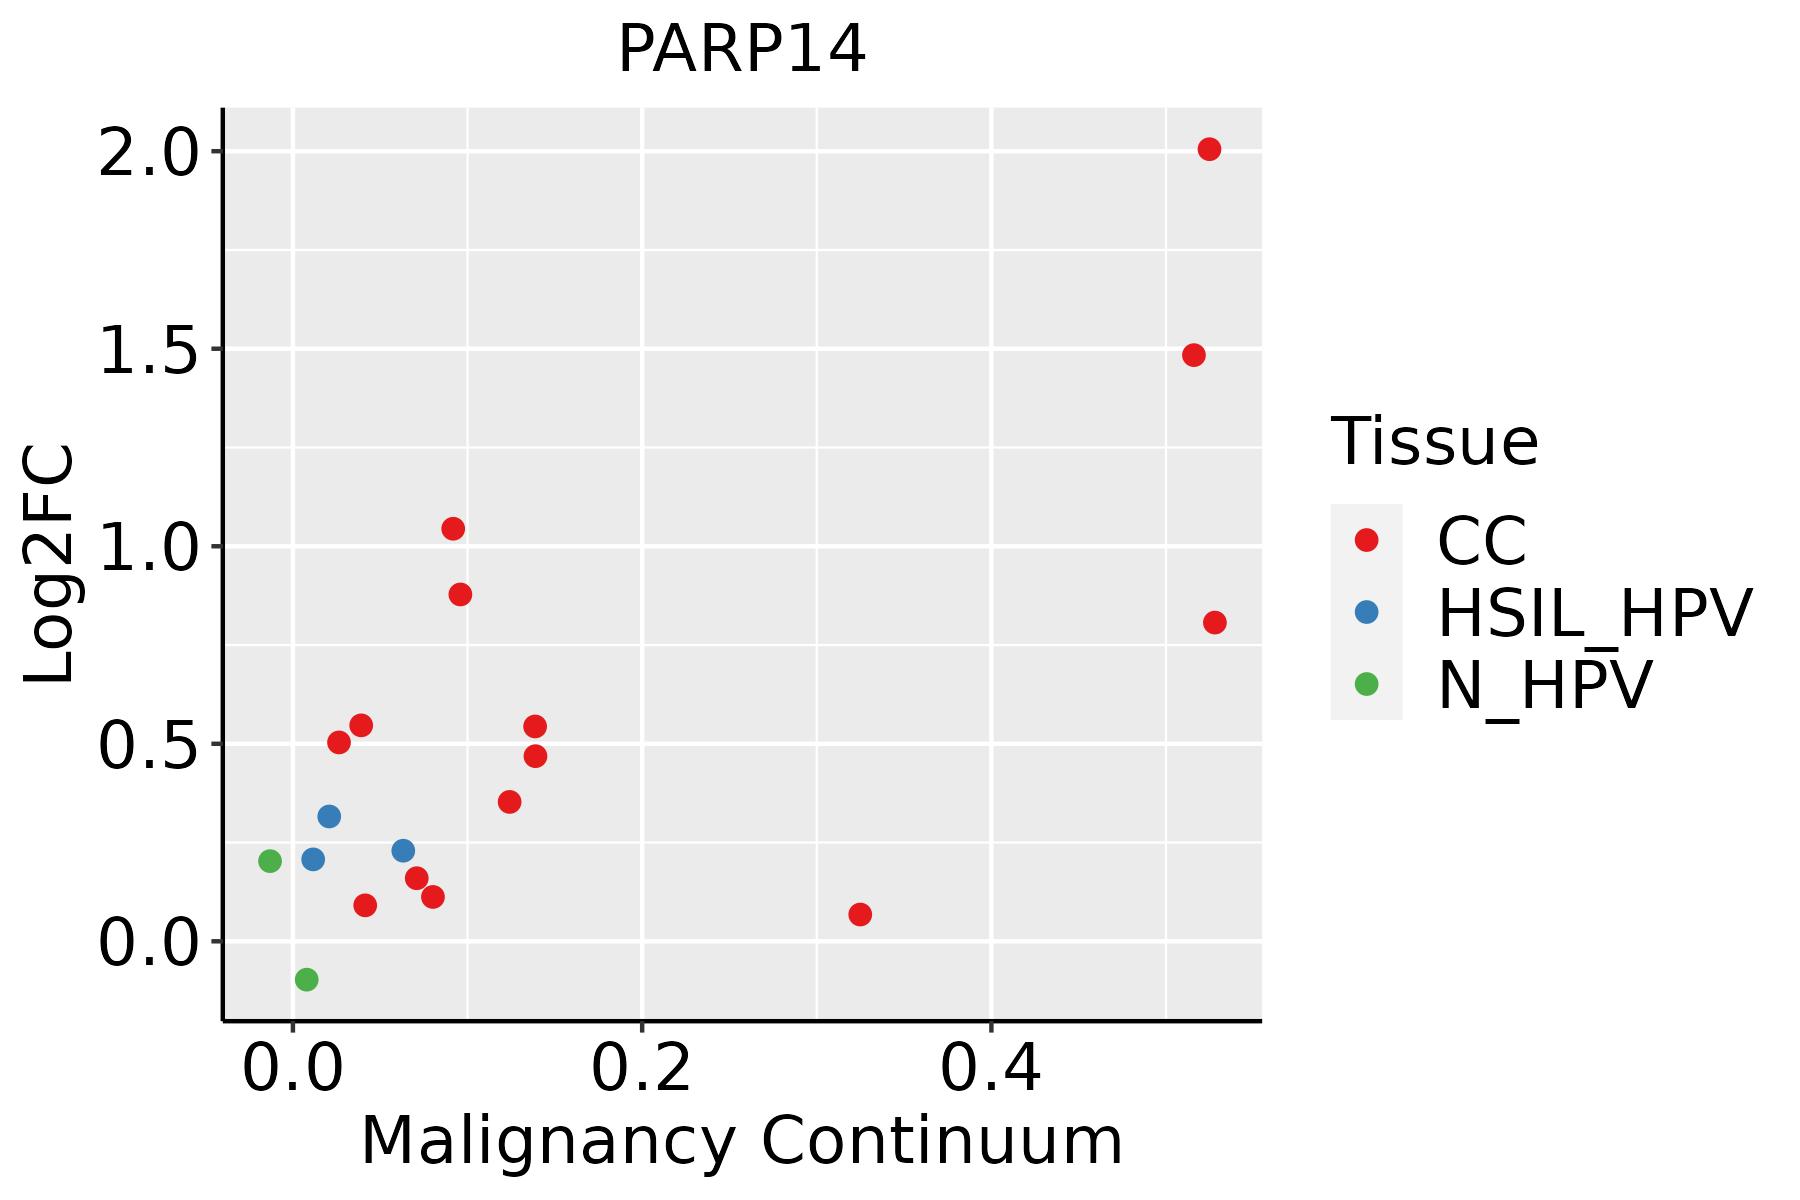 | CC: Cervix cancer |
| HSIL_HPV: HPV-infected high-grade squamous intraepithelial lesions |
| N_HPV: HPV-infected normal cervix |
| Colorectum (GSE201348) |  | FAP: Familial adenomatous polyposis |
| CRC: Colorectal cancer |
| Colorectum (HTA11) |  | AD: Adenomas |
| SER: Sessile serrated lesions |
| MSI-H: Microsatellite-high colorectal cancer |
| MSS: Microsatellite stable colorectal cancer |
| Esophagus | 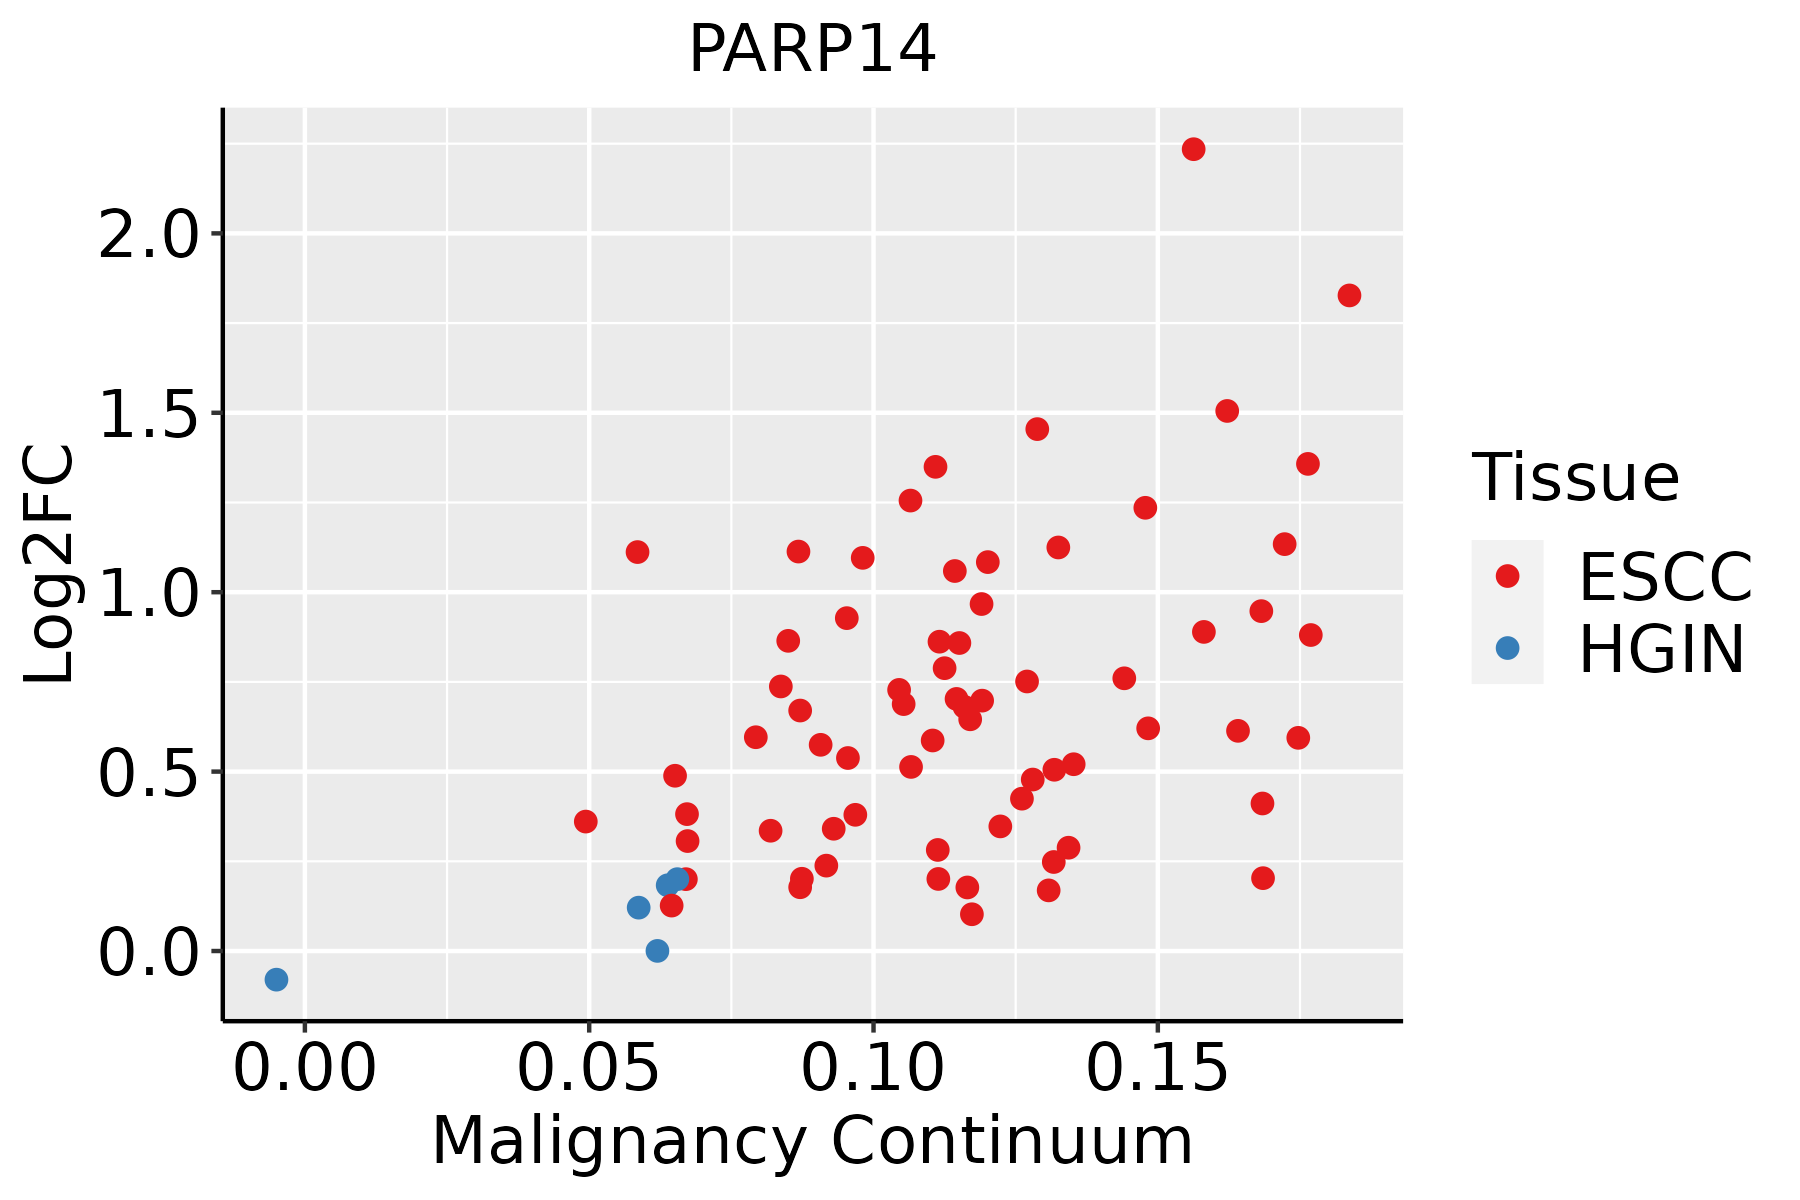 | ESCC: Esophageal squamous cell carcinoma |
| HGIN: High-grade intraepithelial neoplasias |
| LGIN: Low-grade intraepithelial neoplasias |
| Liver | 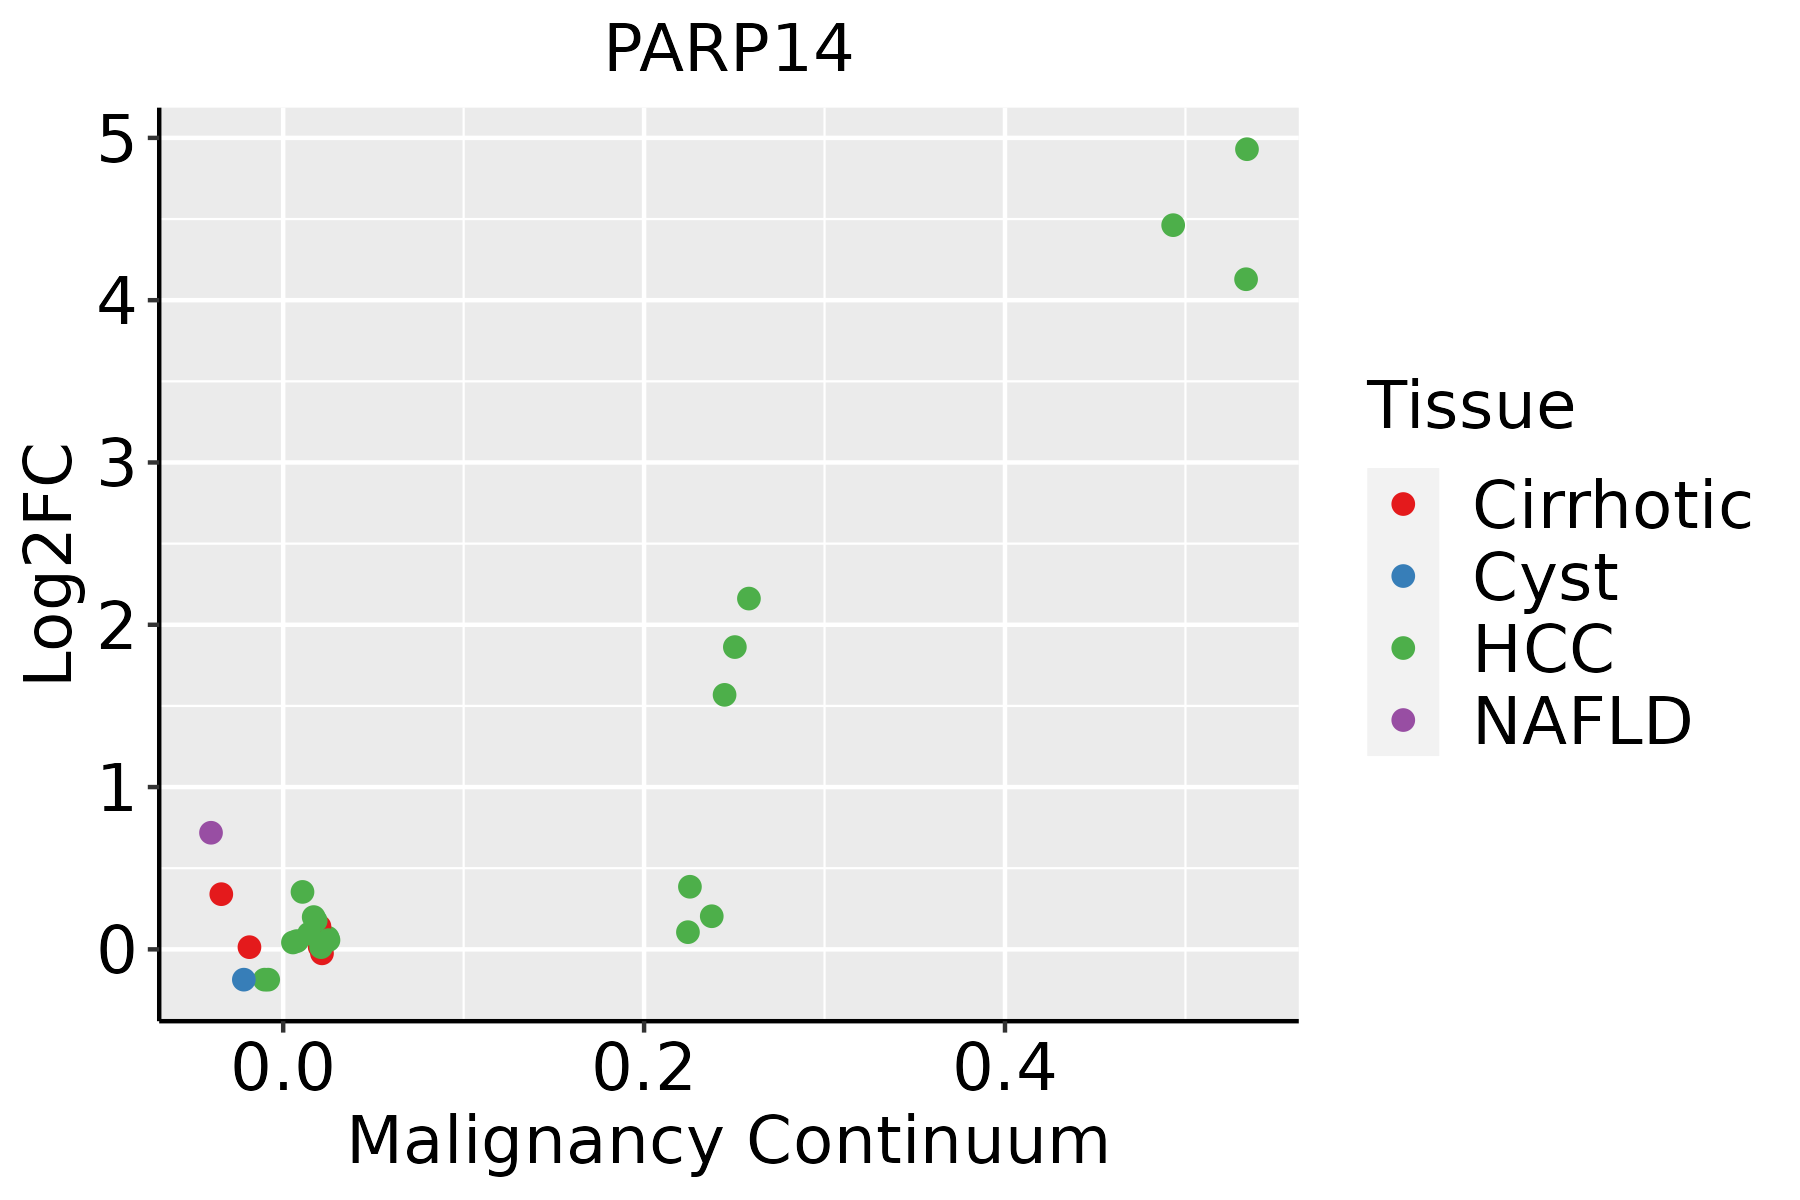 | HCC: Hepatocellular carcinoma |
| NAFLD: Non-alcoholic fatty liver disease |
| Lung | 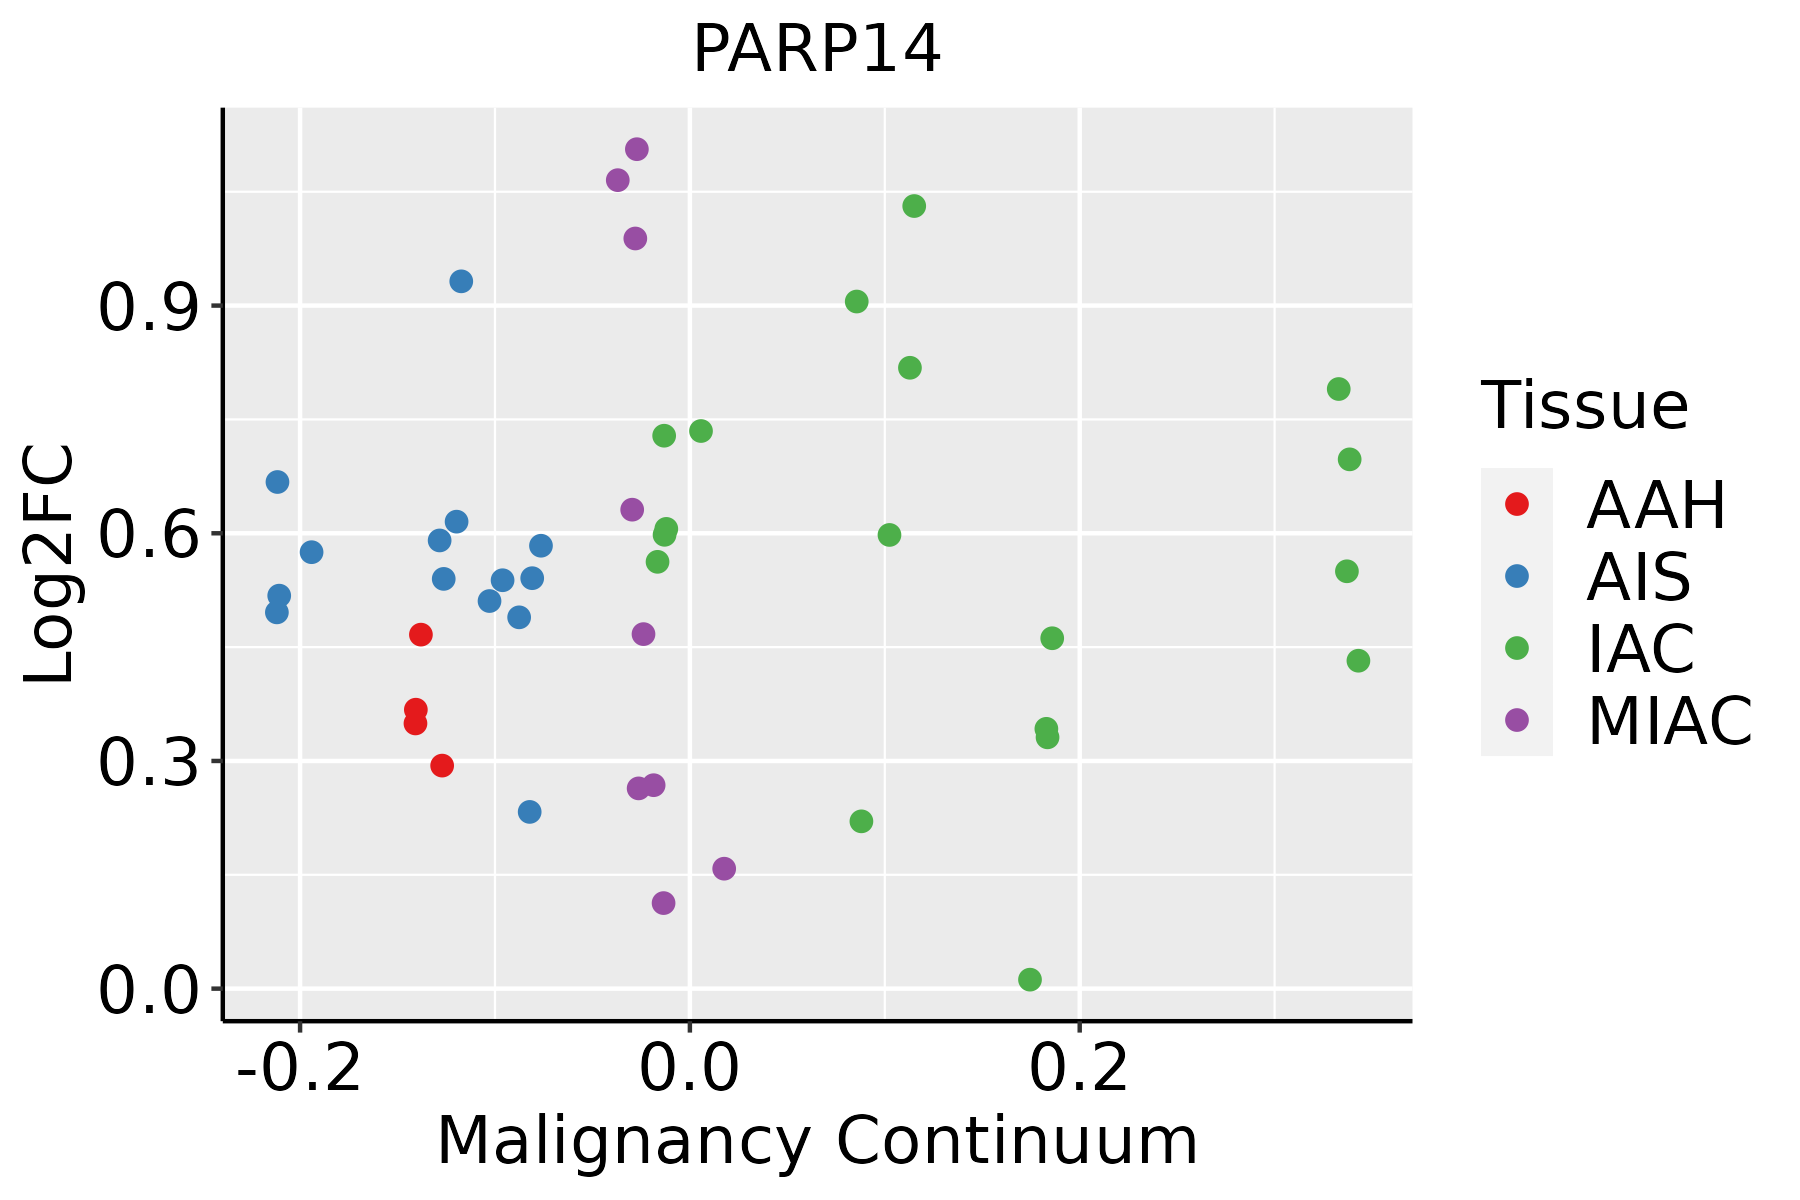 | AAH: Atypical adenomatous hyperplasia |
| AIS: Adenocarcinoma in situ |
| IAC: Invasive lung adenocarcinoma |
| MIA: Minimally invasive adenocarcinoma |
| Oral Cavity | 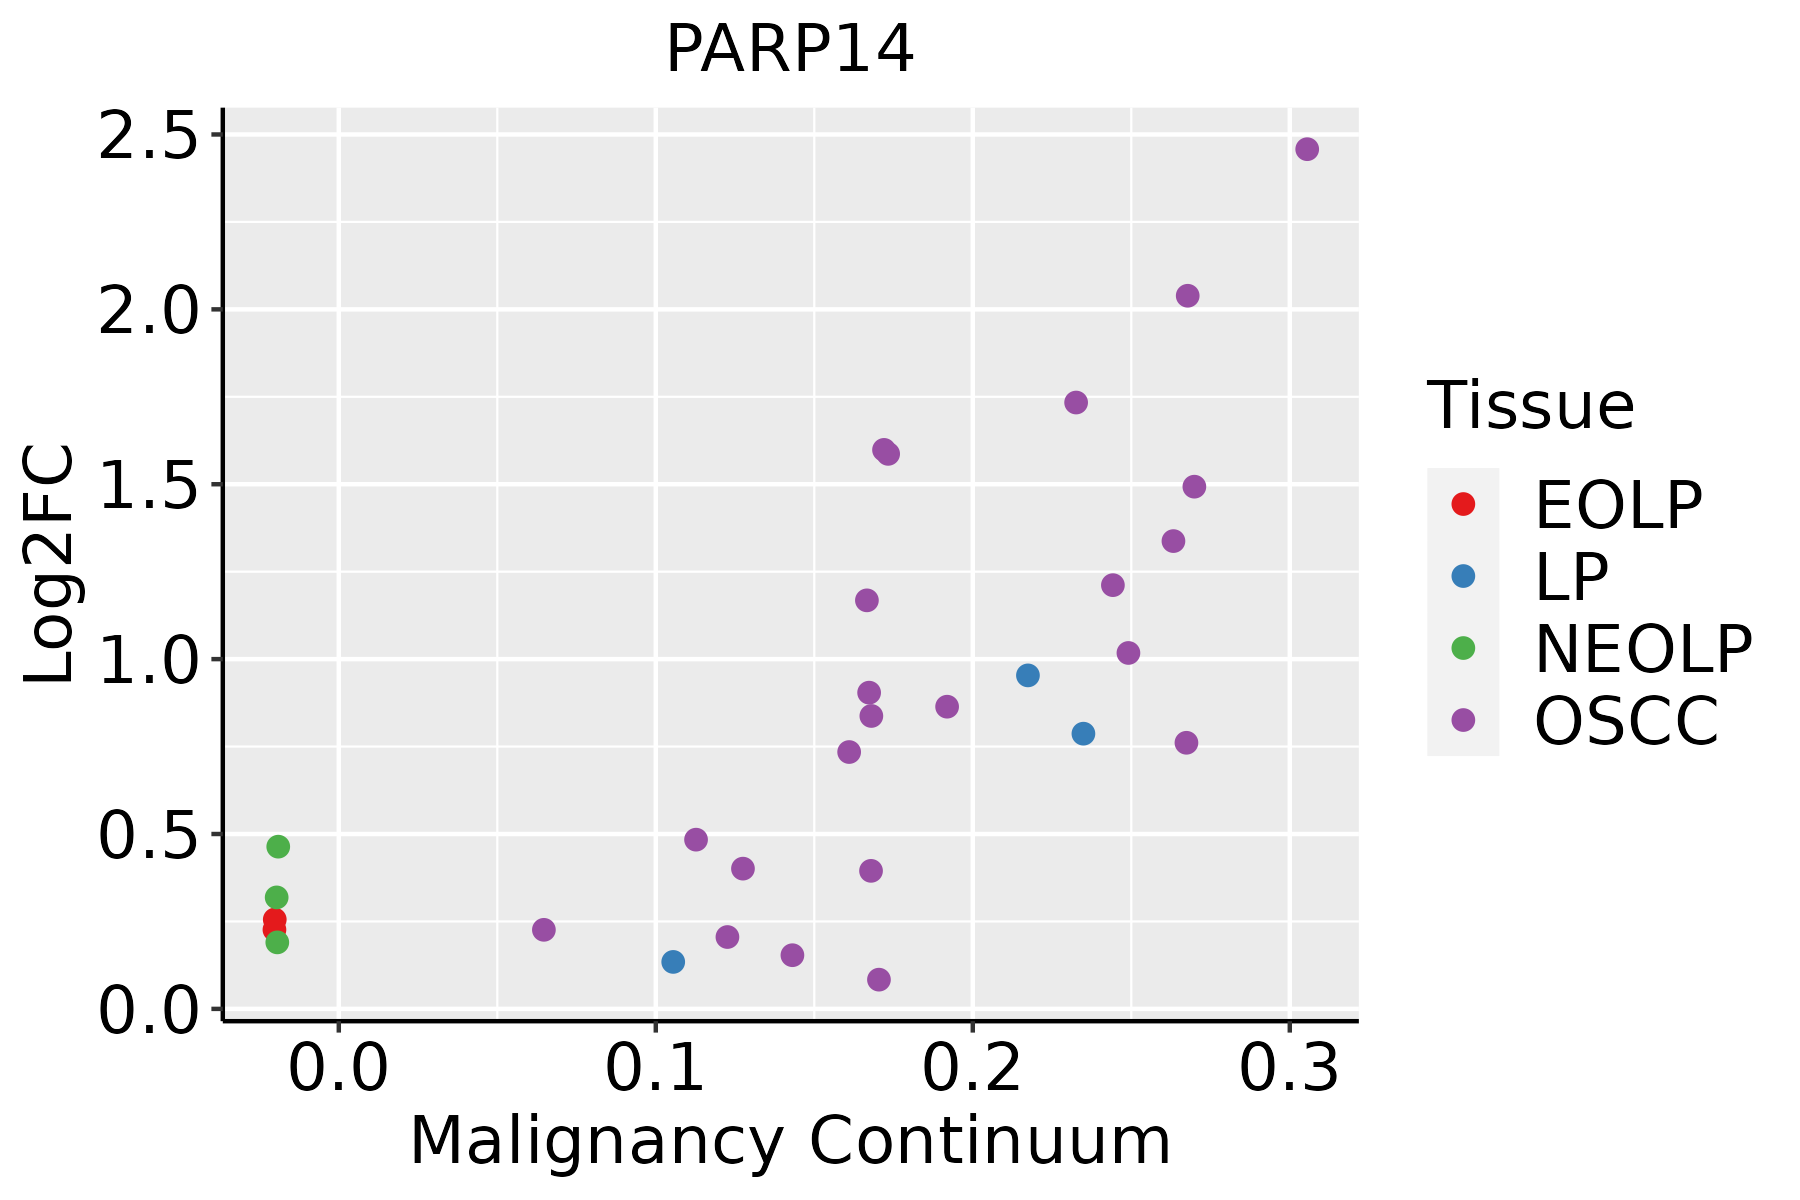 | EOLP: Erosive Oral lichen planus |
| LP: leukoplakia |
| NEOLP: Non-erosive oral lichen planus |
| OSCC: Oral squamous cell carcinoma |
| Prostate | 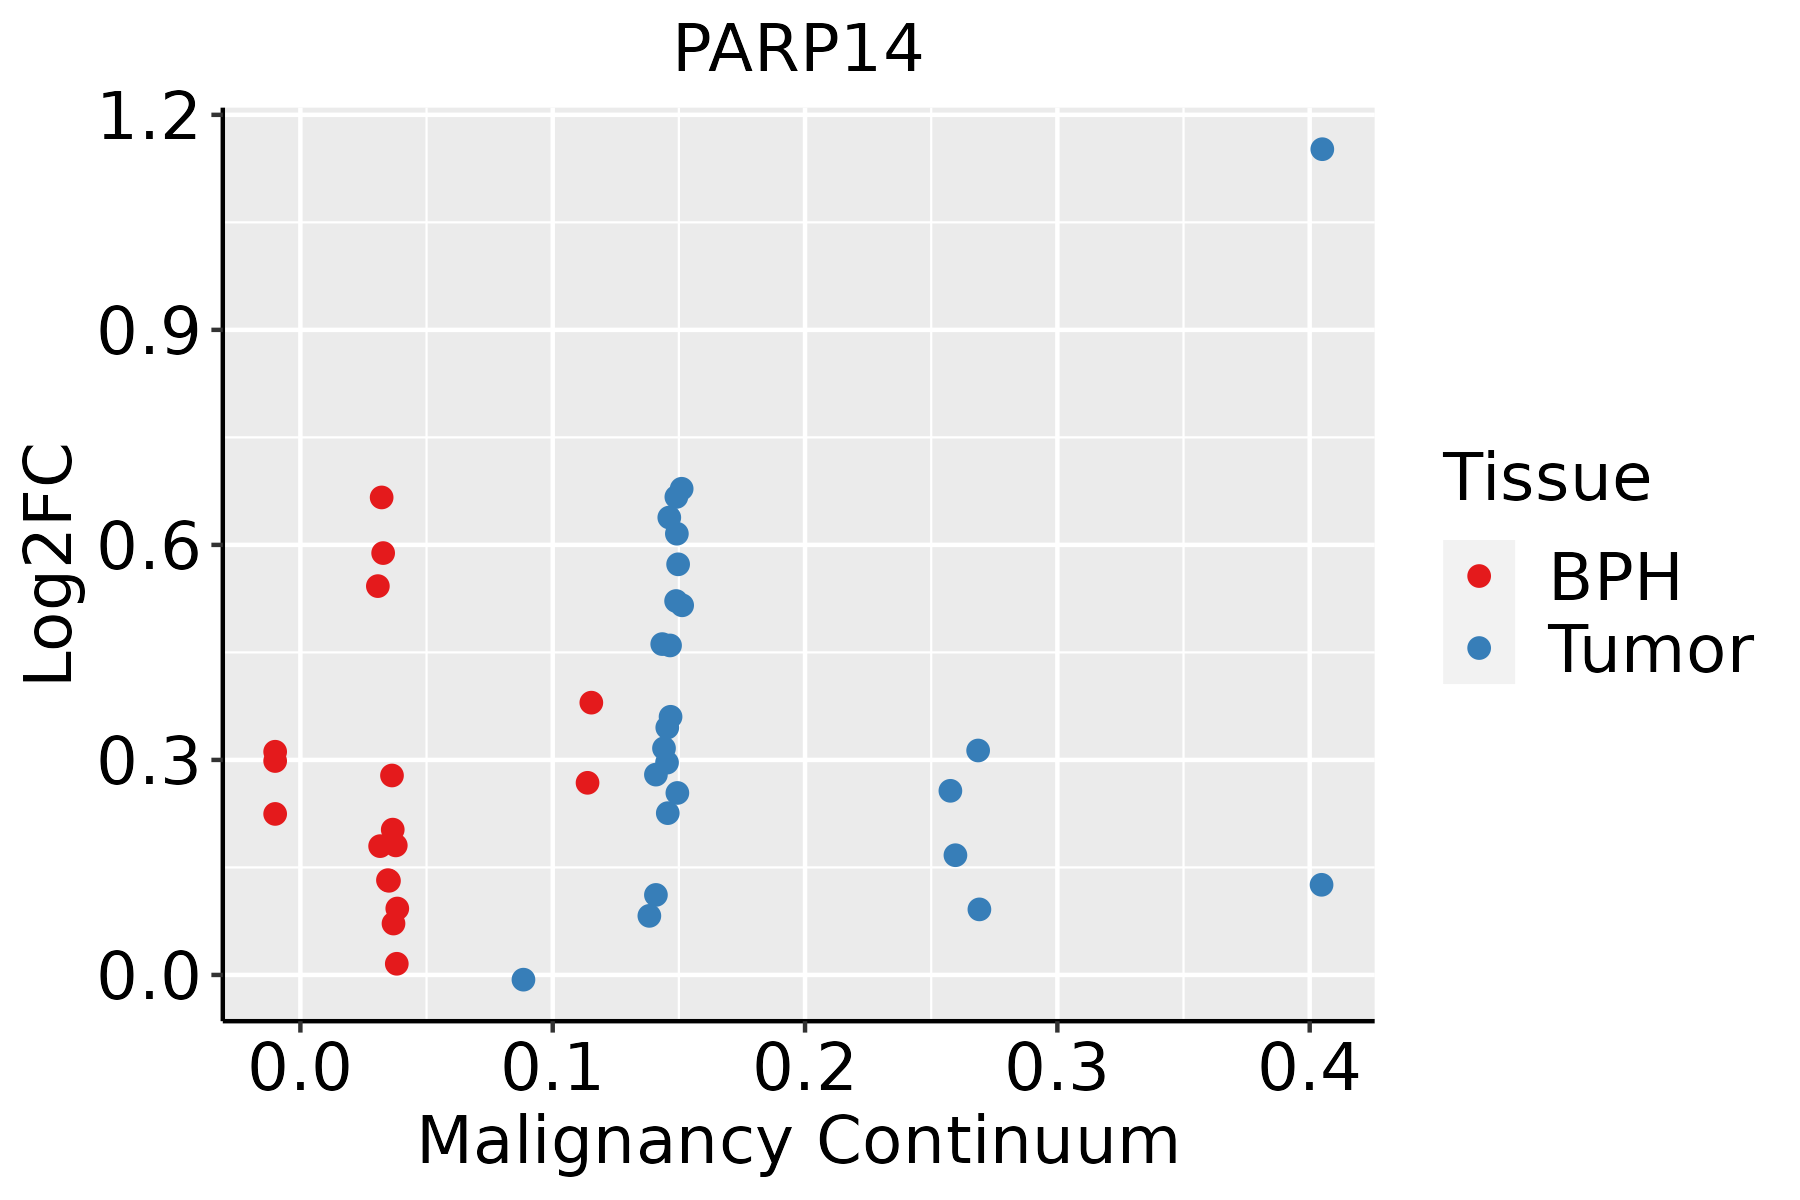 | BPH: Benign Prostatic Hyperplasia |
| Skin | 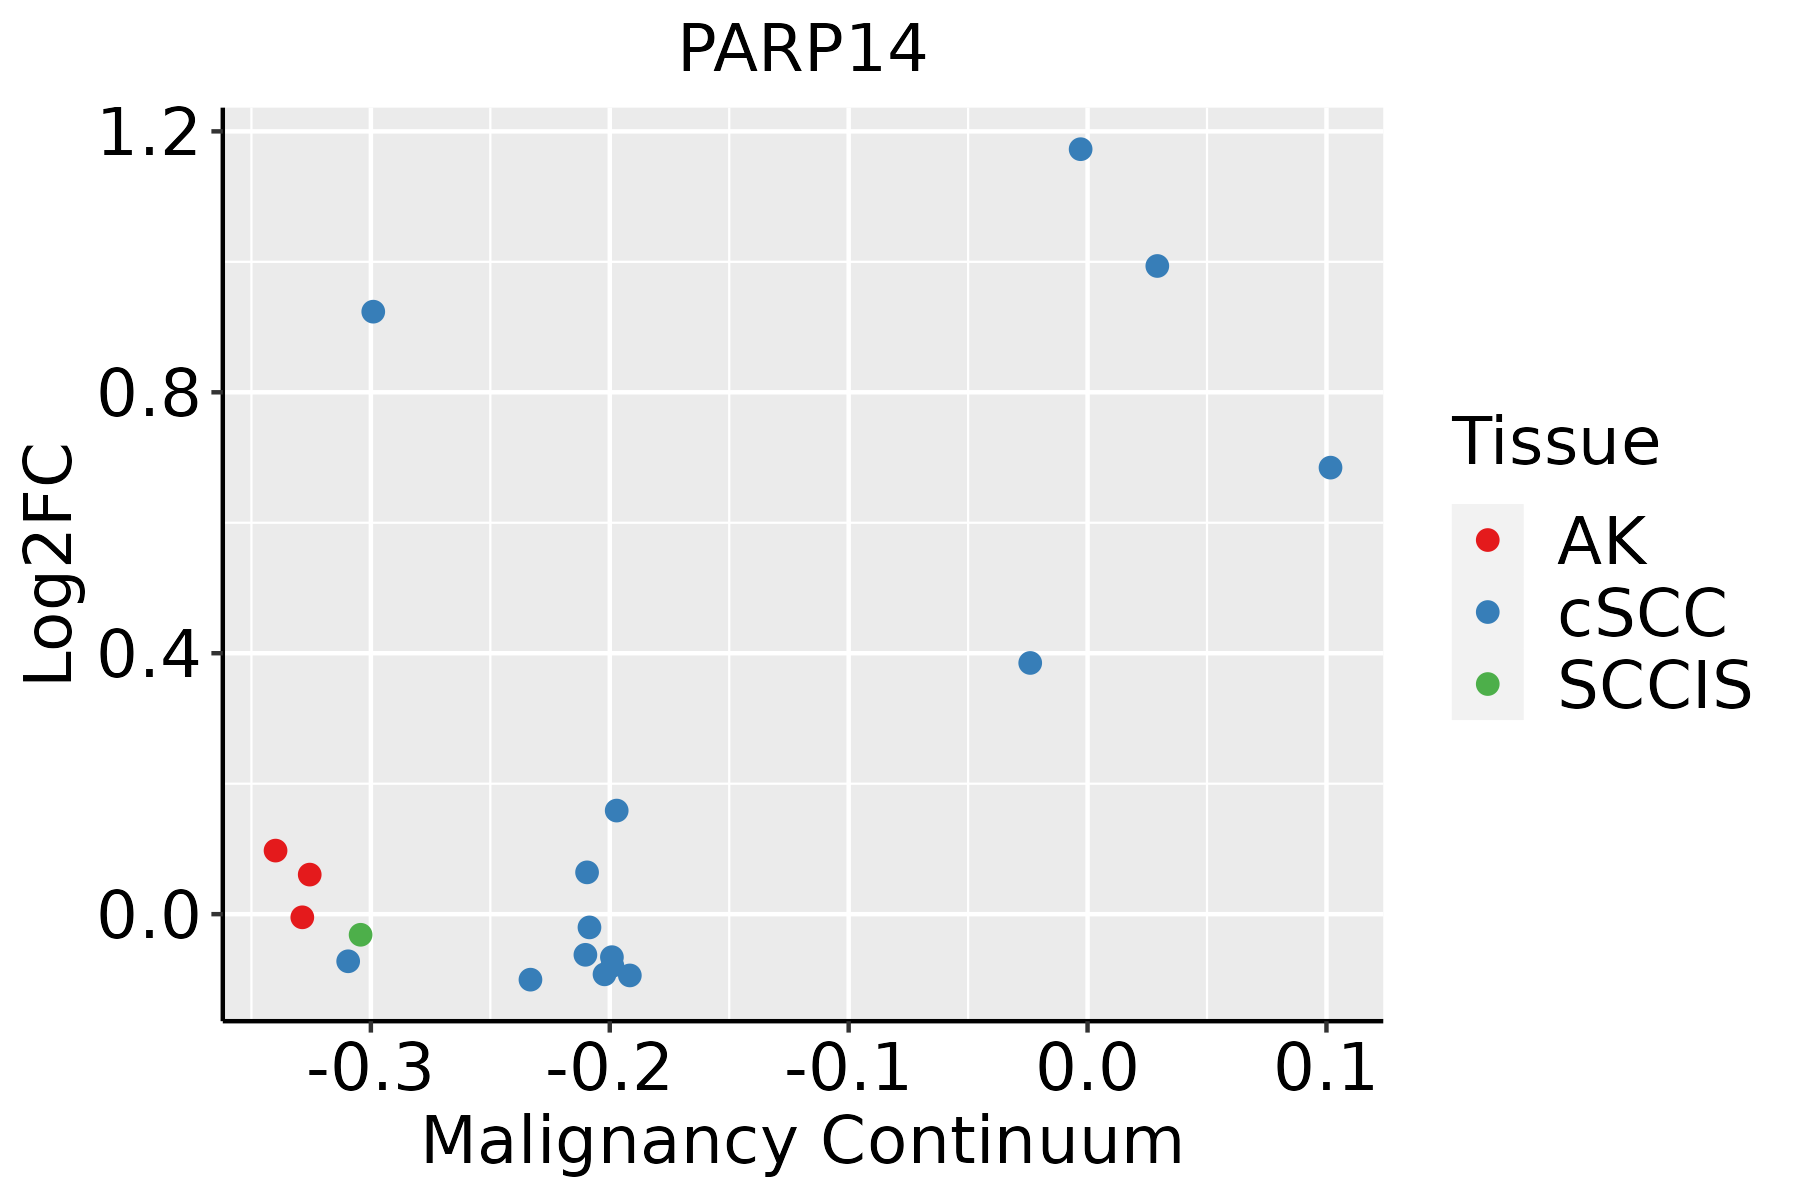 | AK: Actinic keratosis |
| cSCC: Cutaneous squamous cell carcinoma |
| SCCIS:squamous cell carcinoma in situ |
| Thyroid | 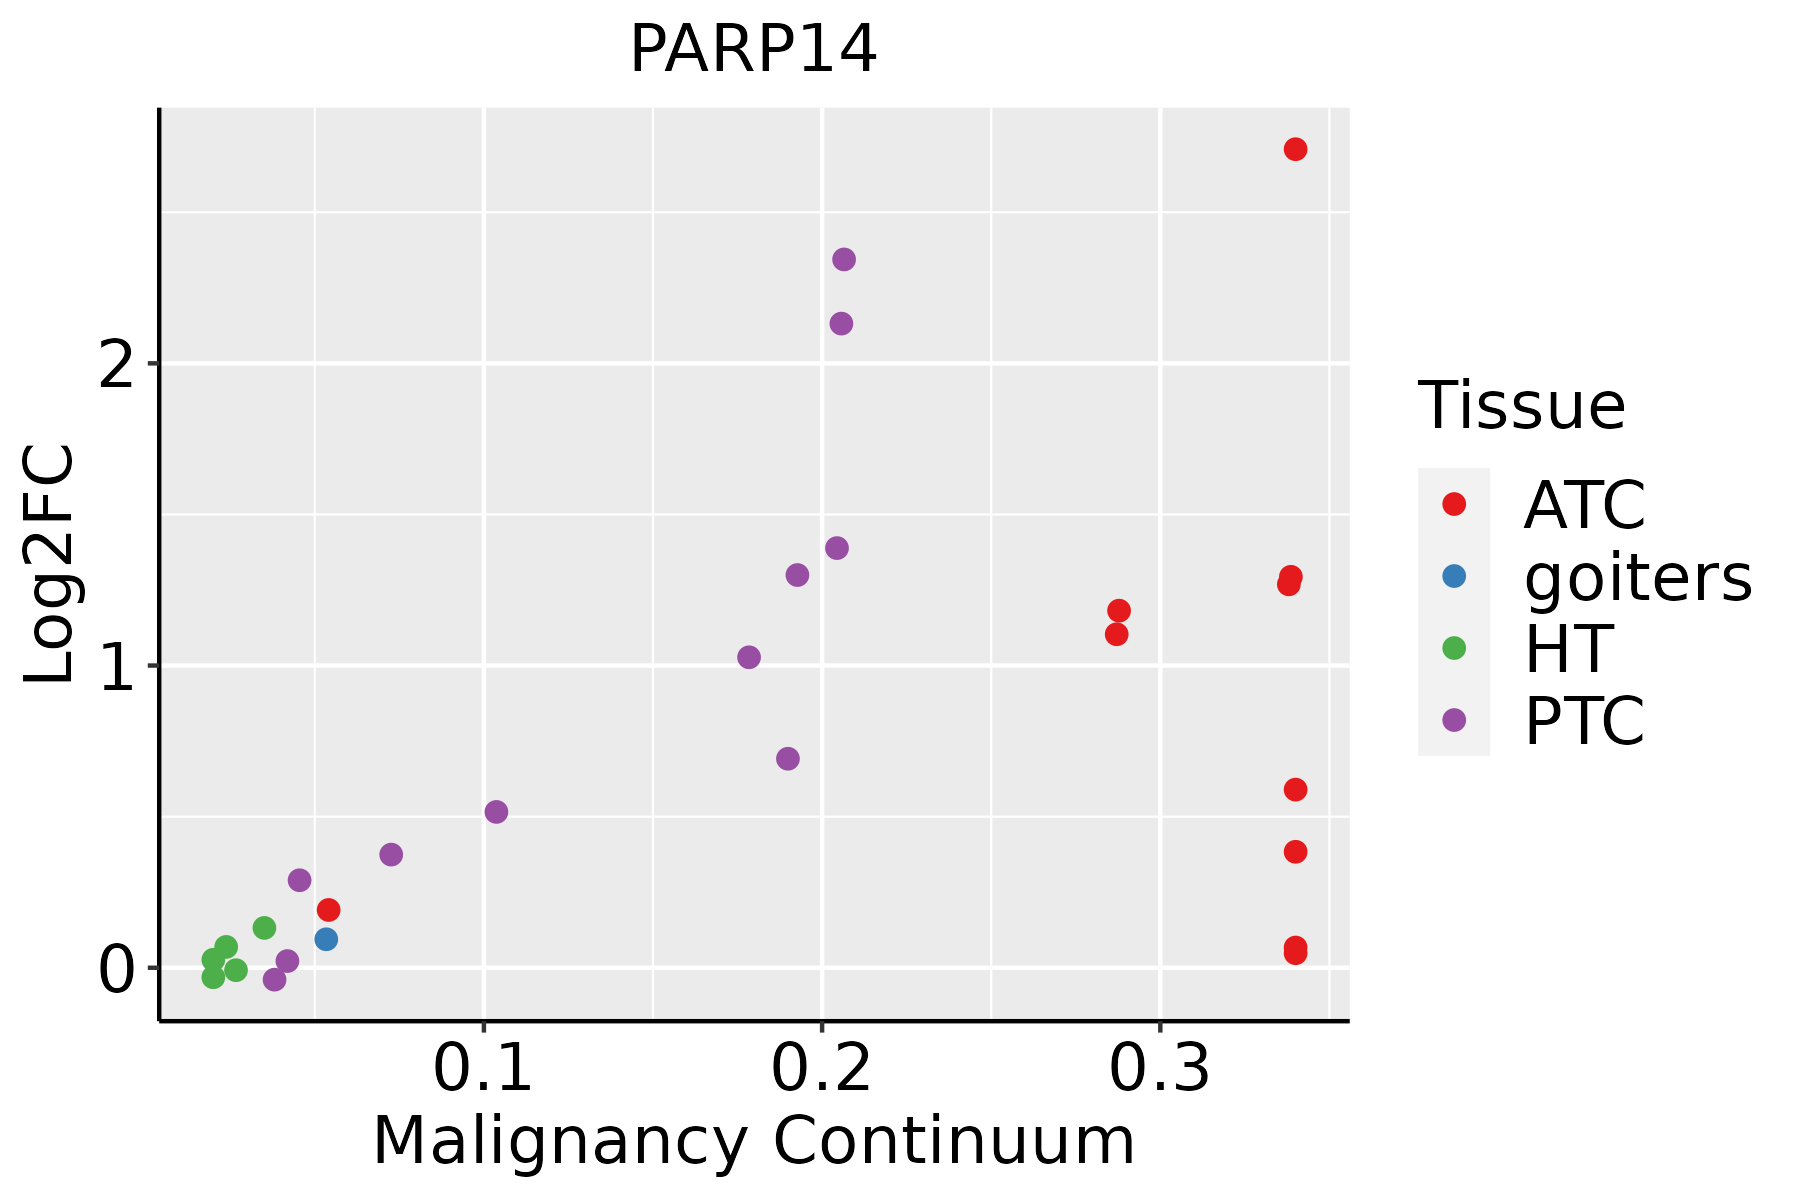 | ATC: Anaplastic thyroid cancer |
| HT: Hashimoto's thyroiditis |
| PTC: Papillary thyroid cancer |
| GO ID | Tissue | Disease Stage | Description | Gene Ratio | Bg Ratio | pvalue | p.adjust | Count |
| GO:0060334 | Liver | NAFLD | regulation of interferon-gamma-mediated signaling pathway | 6/1882 | 16/18723 | 3.37e-03 | 2.93e-02 | 6 |
| GO:0045088 | Liver | NAFLD | regulation of innate immune response | 34/1882 | 218/18723 | 6.47e-03 | 4.69e-02 | 34 |
| GO:004593612 | Liver | Cirrhotic | negative regulation of phosphate metabolic process | 154/4634 | 441/18723 | 8.78e-07 | 1.83e-05 | 154 |
| GO:001056312 | Liver | Cirrhotic | negative regulation of phosphorus metabolic process | 154/4634 | 442/18723 | 1.02e-06 | 2.11e-05 | 154 |
| GO:00343413 | Liver | Cirrhotic | response to interferon-gamma | 60/4634 | 141/18723 | 2.57e-06 | 4.63e-05 | 60 |
| GO:004232612 | Liver | Cirrhotic | negative regulation of phosphorylation | 135/4634 | 385/18723 | 3.17e-06 | 5.58e-05 | 135 |
| GO:0071346 | Liver | Cirrhotic | cellular response to interferon-gamma | 49/4634 | 118/18723 | 4.43e-05 | 5.22e-04 | 49 |
| GO:000193312 | Liver | Cirrhotic | negative regulation of protein phosphorylation | 117/4634 | 342/18723 | 4.84e-05 | 5.59e-04 | 117 |
| GO:00603332 | Liver | Cirrhotic | interferon-gamma-mediated signaling pathway | 16/4634 | 27/18723 | 1.41e-04 | 1.36e-03 | 16 |
| GO:00713532 | Liver | Cirrhotic | cellular response to interleukin-4 | 17/4634 | 33/18723 | 8.32e-04 | 6.06e-03 | 17 |
| GO:0002832 | Liver | Cirrhotic | negative regulation of response to biotic stimulus | 41/4634 | 108/18723 | 1.56e-03 | 1.01e-02 | 41 |
| GO:00706702 | Liver | Cirrhotic | response to interleukin-4 | 17/4634 | 36/18723 | 2.82e-03 | 1.63e-02 | 17 |
| GO:00458242 | Liver | Cirrhotic | negative regulation of innate immune response | 28/4634 | 71/18723 | 4.37e-03 | 2.31e-02 | 28 |
| GO:00028311 | Liver | Cirrhotic | regulation of response to biotic stimulus | 101/4634 | 327/18723 | 6.58e-03 | 3.25e-02 | 101 |
| GO:00603301 | Liver | Cirrhotic | regulation of response to interferon-gamma | 9/4634 | 16/18723 | 6.94e-03 | 3.38e-02 | 9 |
| GO:00603341 | Liver | Cirrhotic | regulation of interferon-gamma-mediated signaling pathway | 9/4634 | 16/18723 | 6.94e-03 | 3.38e-02 | 9 |
| GO:001056322 | Liver | HCC | negative regulation of phosphorus metabolic process | 259/7958 | 442/18723 | 4.29e-12 | 1.92e-10 | 259 |
| GO:004593622 | Liver | HCC | negative regulation of phosphate metabolic process | 258/7958 | 441/18723 | 6.00e-12 | 2.60e-10 | 258 |
| GO:004232622 | Liver | HCC | negative regulation of phosphorylation | 227/7958 | 385/18723 | 3.98e-11 | 1.52e-09 | 227 |
| GO:000193322 | Liver | HCC | negative regulation of protein phosphorylation | 196/7958 | 342/18723 | 1.95e-08 | 4.63e-07 | 196 |
| Hugo Symbol | Variant Class | Variant Classification | dbSNP RS | HGVSc | HGVSp | HGVSp Short | SWISSPROT | BIOTYPE | SIFT | PolyPhen | Tumor Sample Barcode | Tissue | Histology | Sex | Age | Stage | Therapy Types | Drugs | Outcome |
| PARP14 | SNV | Missense_Mutation | | c.2578C>G | p.Leu860Val | p.L860V | Q460N5 | protein_coding | tolerated(0.53) | benign(0.047) | TCGA-A2-A1FV-01 | Breast | breast invasive carcinoma | Female | >=65 | I/II | Chemotherapy | cyclophosphamide | SD |
| PARP14 | SNV | Missense_Mutation | novel | c.2665N>A | p.Glu889Lys | p.E889K | Q460N5 | protein_coding | tolerated(0.14) | benign(0.037) | TCGA-A8-A08H-01 | Breast | breast invasive carcinoma | Female | >=65 | I/II | Unknown | Unknown | SD |
| PARP14 | SNV | Missense_Mutation | | c.2473N>A | p.Glu825Lys | p.E825K | Q460N5 | protein_coding | deleterious(0.02) | possibly_damaging(0.749) | TCGA-AC-A23H-01 | Breast | breast invasive carcinoma | Female | >=65 | I/II | Unknown | Unknown | PD |
| PARP14 | SNV | Missense_Mutation | | c.4653N>T | p.Met1551Ile | p.M1551I | Q460N5 | protein_coding | tolerated(1) | benign(0.003) | TCGA-AN-A046-01 | Breast | breast invasive carcinoma | Female | >=65 | I/II | Unknown | Unknown | SD |
| PARP14 | SNV | Missense_Mutation | | c.142N>T | p.Pro48Ser | p.P48S | Q460N5 | protein_coding | tolerated(0.07) | possibly_damaging(0.609) | TCGA-B6-A0RH-01 | Breast | breast invasive carcinoma | Female | <65 | I/II | Unknown | Unknown | PD |
| PARP14 | SNV | Missense_Mutation | novel | c.5212N>A | p.Val1738Met | p.V1738M | Q460N5 | protein_coding | tolerated(1) | benign(0) | TCGA-BH-A0HF-01 | Breast | breast invasive carcinoma | Female | >=65 | I/II | Hormone Therapy | arimidex | SD |
| PARP14 | SNV | Missense_Mutation | novel | c.2375G>C | p.Cys792Ser | p.C792S | Q460N5 | protein_coding | tolerated(0.19) | benign(0.003) | TCGA-BH-A0HU-01 | Breast | breast invasive carcinoma | Female | <65 | I/II | Chemotherapy | docetaxel | SD |
| PARP14 | SNV | Missense_Mutation | | c.763N>C | p.Gly255Arg | p.G255R | Q460N5 | protein_coding | deleterious(0) | probably_damaging(0.995) | TCGA-C8-A134-01 | Breast | breast invasive carcinoma | Female | <65 | I/II | Chemotherapy | 5-fluorouracil | CR |
| PARP14 | SNV | Missense_Mutation | | c.4396G>C | p.Asp1466His | p.D1466H | Q460N5 | protein_coding | tolerated(0.13) | benign(0.048) | TCGA-E2-A1LH-01 | Breast | breast invasive carcinoma | Female | <65 | I/II | Chemotherapy | adriamycin | SD |
| PARP14 | SNV | Missense_Mutation | | c.3835N>G | p.Gln1279Glu | p.Q1279E | Q460N5 | protein_coding | tolerated(1) | benign(0.372) | TCGA-GM-A2DH-01 | Breast | breast invasive carcinoma | Female | <65 | I/II | Chemotherapy | taxol | CR |


