| Tissue | Expression Dynamics | Abbreviation |
| Cervix | 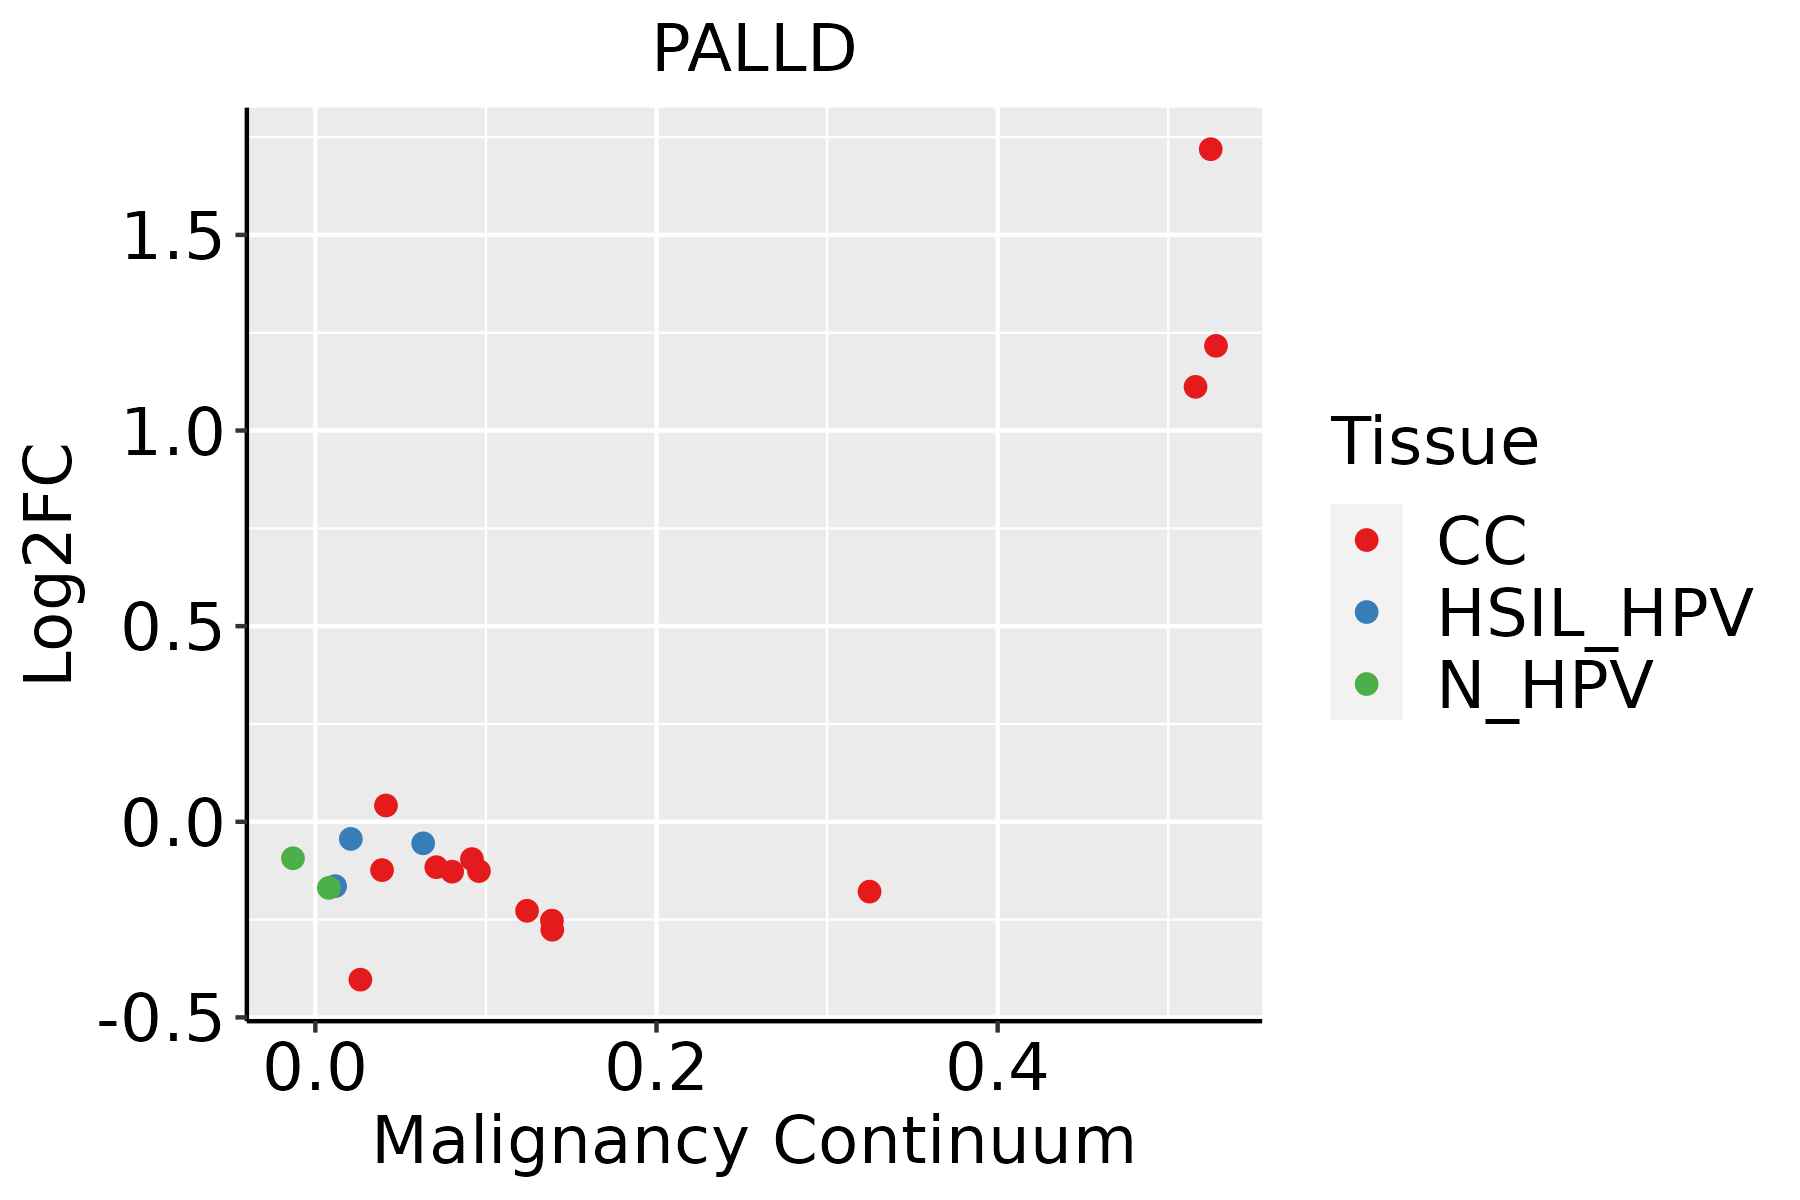 | CC: Cervix cancer |
| HSIL_HPV: HPV-infected high-grade squamous intraepithelial lesions |
| N_HPV: HPV-infected normal cervix |
| Colorectum (GSE201348) |  | FAP: Familial adenomatous polyposis |
| CRC: Colorectal cancer |
| Colorectum (HTA11) |  | AD: Adenomas |
| SER: Sessile serrated lesions |
| MSI-H: Microsatellite-high colorectal cancer |
| MSS: Microsatellite stable colorectal cancer |
| Endometrium | 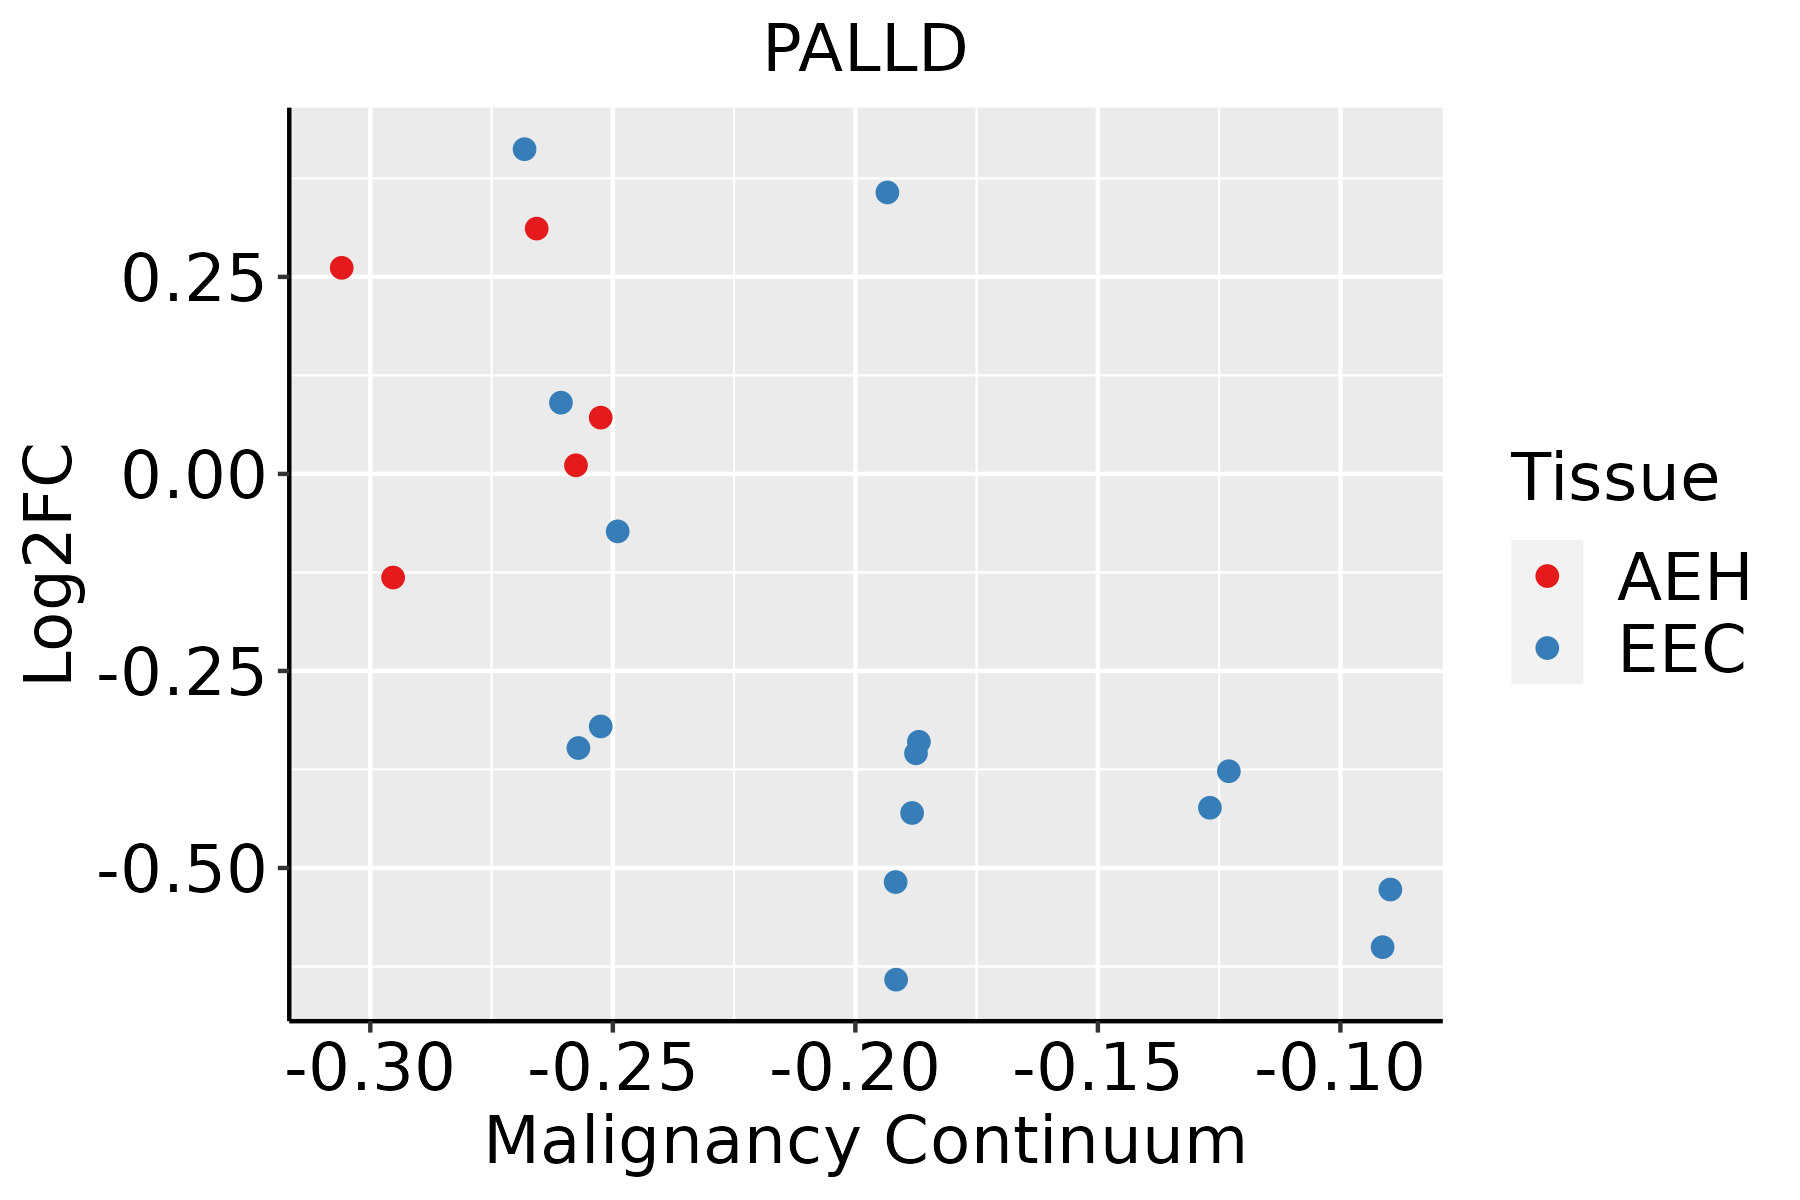 | AEH: Atypical endometrial hyperplasia |
| EEC: Endometrioid Cancer |
| Esophagus | 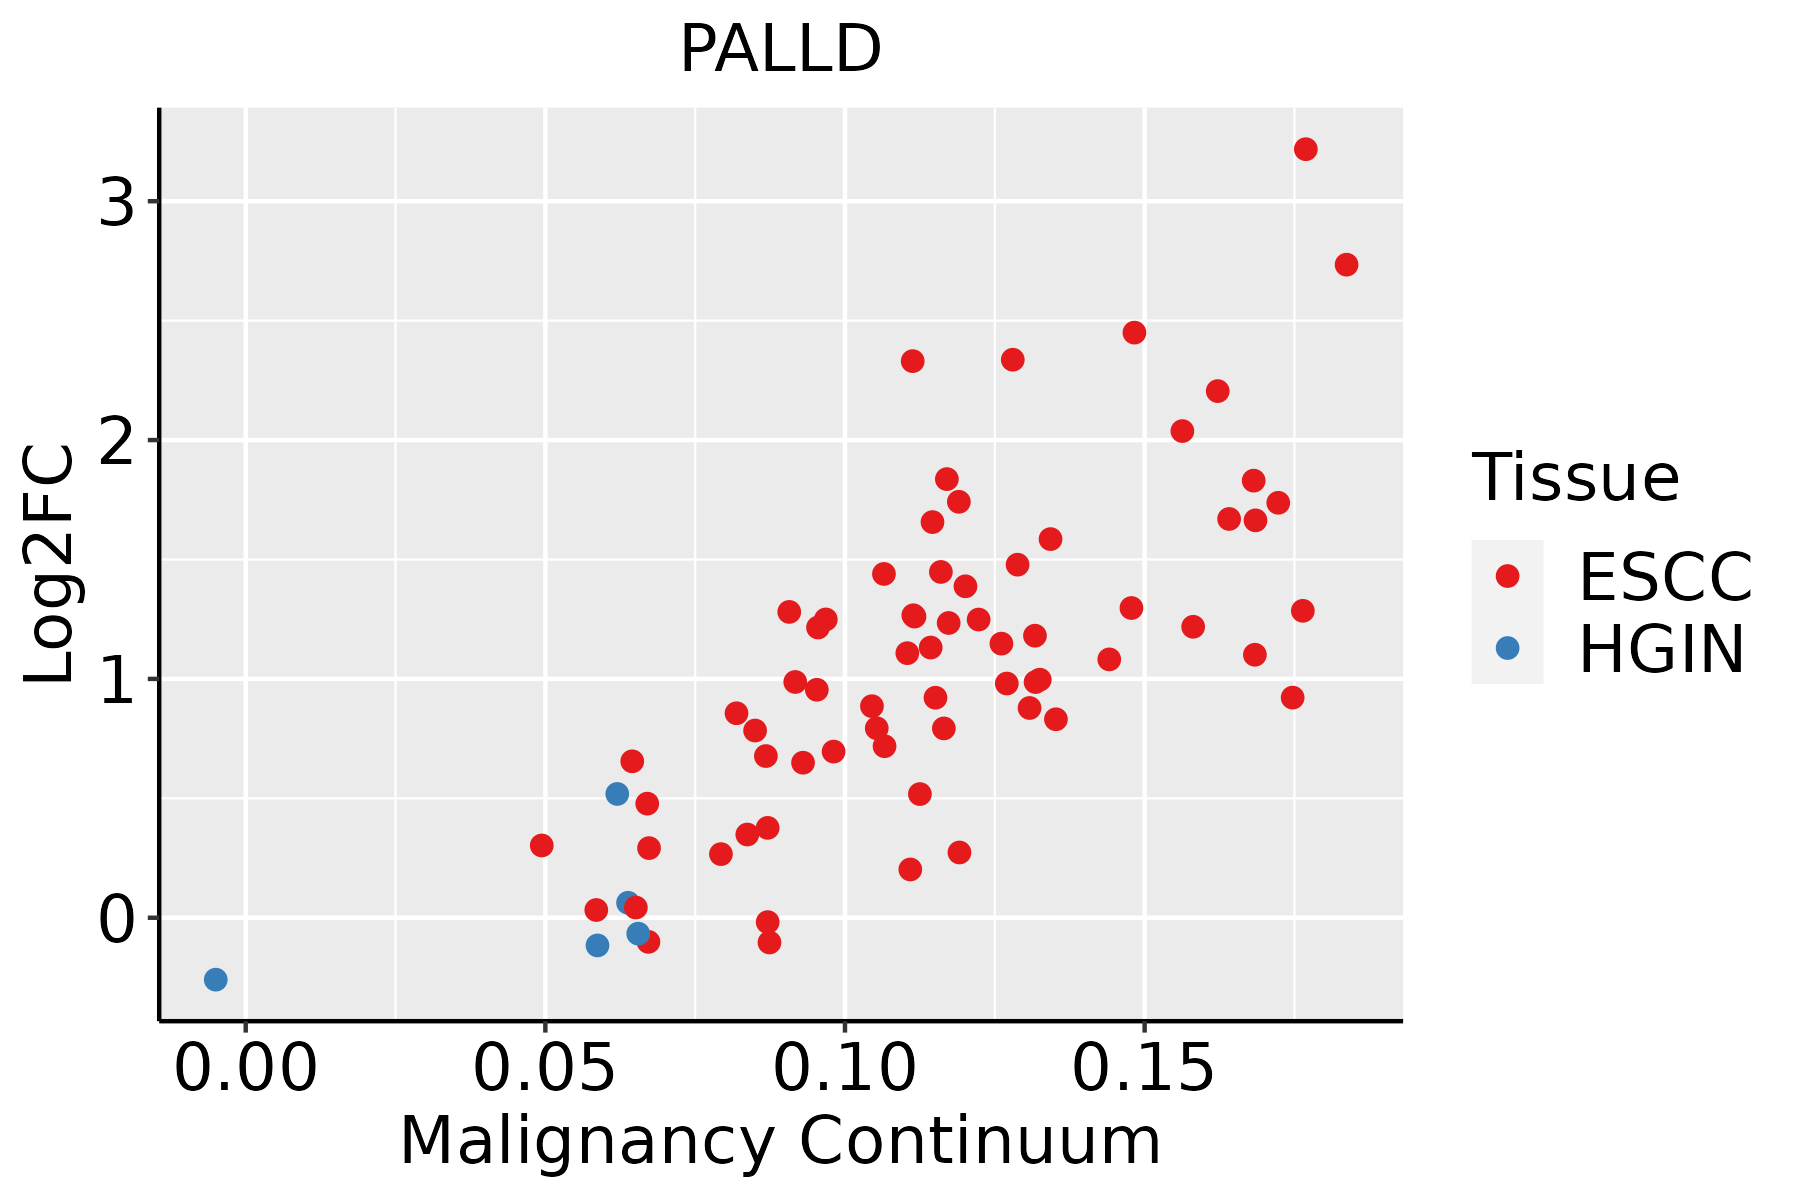 | ESCC: Esophageal squamous cell carcinoma |
| HGIN: High-grade intraepithelial neoplasias |
| LGIN: Low-grade intraepithelial neoplasias |
| Liver | 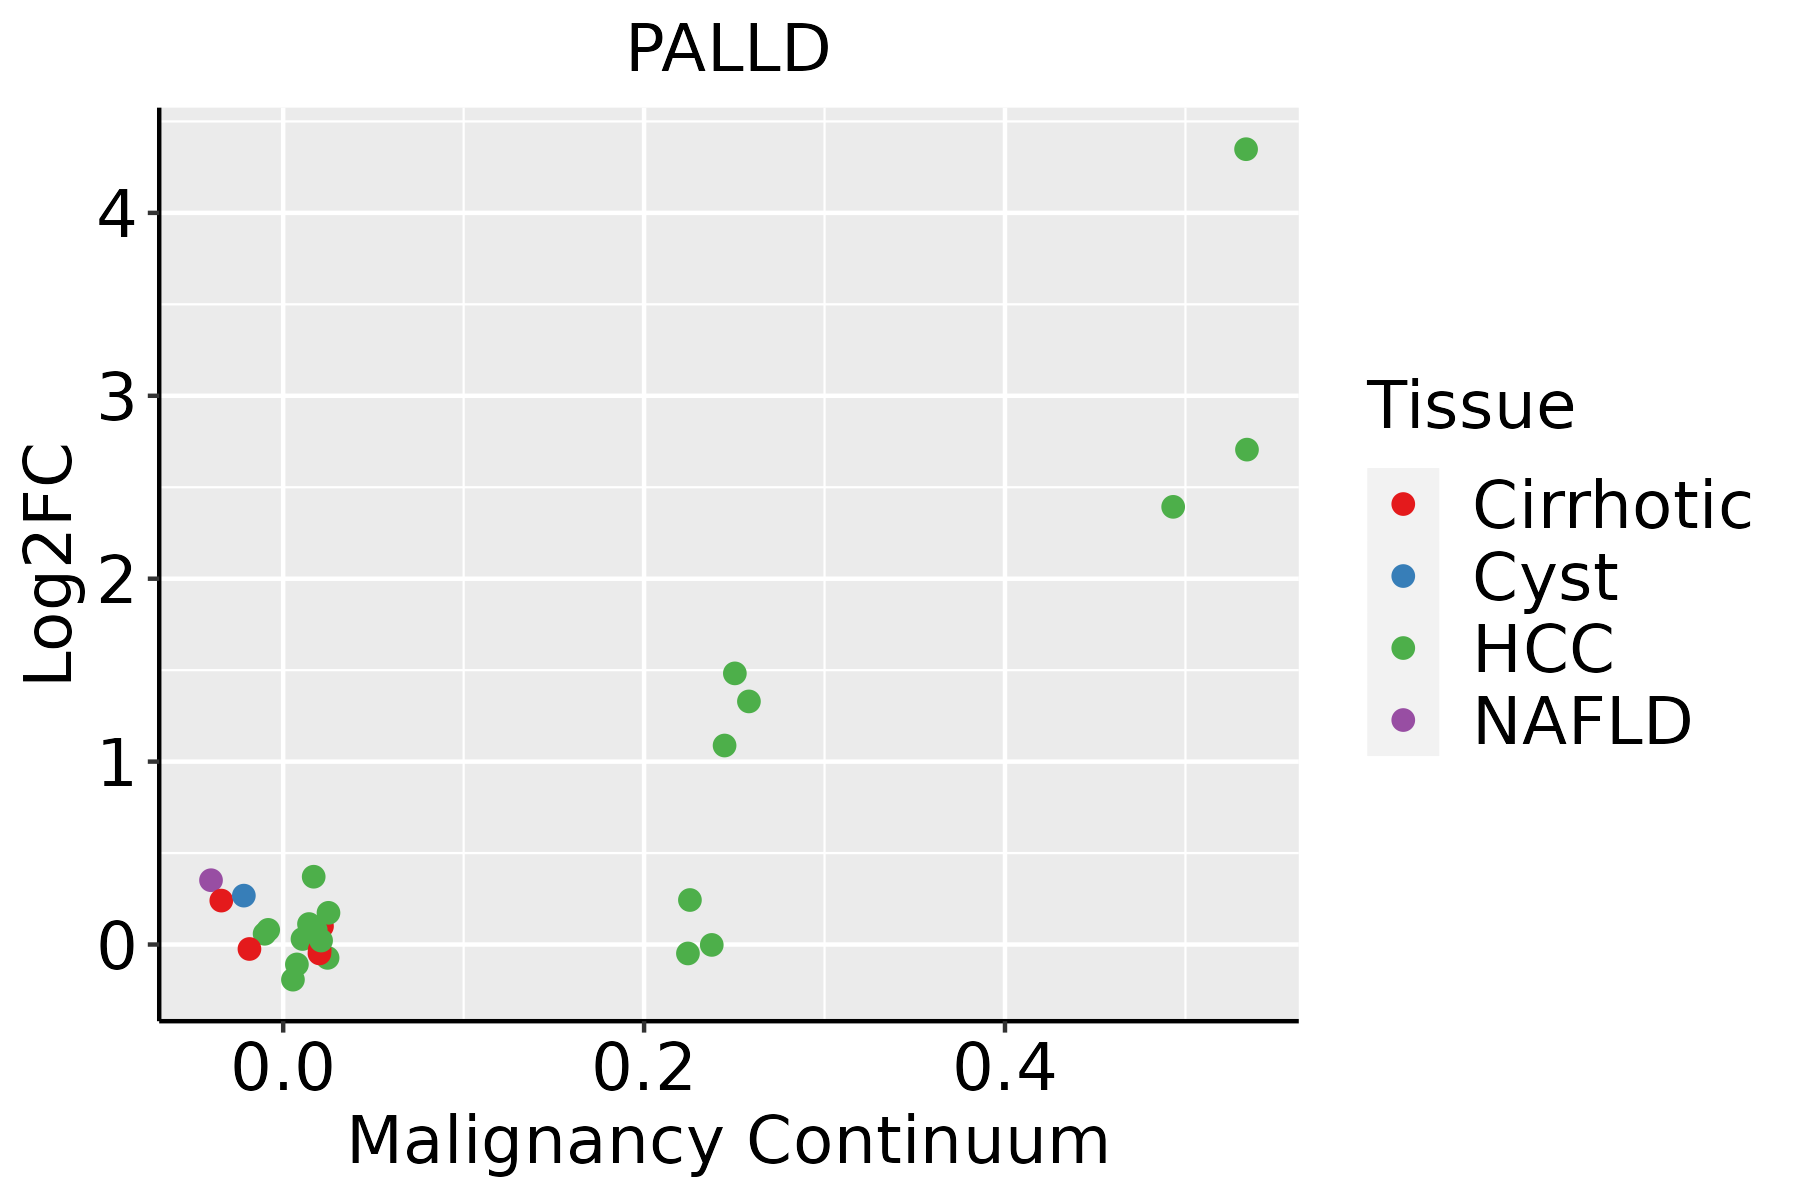 | HCC: Hepatocellular carcinoma |
| NAFLD: Non-alcoholic fatty liver disease |
| Lung | 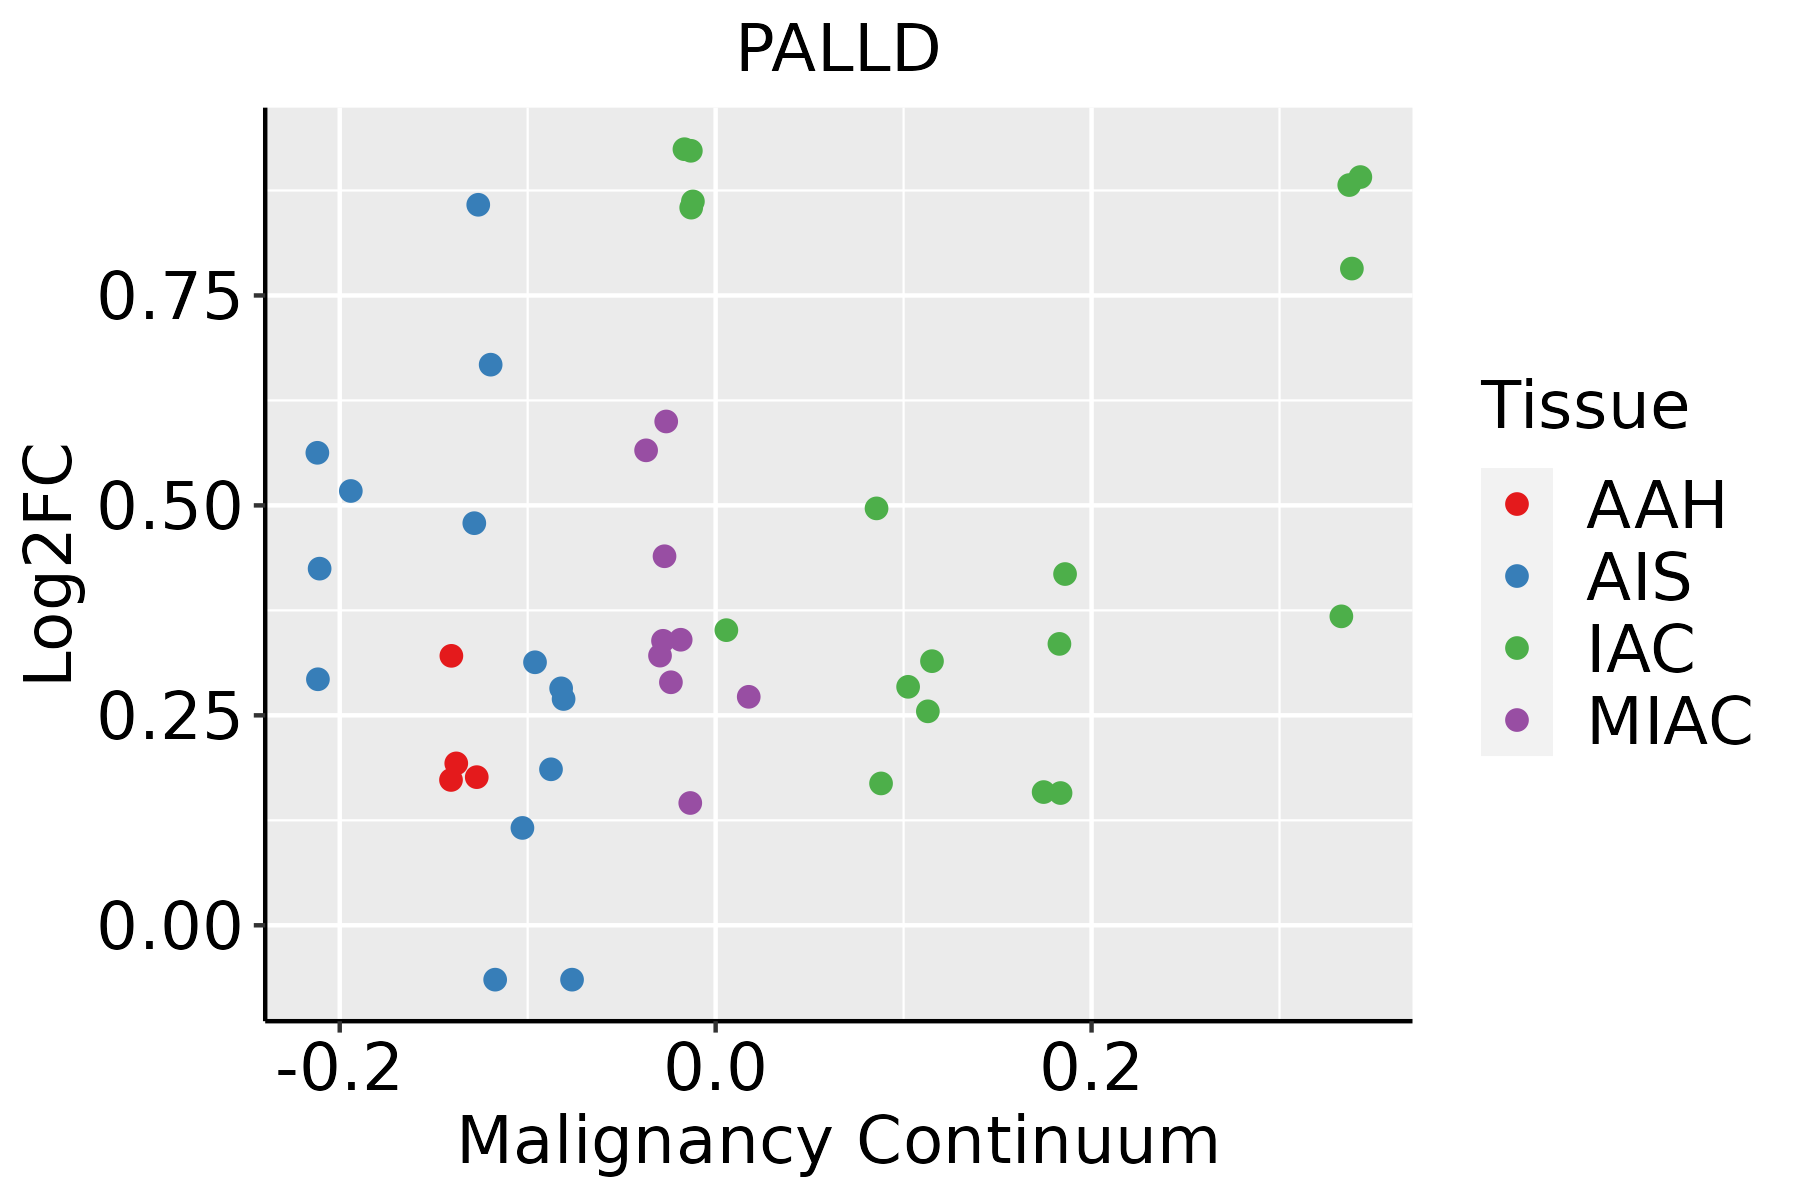 | AAH: Atypical adenomatous hyperplasia |
| AIS: Adenocarcinoma in situ |
| IAC: Invasive lung adenocarcinoma |
| MIA: Minimally invasive adenocarcinoma |
| Oral Cavity |  | EOLP: Erosive Oral lichen planus |
| LP: leukoplakia |
| NEOLP: Non-erosive oral lichen planus |
| OSCC: Oral squamous cell carcinoma |
| Prostate |  | BPH: Benign Prostatic Hyperplasia |
| Skin |  | AK: Actinic keratosis |
| cSCC: Cutaneous squamous cell carcinoma |
| SCCIS:squamous cell carcinoma in situ |
| Thyroid | 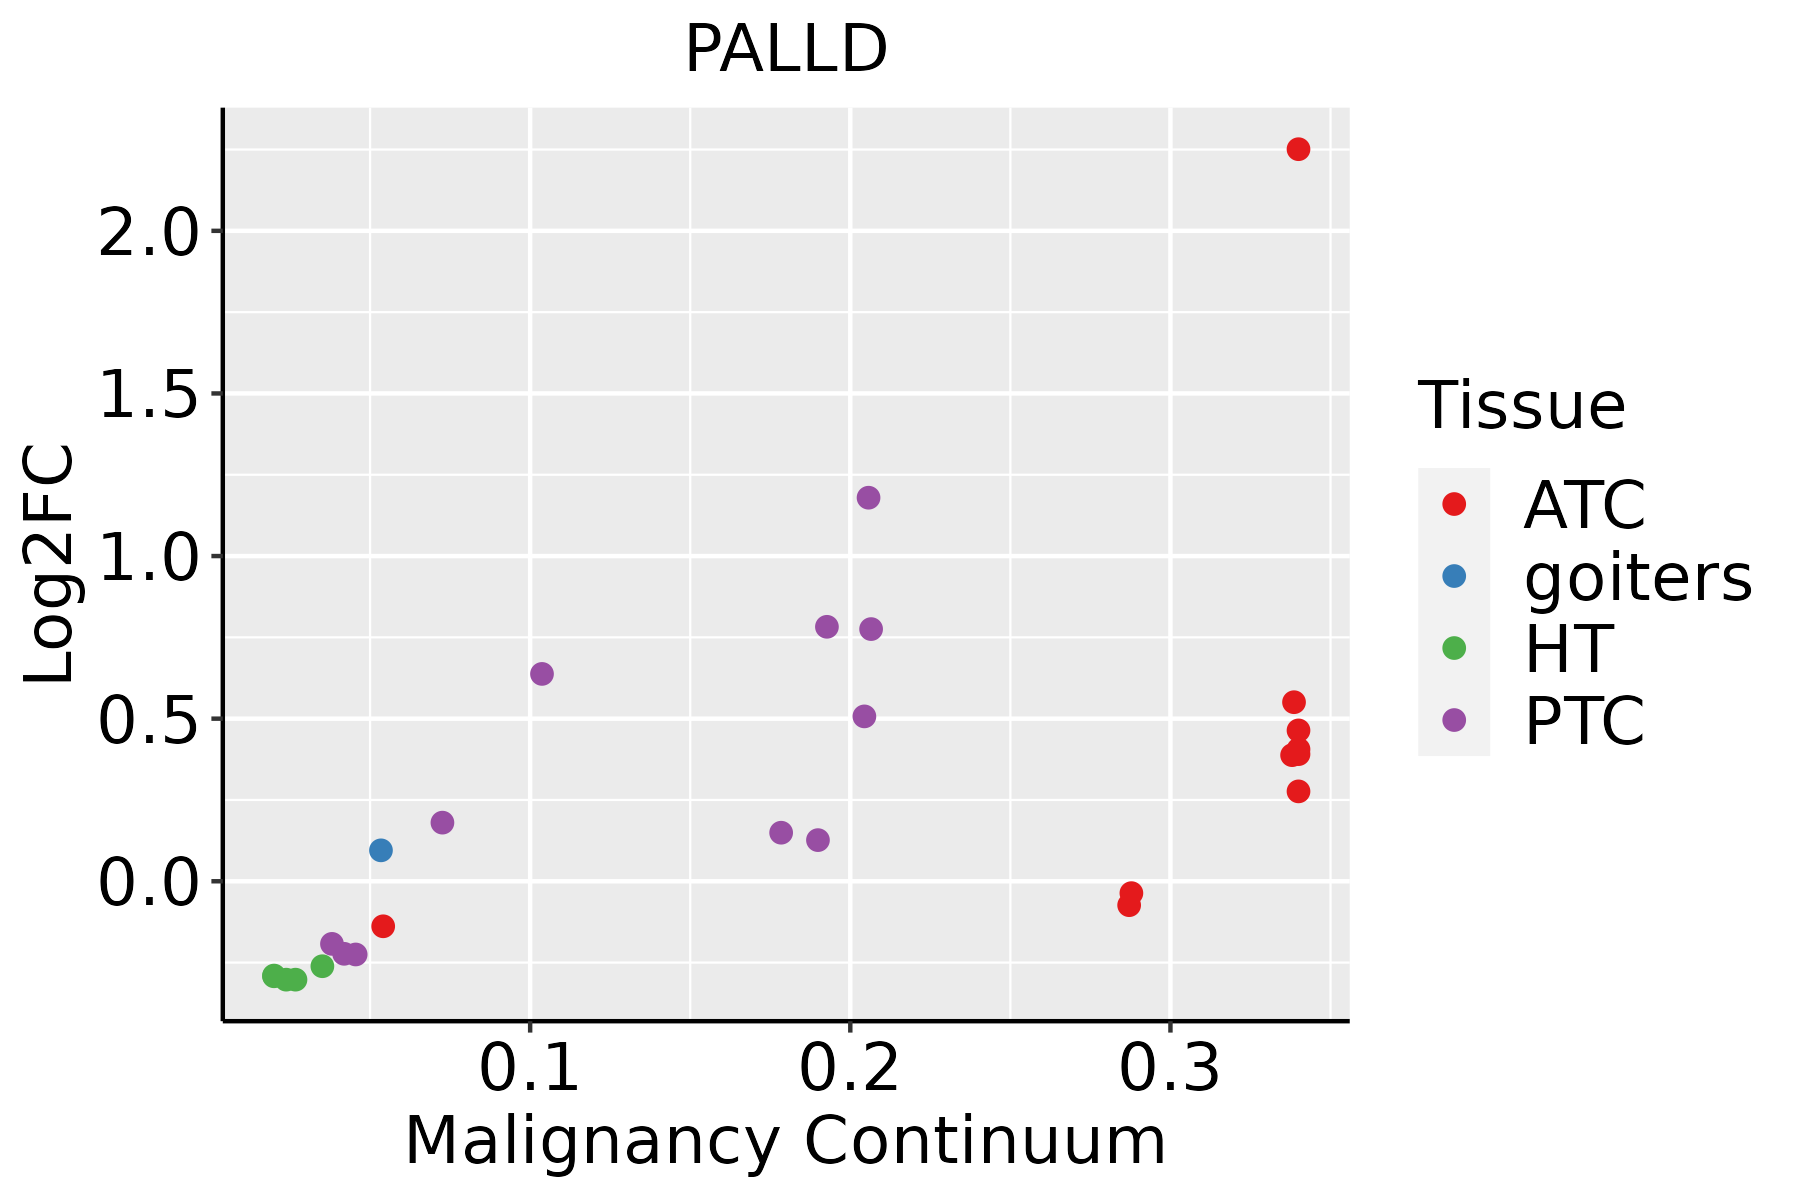 | ATC: Anaplastic thyroid cancer |
| HT: Hashimoto's thyroiditis |
| PTC: Papillary thyroid cancer |
| GO ID | Tissue | Disease Stage | Description | Gene Ratio | Bg Ratio | pvalue | p.adjust | Count |
| GO:006156410 | Oral cavity | OSCC | axon development | 207/7305 | 467/18723 | 1.01e-02 | 3.51e-02 | 207 |
| GO:000854416 | Oral cavity | LP | epidermis development | 112/4623 | 324/18723 | 3.81e-05 | 5.61e-04 | 112 |
| GO:004358816 | Oral cavity | LP | skin development | 93/4623 | 263/18723 | 6.47e-05 | 8.70e-04 | 93 |
| GO:003021613 | Oral cavity | LP | keratinocyte differentiation | 51/4623 | 139/18723 | 1.05e-03 | 8.84e-03 | 51 |
| GO:000991315 | Oral cavity | LP | epidermal cell differentiation | 69/4623 | 202/18723 | 1.53e-03 | 1.19e-02 | 69 |
| GO:000206424 | Oral cavity | NEOLP | epithelial cell development | 45/2005 | 220/18723 | 1.45e-05 | 2.54e-04 | 45 |
| GO:003021631 | Oral cavity | NEOLP | keratinocyte differentiation | 32/2005 | 139/18723 | 2.16e-05 | 3.57e-04 | 32 |
| GO:006156421 | Oral cavity | NEOLP | axon development | 78/2005 | 467/18723 | 4.49e-05 | 6.26e-04 | 78 |
| GO:000740914 | Oral cavity | NEOLP | axonogenesis | 71/2005 | 418/18723 | 5.64e-05 | 7.62e-04 | 71 |
| GO:000854431 | Oral cavity | NEOLP | epidermis development | 57/2005 | 324/18723 | 1.13e-04 | 1.35e-03 | 57 |
| GO:004358831 | Oral cavity | NEOLP | skin development | 48/2005 | 263/18723 | 1.56e-04 | 1.77e-03 | 48 |
| GO:000991331 | Oral cavity | NEOLP | epidermal cell differentiation | 38/2005 | 202/18723 | 3.92e-04 | 3.64e-03 | 38 |
| GO:000206417 | Prostate | BPH | epithelial cell development | 85/3107 | 220/18723 | 3.16e-15 | 4.55e-13 | 85 |
| GO:00615649 | Prostate | BPH | axon development | 111/3107 | 467/18723 | 3.51e-05 | 3.88e-04 | 111 |
| GO:00435886 | Prostate | BPH | skin development | 69/3107 | 263/18723 | 4.49e-05 | 4.73e-04 | 69 |
| GO:00033823 | Prostate | BPH | epithelial cell morphogenesis | 15/3107 | 33/18723 | 9.91e-05 | 9.20e-04 | 15 |
| GO:00085448 | Prostate | BPH | epidermis development | 80/3107 | 324/18723 | 1.12e-04 | 1.02e-03 | 80 |
| GO:00074099 | Prostate | BPH | axonogenesis | 98/3107 | 418/18723 | 1.68e-04 | 1.45e-03 | 98 |
| GO:00099138 | Prostate | BPH | epidermal cell differentiation | 52/3107 | 202/18723 | 5.95e-04 | 4.11e-03 | 52 |
| GO:00302165 | Prostate | BPH | keratinocyte differentiation | 38/3107 | 139/18723 | 9.35e-04 | 5.92e-03 | 38 |
| Hugo Symbol | Variant Class | Variant Classification | dbSNP RS | HGVSc | HGVSp | HGVSp Short | SWISSPROT | BIOTYPE | SIFT | PolyPhen | Tumor Sample Barcode | Tissue | Histology | Sex | Age | Stage | Therapy Types | Drugs | Outcome |
| PALLD | SNV | Missense_Mutation | novel | c.1084N>C | p.Glu362Gln | p.E362Q | Q8WX93 | protein_coding | tolerated(0.14) | probably_damaging(0.996) | TCGA-A1-A0SH-01 | Breast | breast invasive carcinoma | Female | <65 | I/II | Chemotherapy | tc | SD |
| PALLD | SNV | Missense_Mutation | | c.566N>C | p.Arg189Thr | p.R189T | Q8WX93 | protein_coding | deleterious(0.01) | benign(0.224) | TCGA-AC-A23H-01 | Breast | breast invasive carcinoma | Female | >=65 | I/II | Unknown | Unknown | PD |
| PALLD | SNV | Missense_Mutation | rs187404166 | c.1354G>A | p.Val452Met | p.V452M | Q8WX93 | protein_coding | deleterious(0) | possibly_damaging(0.891) | TCGA-AC-A62X-01 | Breast | breast invasive carcinoma | Female | >=65 | I/II | Unknown | Unknown | SD |
| PALLD | SNV | Missense_Mutation | novel | c.22G>C | p.Glu8Gln | p.E8Q | Q8WX93 | protein_coding | tolerated(0.09) | benign(0.028) | TCGA-AC-A6IW-01 | Breast | breast invasive carcinoma | Female | >=65 | I/II | Unknown | Unknown | SD |
| PALLD | SNV | Missense_Mutation | novel | c.1159C>A | p.Gln387Lys | p.Q387K | Q8WX93 | protein_coding | deleterious(0.02) | possibly_damaging(0.787) | TCGA-AN-A046-01 | Breast | breast invasive carcinoma | Female | >=65 | I/II | Unknown | Unknown | SD |
| PALLD | SNV | Missense_Mutation | novel | c.1981N>T | p.Ala661Ser | p.A661S | Q8WX93 | protein_coding | tolerated(0.8) | benign(0) | TCGA-AR-A24O-01 | Breast | breast invasive carcinoma | Female | <65 | III/IV | Chemotherapy | cytoxan | PD |
| PALLD | SNV | Missense_Mutation | rs780911413 | c.427N>T | p.Arg143Cys | p.R143C | Q8WX93 | protein_coding | deleterious(0.03) | benign(0) | TCGA-E2-A15M-01 | Breast | breast invasive carcinoma | Female | >=65 | I/II | Hormone Therapy | arimidex | SD |
| PALLD | SNV | Missense_Mutation | rs758309395 | c.1829N>T | p.Thr610Met | p.T610M | Q8WX93 | protein_coding | deleterious(0.04) | possibly_damaging(0.65) | TCGA-E9-A1RF-01 | Breast | breast invasive carcinoma | Female | >=65 | III/IV | Hormone Therapy | tamoxiphen | SD |
| PALLD | SNV | Missense_Mutation | novel | c.3349N>T | p.Asp1117Tyr | p.D1117Y | Q8WX93 | protein_coding | deleterious(0) | probably_damaging(1) | TCGA-PL-A8LY-01 | Breast | breast invasive carcinoma | Female | <65 | I/II | Unknown | Unknown | SD |
| PALLD | SNV | Missense_Mutation | novel | c.407G>A | p.Ser136Asn | p.S136N | Q8WX93 | protein_coding | tolerated(0.18) | possibly_damaging(0.537) | TCGA-2W-A8YY-01 | Cervix | cervical & endocervical cancer | Female | <65 | I/II | Chemotherapy | cisplatin | CR |


