
|
|||||
|
 | |
| |
| |
| |
| |
| |
|
Gene: PABPC1 |
Gene summary for PABPC1 |
| Gene information | Species | Human | Gene symbol | PABPC1 | Gene ID | 26986 |
| Gene name | poly(A) binding protein cytoplasmic 1 | |
| Gene Alias | PAB1 | |
| Cytomap | 8q22.3 | |
| Gene Type | protein-coding | GO ID | GO:0000184 | UniProtAcc | A0A024R9C1 |
Top |
Malignant transformation analysis |
| Identification of the aberrant gene expression in precancerous and cancerous lesions by comparing the gene expression of stem-like cells in diseased tissues with normal stem cells |
| Entrez ID | Symbol | Replicates | Species | Organ | Tissue | Adj P-value | Log2FC | Malignancy |
| 26986 | PABPC1 | GSM4909281 | Human | Breast | IDC | 4.94e-39 | 4.02e-01 | 0.21 |
| 26986 | PABPC1 | GSM4909286 | Human | Breast | IDC | 2.58e-44 | 4.36e-01 | 0.1081 |
| 26986 | PABPC1 | GSM4909287 | Human | Breast | IDC | 4.18e-06 | 3.94e-02 | 0.2057 |
| 26986 | PABPC1 | GSM4909288 | Human | Breast | IDC | 1.09e-03 | -2.69e-01 | 0.0988 |
| 26986 | PABPC1 | GSM4909290 | Human | Breast | IDC | 3.53e-03 | 1.90e-01 | 0.2096 |
| 26986 | PABPC1 | GSM4909291 | Human | Breast | IDC | 1.22e-13 | 3.46e-01 | 0.1753 |
| 26986 | PABPC1 | GSM4909293 | Human | Breast | IDC | 6.64e-03 | -1.15e-01 | 0.1581 |
| 26986 | PABPC1 | GSM4909294 | Human | Breast | IDC | 1.30e-14 | -3.35e-01 | 0.2022 |
| 26986 | PABPC1 | GSM4909296 | Human | Breast | IDC | 1.23e-05 | -1.23e-01 | 0.1524 |
| 26986 | PABPC1 | GSM4909297 | Human | Breast | IDC | 2.55e-29 | -3.26e-01 | 0.1517 |
| 26986 | PABPC1 | GSM4909301 | Human | Breast | IDC | 2.64e-25 | -6.07e-01 | 0.1577 |
| 26986 | PABPC1 | GSM4909302 | Human | Breast | IDC | 8.56e-22 | -5.49e-01 | 0.1545 |
| 26986 | PABPC1 | GSM4909304 | Human | Breast | IDC | 1.16e-04 | -1.86e-01 | 0.1636 |
| 26986 | PABPC1 | GSM4909307 | Human | Breast | IDC | 1.54e-19 | -4.95e-01 | 0.1569 |
| 26986 | PABPC1 | GSM4909308 | Human | Breast | IDC | 2.11e-11 | -2.09e-01 | 0.158 |
| 26986 | PABPC1 | GSM4909309 | Human | Breast | IDC | 3.50e-17 | -5.02e-01 | 0.0483 |
| 26986 | PABPC1 | GSM4909311 | Human | Breast | IDC | 1.15e-54 | 1.12e-01 | 0.1534 |
| 26986 | PABPC1 | GSM4909312 | Human | Breast | IDC | 2.17e-29 | 3.48e-01 | 0.1552 |
| 26986 | PABPC1 | GSM4909315 | Human | Breast | IDC | 2.08e-38 | -7.79e-01 | 0.21 |
| 26986 | PABPC1 | GSM4909316 | Human | Breast | IDC | 5.34e-13 | -6.98e-01 | 0.21 |
| Page: 1 2 3 4 5 6 7 8 9 10 11 12 13 14 15 16 17 18 19 20 |
| Tissue | Expression Dynamics | Abbreviation |
| Breast | 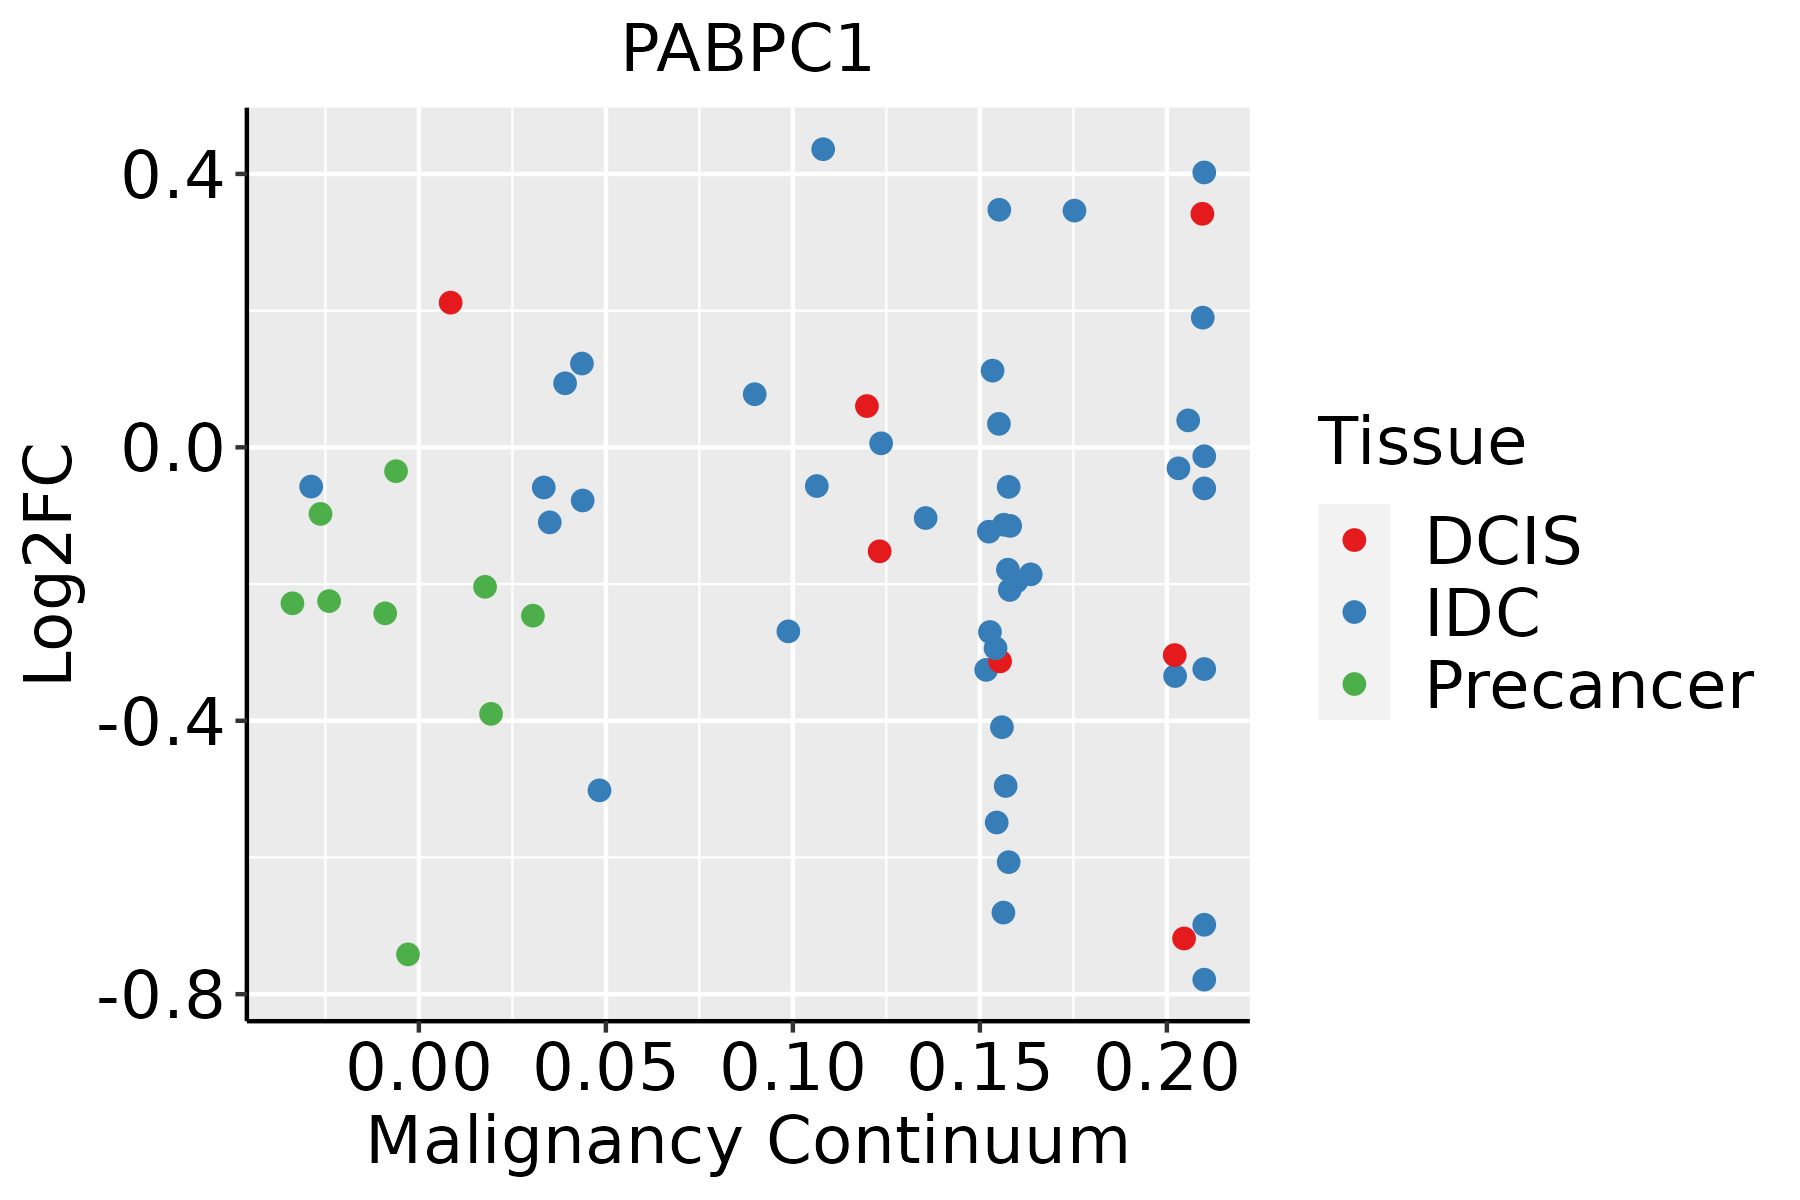 | IDC: Invasive ductal carcinoma |
| DCIS: Ductal carcinoma in situ | ||
| Precancer(BRCA1-mut): Precancerous lesion from BRCA1 mutation carriers | ||
| Cervix |  | CC: Cervix cancer |
| HSIL_HPV: HPV-infected high-grade squamous intraepithelial lesions | ||
| N_HPV: HPV-infected normal cervix | ||
| Colorectum (GSE201348) |  | FAP: Familial adenomatous polyposis |
| CRC: Colorectal cancer | ||
| Colorectum (HTA11) |  | AD: Adenomas |
| SER: Sessile serrated lesions | ||
| MSI-H: Microsatellite-high colorectal cancer | ||
| MSS: Microsatellite stable colorectal cancer | ||
| Endometrium | 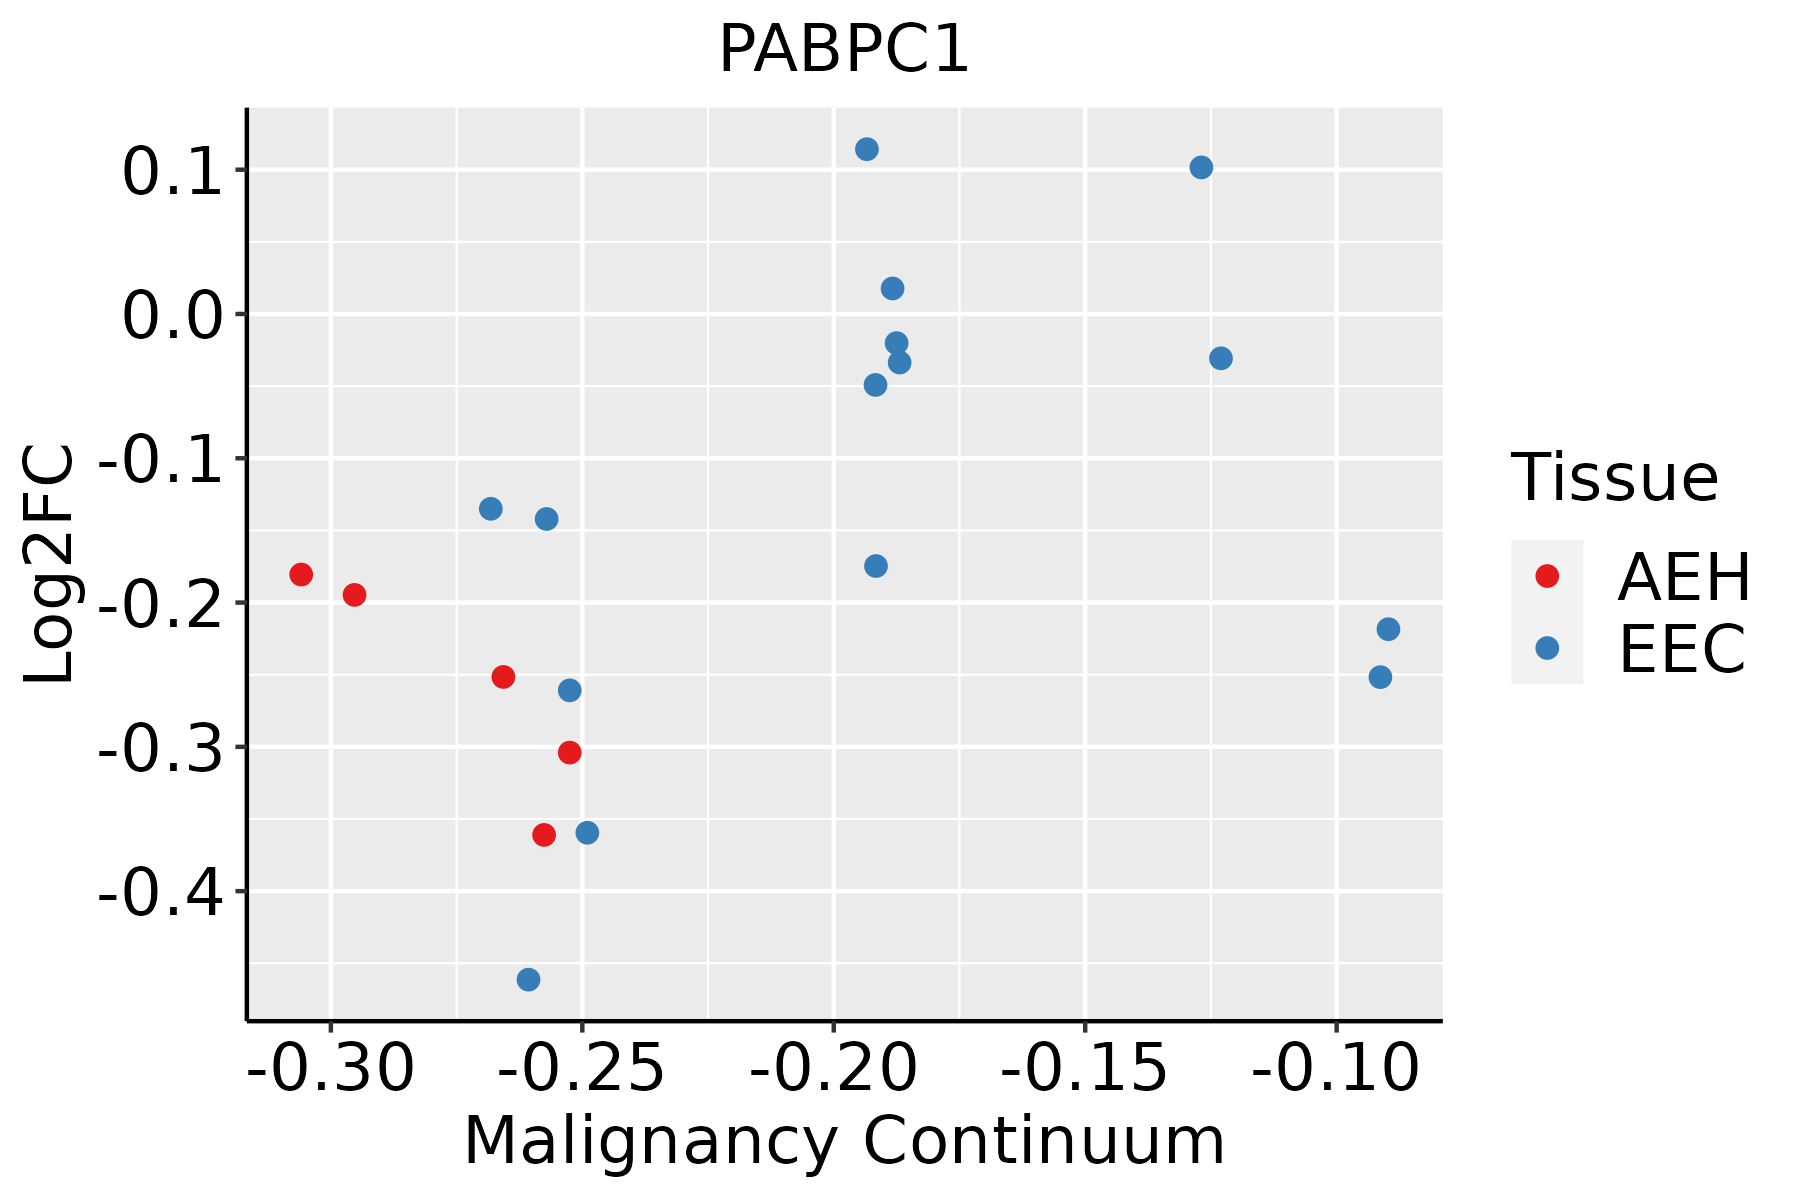 | AEH: Atypical endometrial hyperplasia |
| EEC: Endometrioid Cancer | ||
| Esophagus | 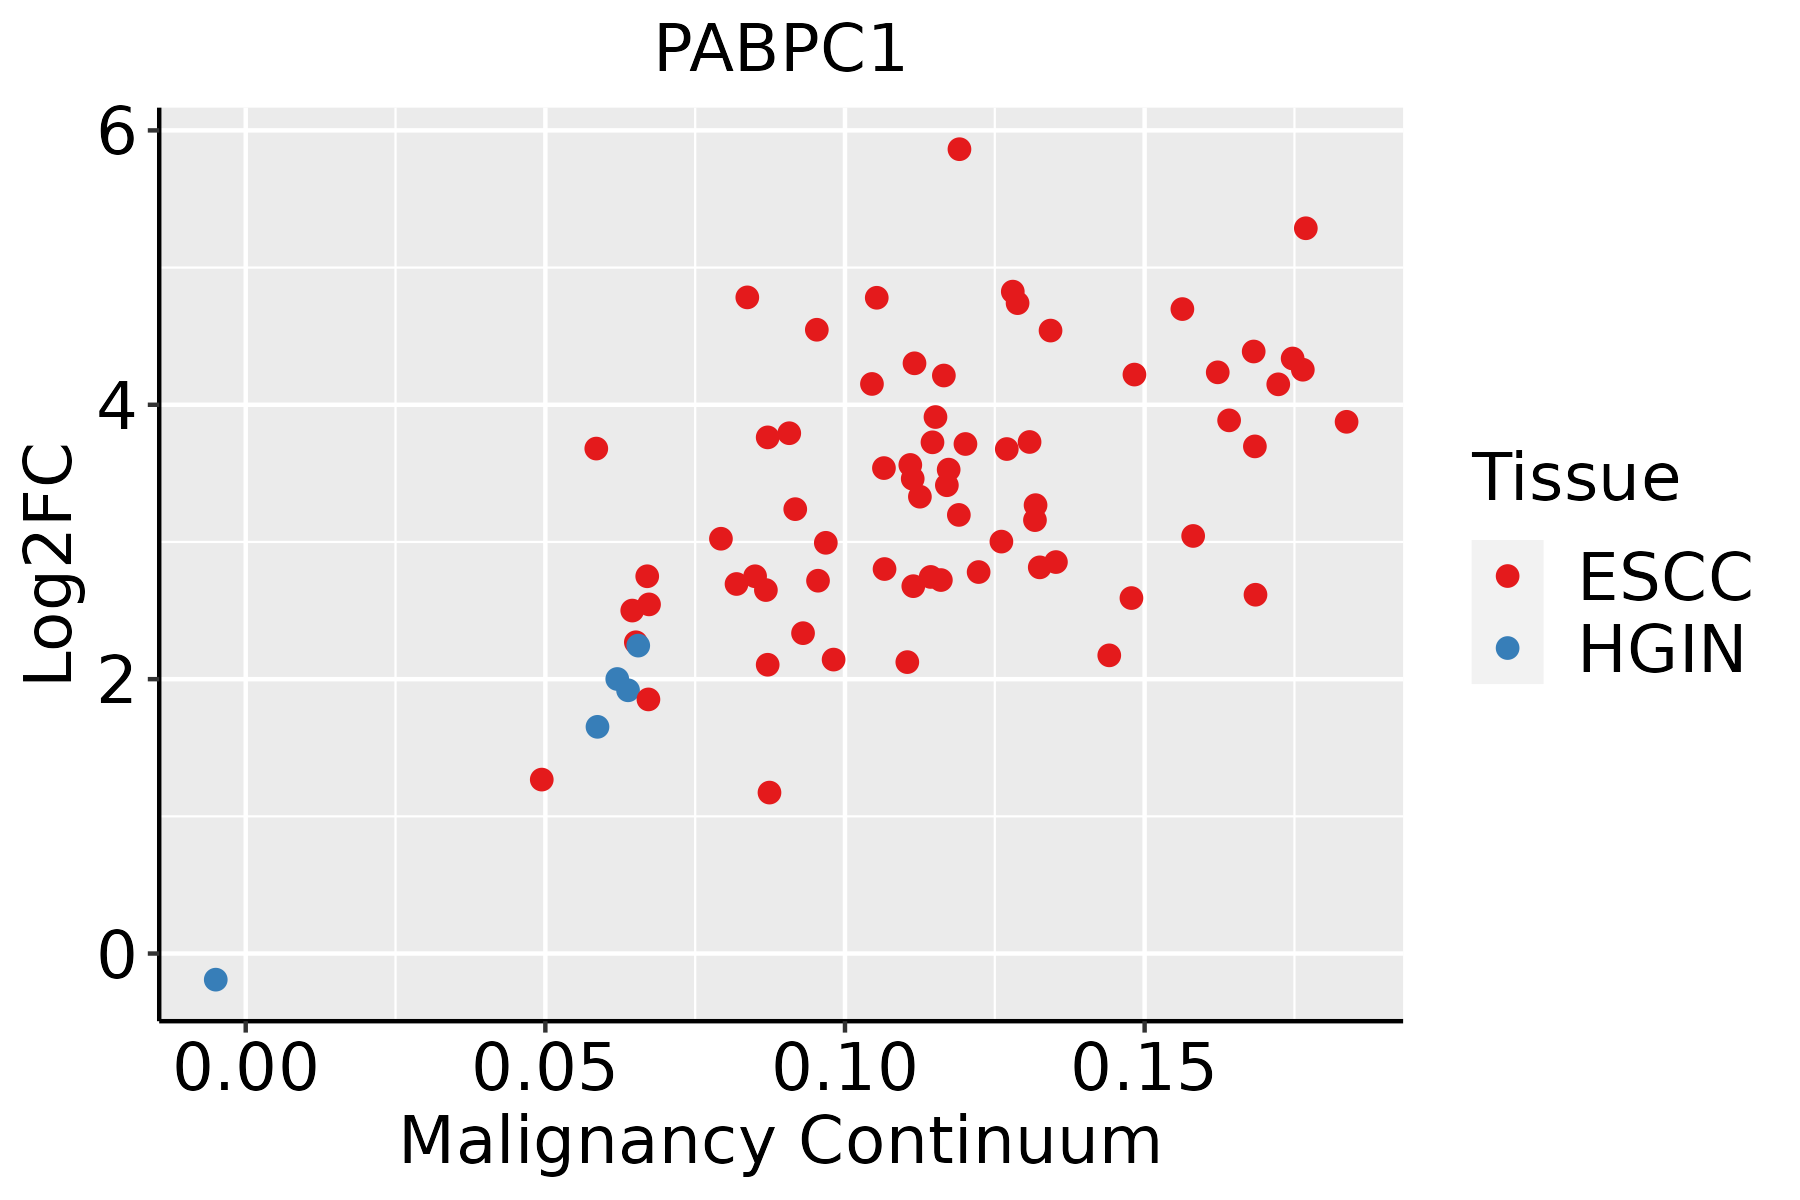 | ESCC: Esophageal squamous cell carcinoma |
| HGIN: High-grade intraepithelial neoplasias | ||
| LGIN: Low-grade intraepithelial neoplasias | ||
| GC | 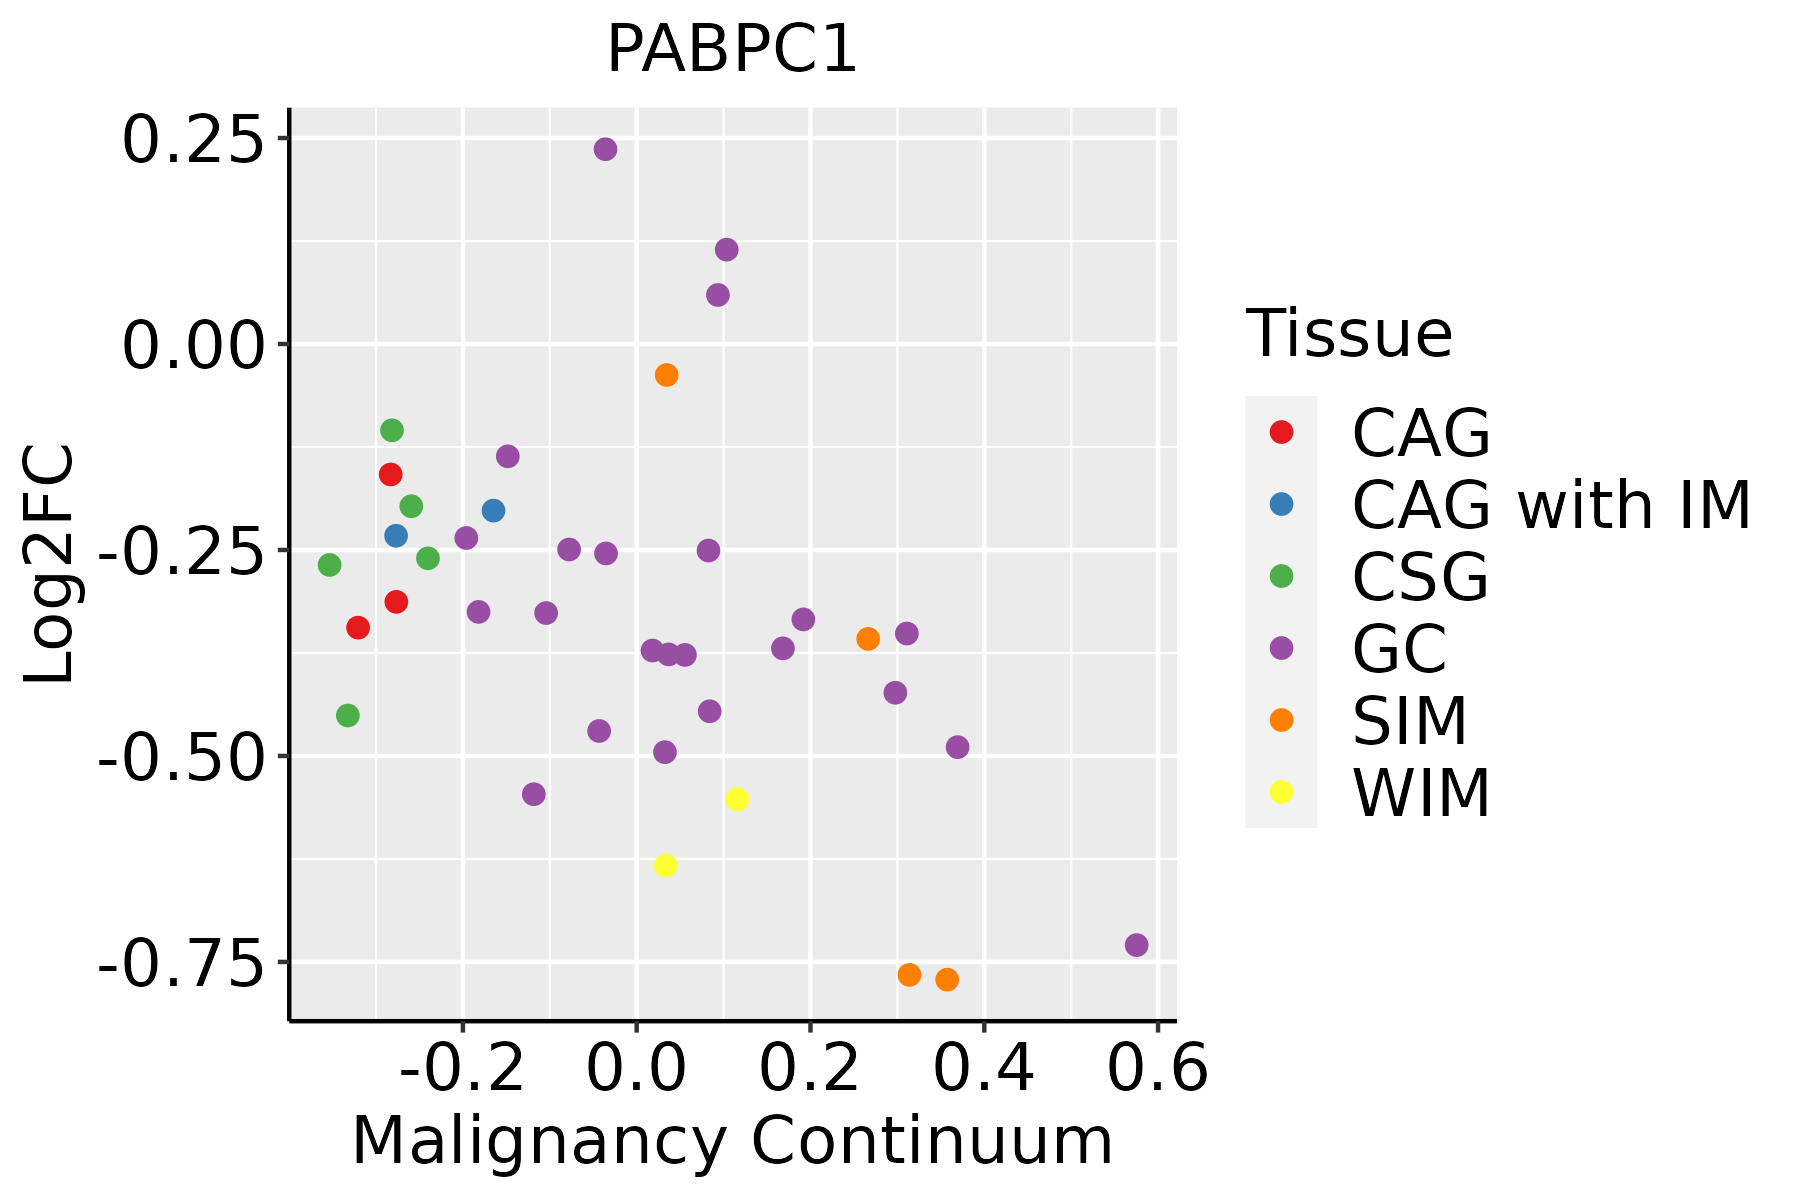 | CAG: Chronic atrophic gastritis |
| CAG with IM: Chronic atrophic gastritis with intestinal metaplasia | ||
| CSG: Chronic superficial gastritis | ||
| GC: Gastric cancer | ||
| SIM: Severe intestinal metaplasia | ||
| WIM: Wild intestinal metaplasia | ||
| Liver | 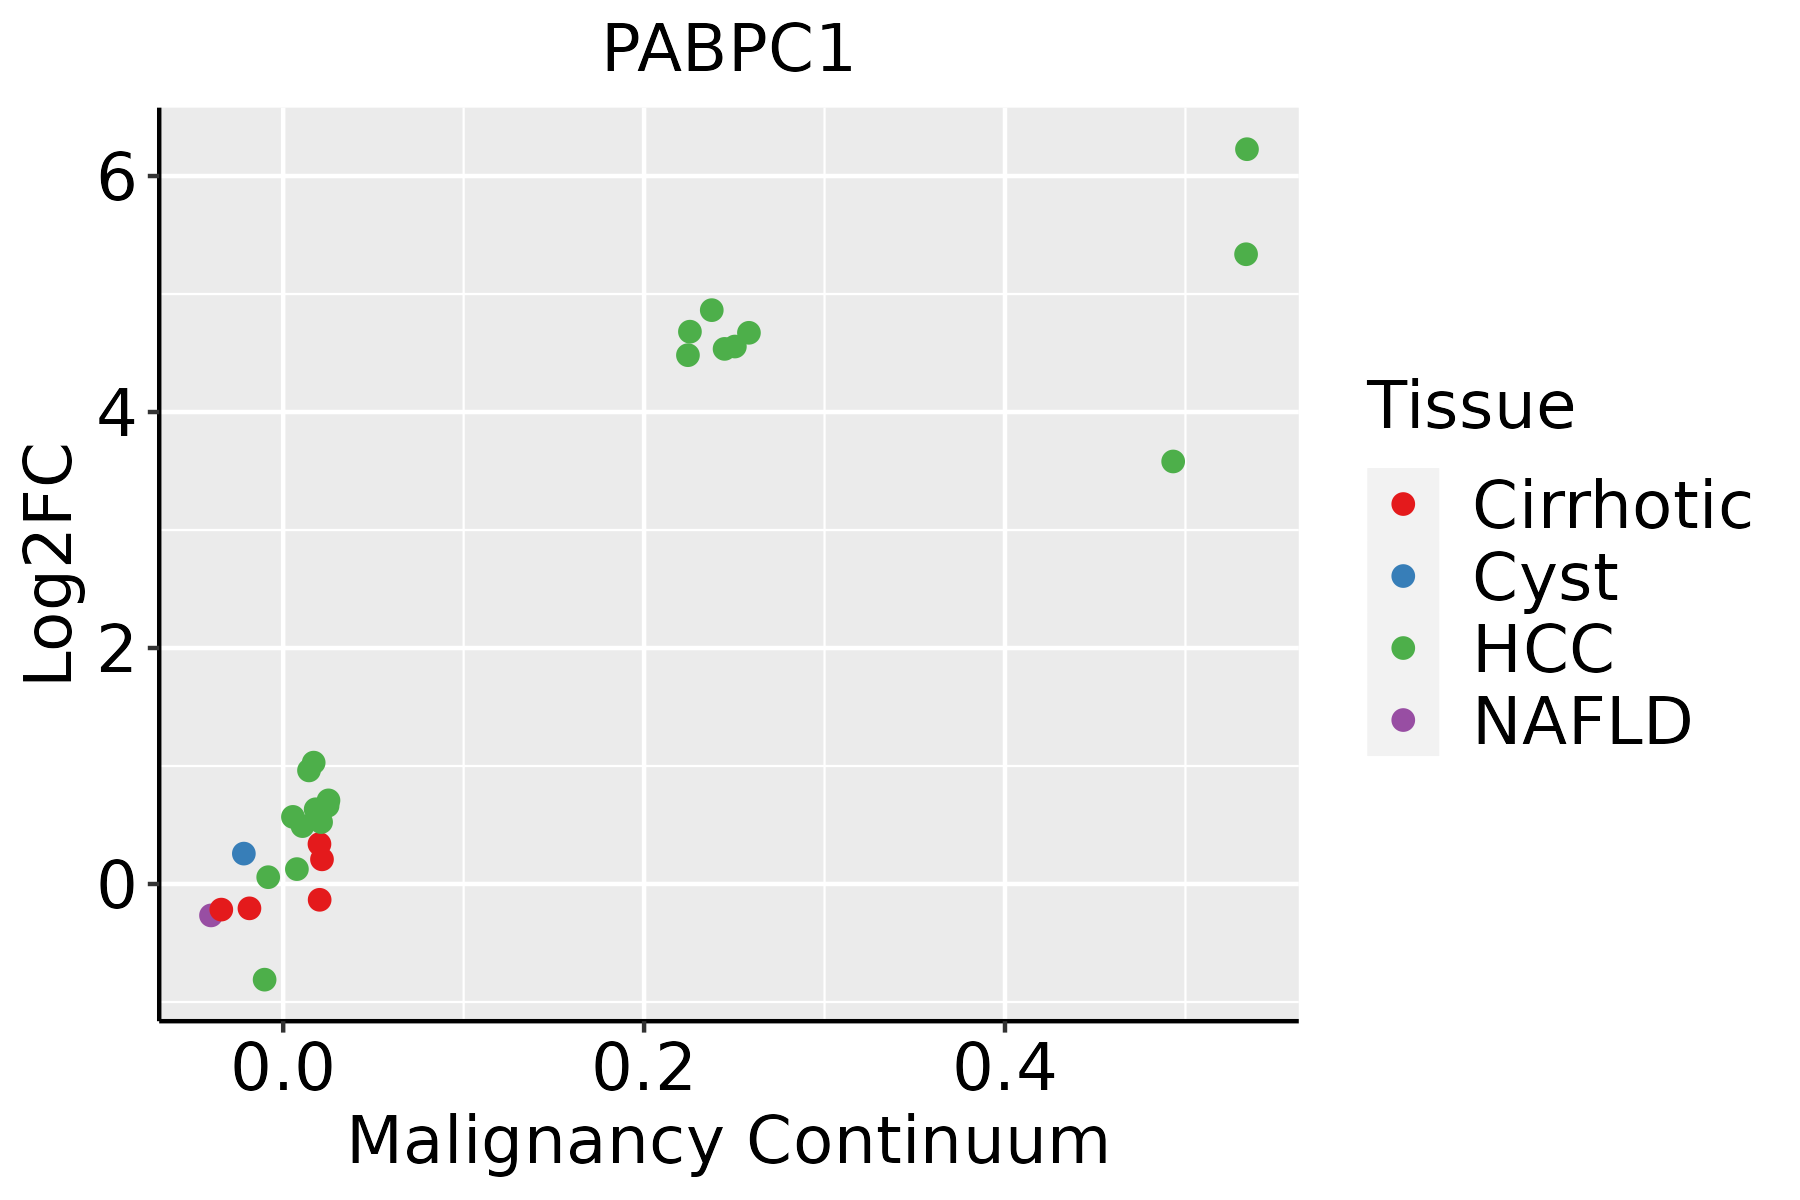 | HCC: Hepatocellular carcinoma |
| NAFLD: Non-alcoholic fatty liver disease | ||
| Lung | 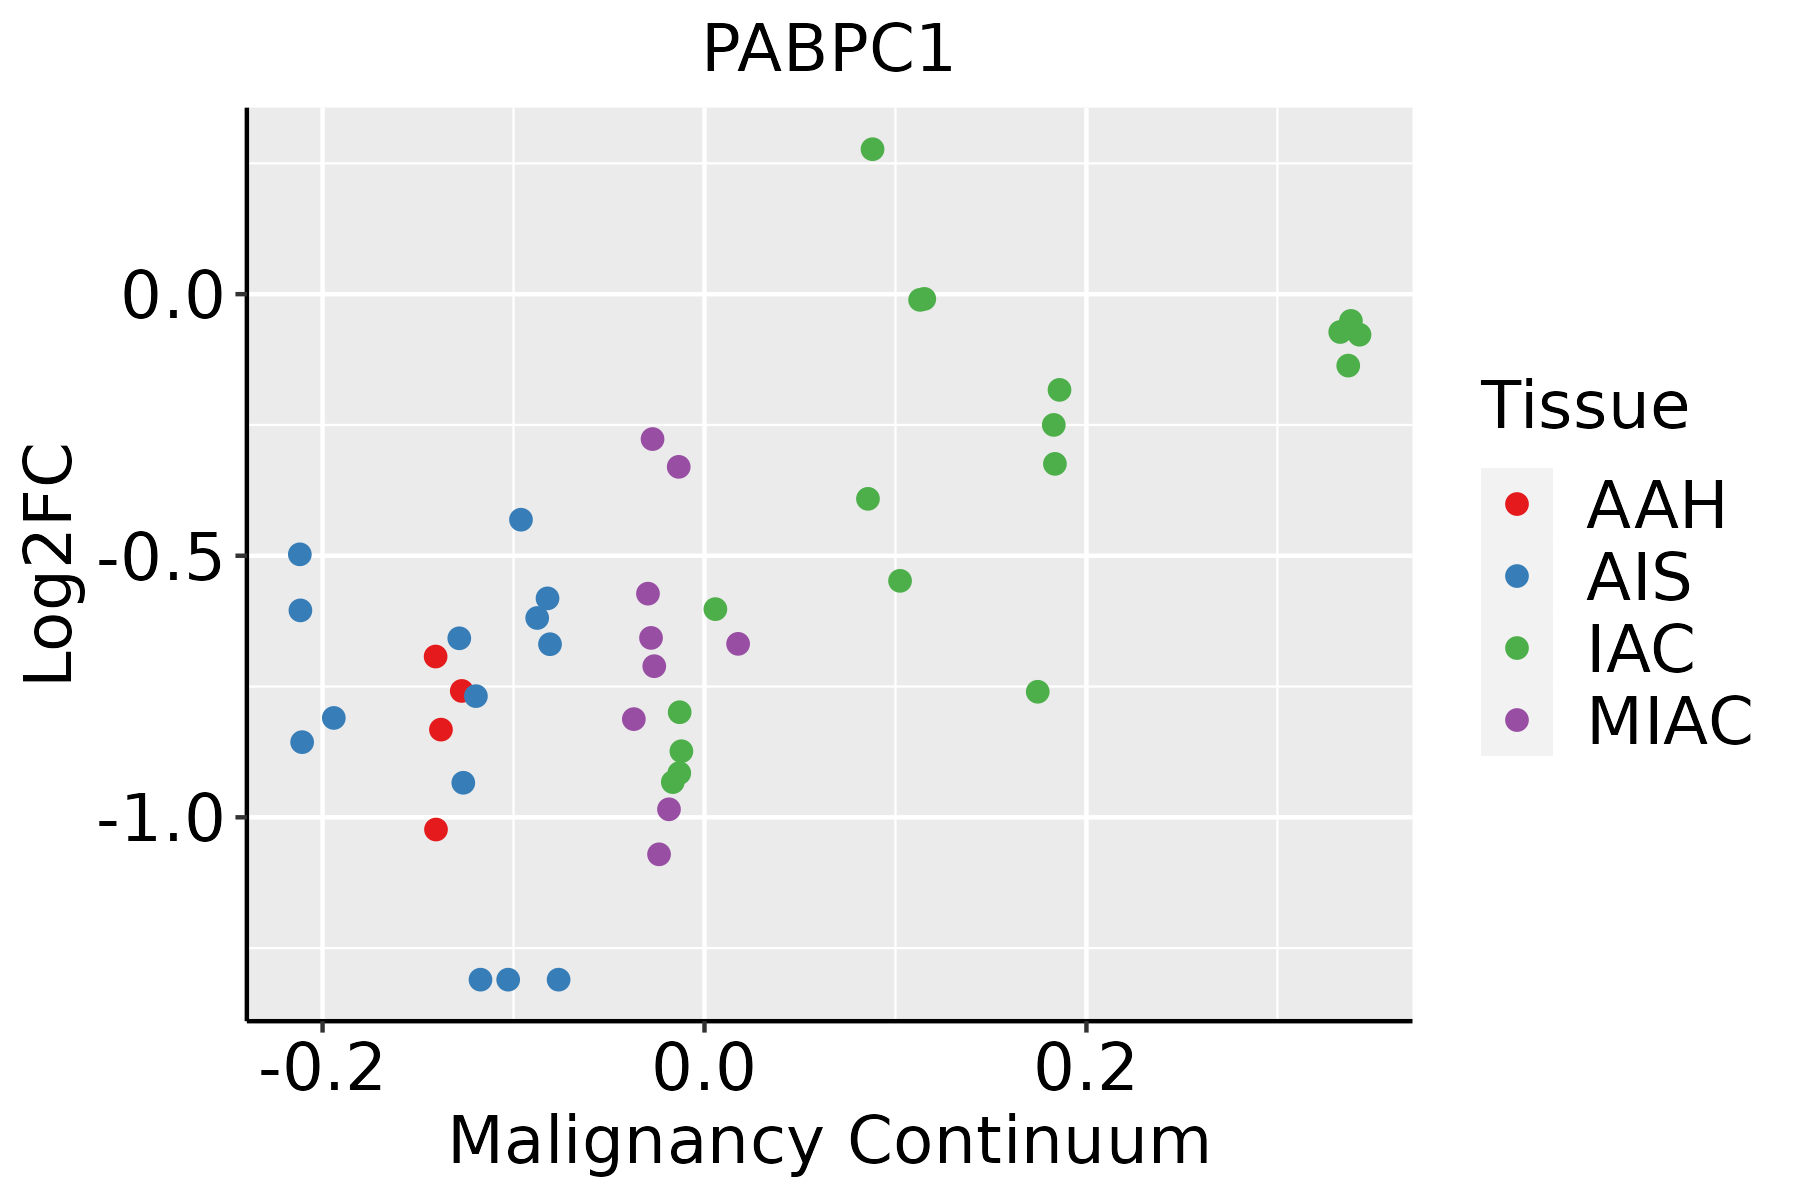 | AAH: Atypical adenomatous hyperplasia |
| AIS: Adenocarcinoma in situ | ||
| IAC: Invasive lung adenocarcinoma | ||
| MIA: Minimally invasive adenocarcinoma | ||
| Oral Cavity | 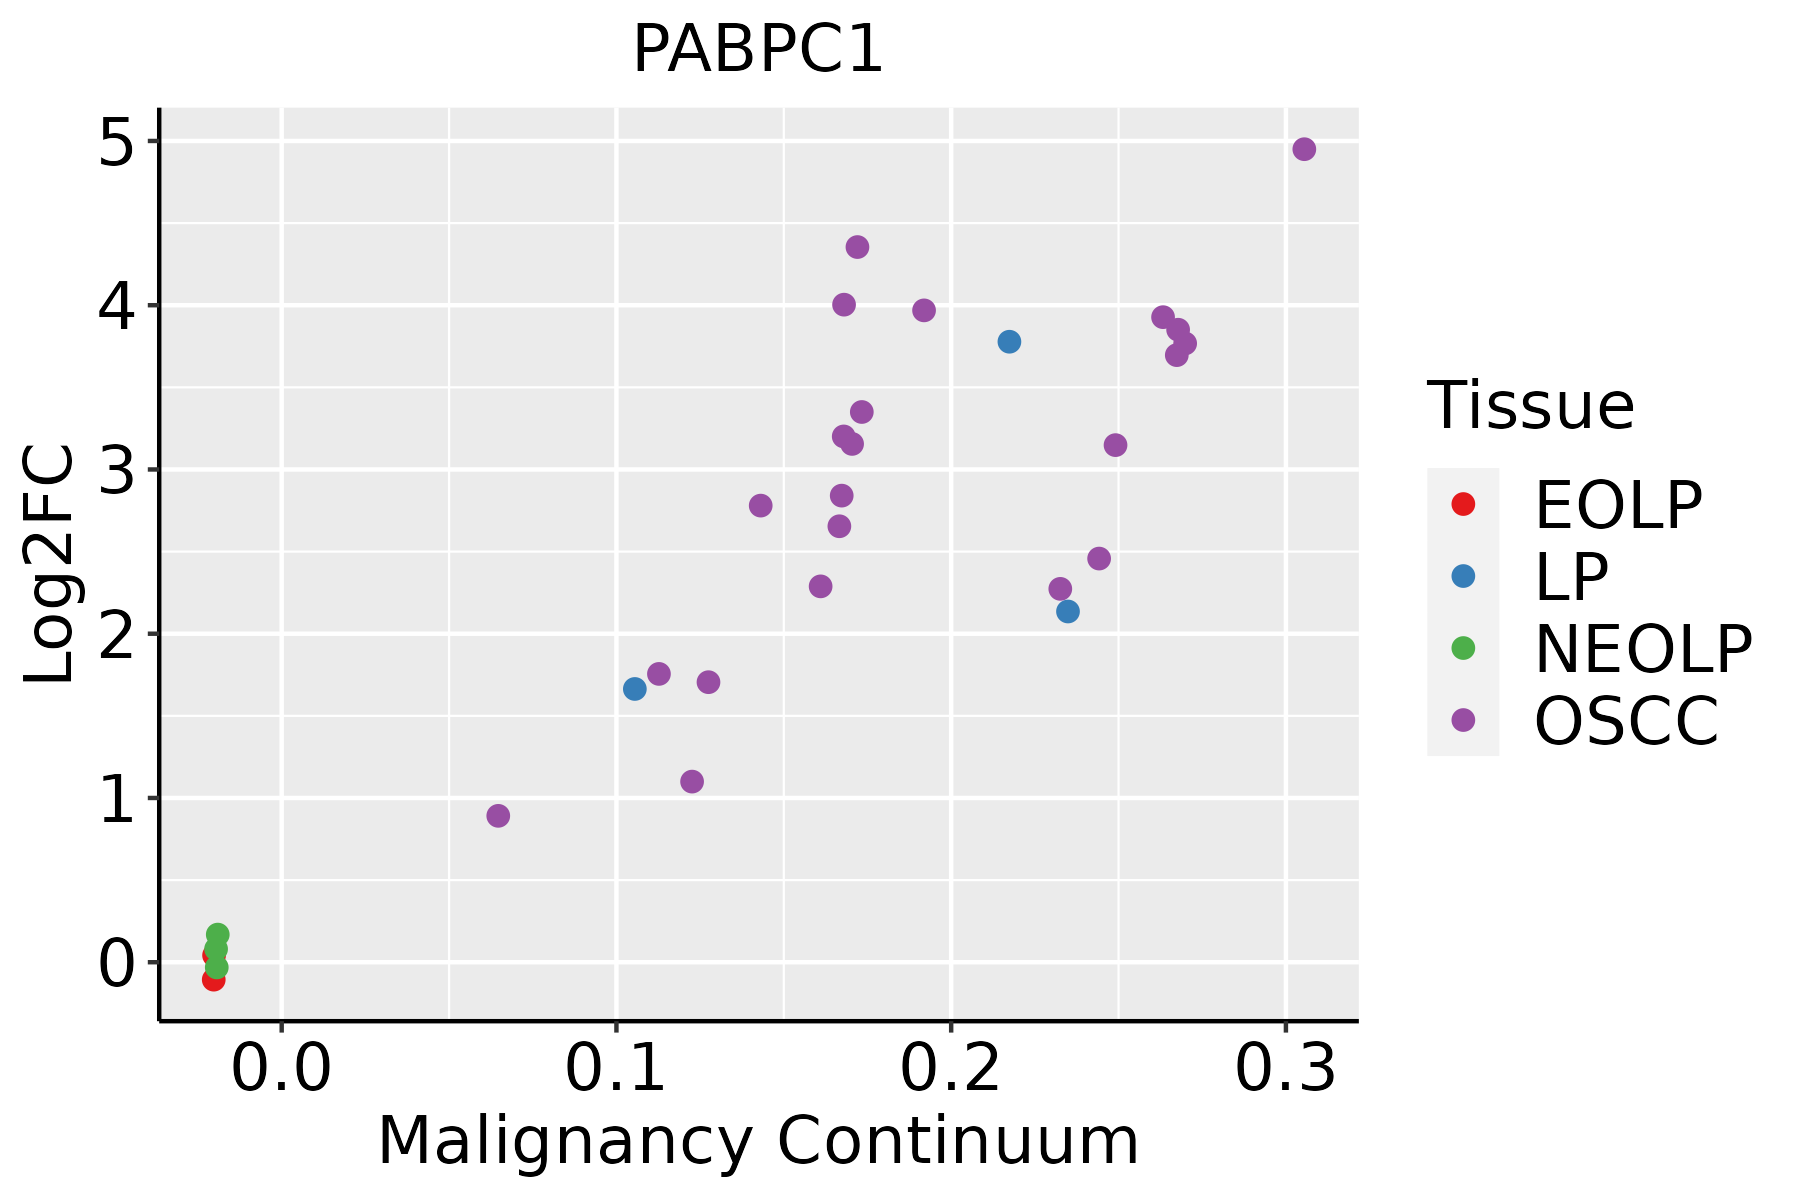 | EOLP: Erosive Oral lichen planus |
| LP: leukoplakia | ||
| NEOLP: Non-erosive oral lichen planus | ||
| OSCC: Oral squamous cell carcinoma | ||
| Prostate | 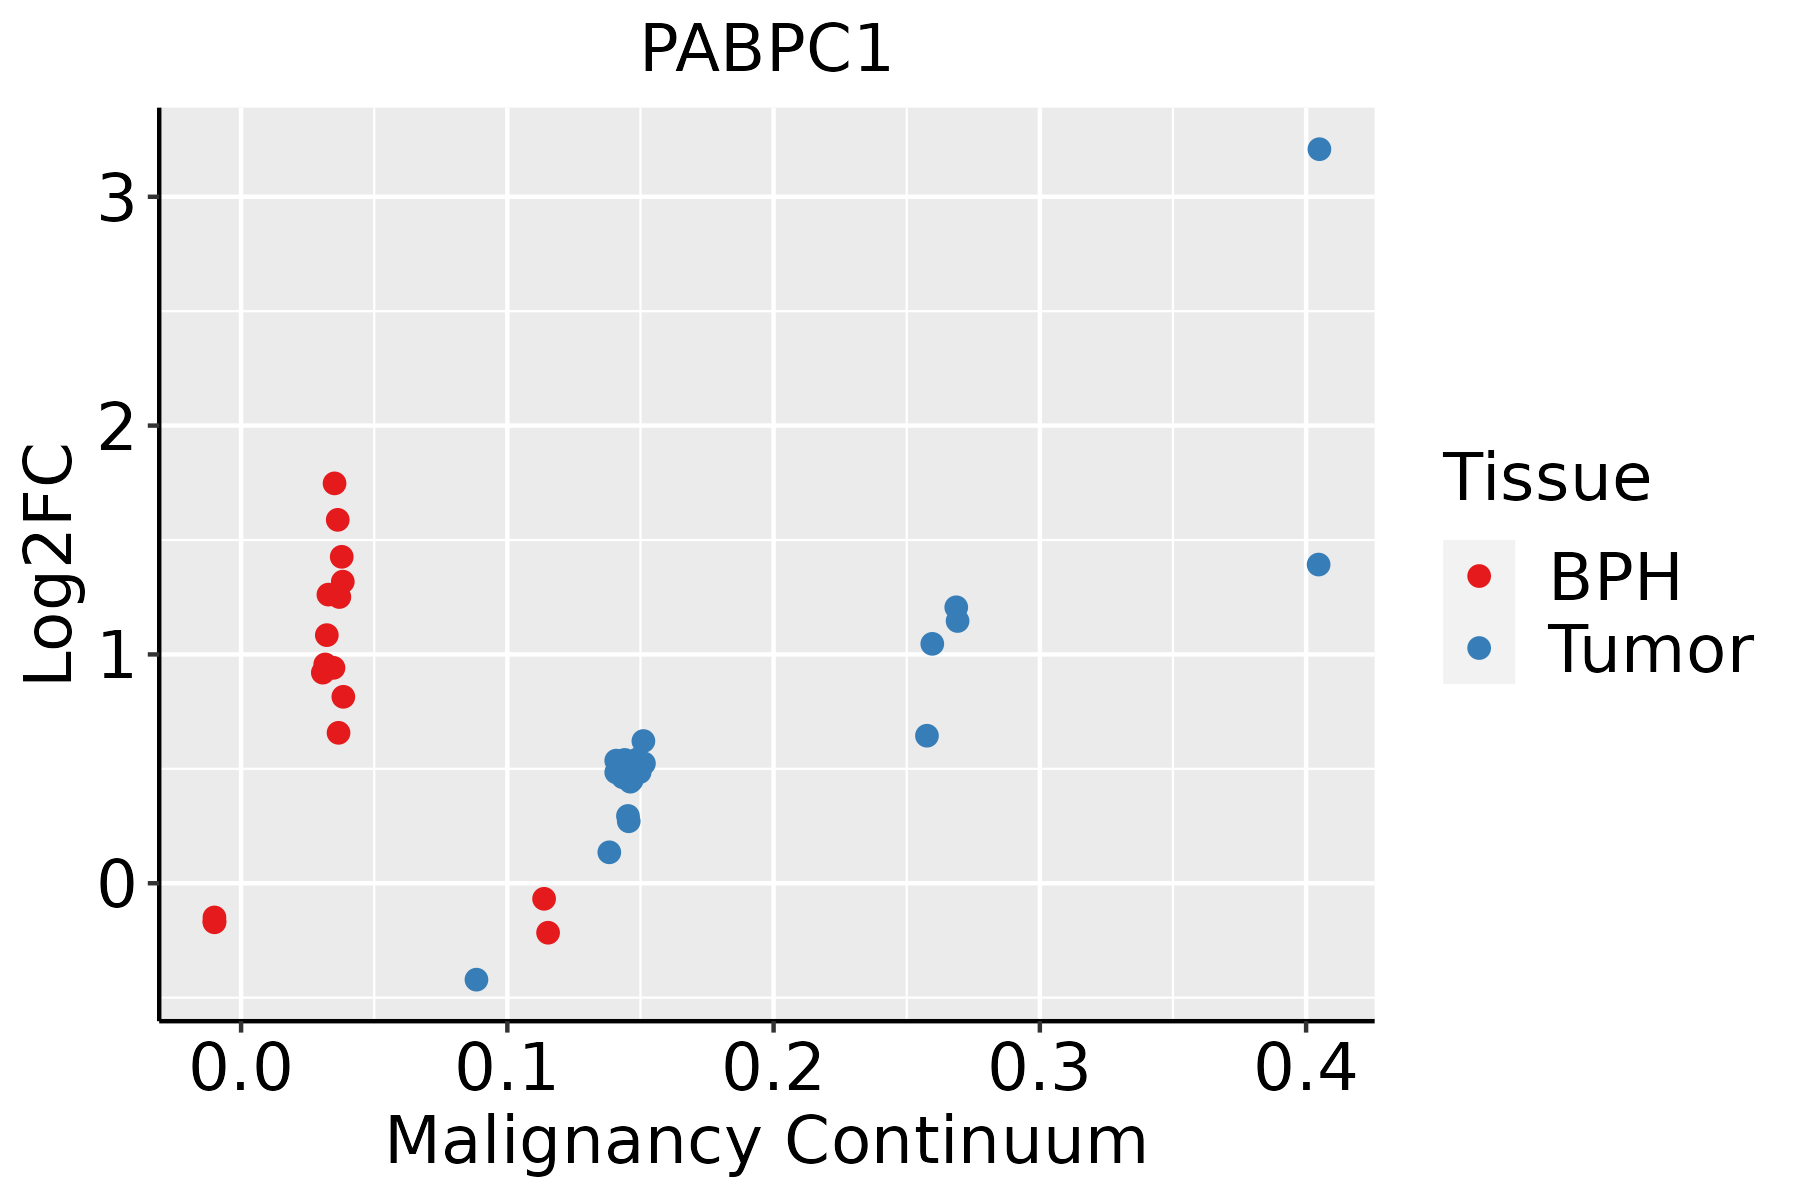 | BPH: Benign Prostatic Hyperplasia |
| Skin | 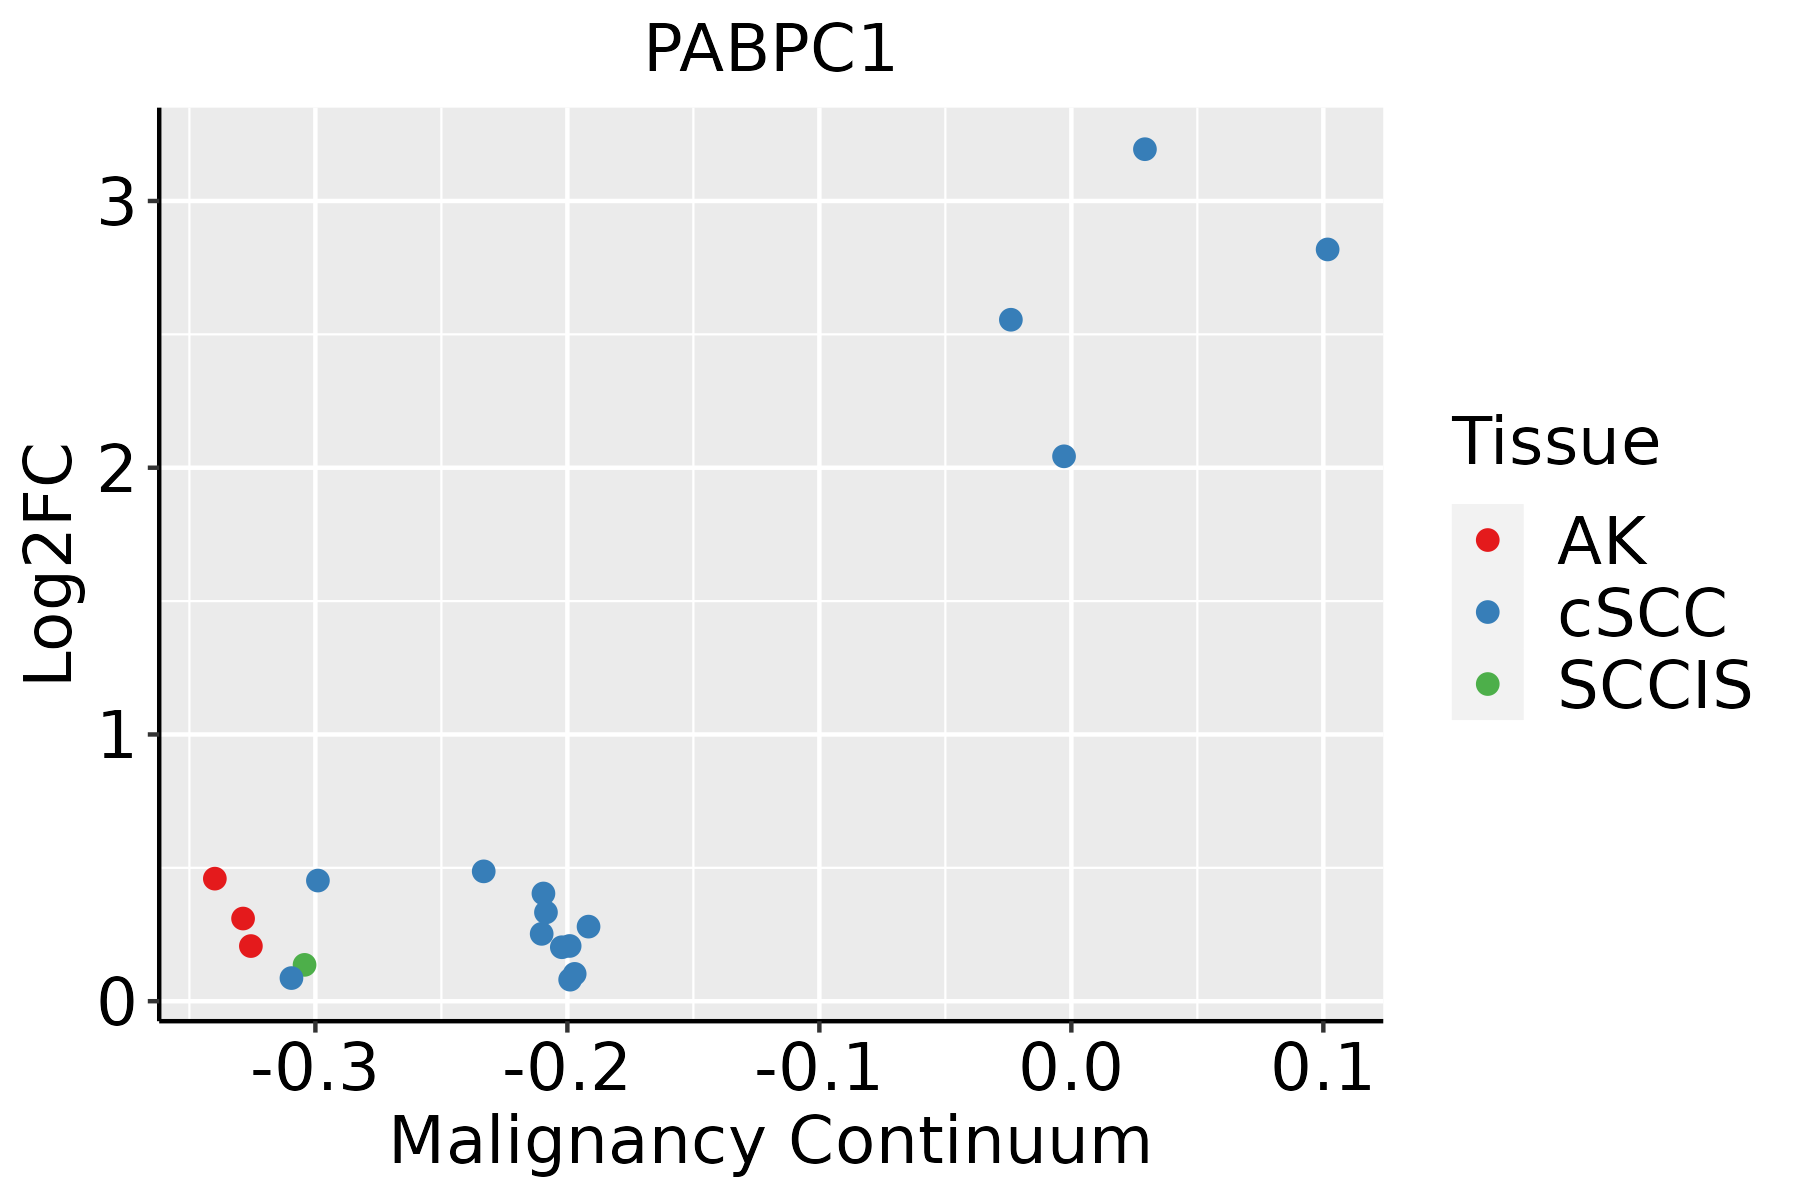 | AK: Actinic keratosis |
| cSCC: Cutaneous squamous cell carcinoma | ||
| SCCIS:squamous cell carcinoma in situ | ||
| Thyroid |  | ATC: Anaplastic thyroid cancer |
| HT: Hashimoto's thyroiditis | ||
| PTC: Papillary thyroid cancer |
| ∗log2FC in expression of this searched gene in stem-like cells from each diseased tissue sample relative to stem-like cells in normal samples in each tissue plotted against the malignancy continuum. Samples are colored based on if they are from different disease stage. |
Top |
Malignant transformation related pathway analysis |
| Find out the enriched GO biological processes and KEGG pathways involved in transition from healthy to precancer to cancer |
| Tissue | Disease Stage | Enriched GO biological Processes |
| Colorectum | AD |  |
| Colorectum | SER |  |
| Colorectum | MSS |  |
| Colorectum | MSI-H |  |
| Colorectum | FAP |  |
| ∗Top 15 enriched GO BP terms are showed in the bar plot of each disease state in each tissue. Each row represents a significant GO biological process which is colored according to the -log10(p.adjust). |
| Page: 1 2 3 4 5 6 7 8 9 |
| GO ID | Tissue | Disease Stage | Description | Gene Ratio | Bg Ratio | pvalue | p.adjust | Count |
| GO:003425023 | Breast | DCIS | positive regulation of cellular amide metabolic process | 34/1390 | 162/18723 | 2.60e-08 | 1.73e-06 | 34 |
| GO:005079222 | Breast | DCIS | regulation of viral process | 34/1390 | 164/18723 | 3.58e-08 | 2.30e-06 | 34 |
| GO:190390022 | Breast | DCIS | regulation of viral life cycle | 28/1390 | 148/18723 | 3.79e-06 | 1.16e-04 | 28 |
| GO:004852421 | Breast | DCIS | positive regulation of viral process | 16/1390 | 65/18723 | 1.56e-05 | 3.79e-04 | 16 |
| GO:004506923 | Breast | DCIS | regulation of viral genome replication | 18/1390 | 85/18723 | 4.23e-05 | 8.98e-04 | 18 |
| GO:000989624 | Breast | DCIS | positive regulation of catabolic process | 61/1390 | 492/18723 | 5.32e-05 | 1.09e-03 | 61 |
| GO:003133124 | Breast | DCIS | positive regulation of cellular catabolic process | 54/1390 | 427/18723 | 8.34e-05 | 1.58e-03 | 54 |
| GO:190331123 | Breast | DCIS | regulation of mRNA metabolic process | 40/1390 | 288/18723 | 9.26e-05 | 1.71e-03 | 40 |
| GO:003133024 | Breast | DCIS | negative regulation of cellular catabolic process | 37/1390 | 262/18723 | 1.18e-04 | 2.07e-03 | 37 |
| GO:006021322 | Breast | DCIS | positive regulation of nuclear-transcribed mRNA poly(A) tail shortening | 6/1390 | 13/18723 | 1.80e-04 | 2.96e-03 | 6 |
| GO:000640123 | Breast | DCIS | RNA catabolic process | 38/1390 | 278/18723 | 1.91e-04 | 3.08e-03 | 38 |
| GO:000640223 | Breast | DCIS | mRNA catabolic process | 33/1390 | 232/18723 | 2.35e-04 | 3.70e-03 | 33 |
| GO:006021121 | Breast | DCIS | regulation of nuclear-transcribed mRNA poly(A) tail shortening | 6/1390 | 15/18723 | 4.62e-04 | 6.12e-03 | 6 |
| GO:190015321 | Breast | DCIS | positive regulation of nuclear-transcribed mRNA catabolic process, deadenylation-dependent decay | 6/1390 | 15/18723 | 4.62e-04 | 6.12e-03 | 6 |
| GO:000989524 | Breast | DCIS | negative regulation of catabolic process | 40/1390 | 320/18723 | 8.29e-04 | 9.46e-03 | 40 |
| GO:190331224 | Breast | DCIS | negative regulation of mRNA metabolic process | 16/1390 | 92/18723 | 1.13e-03 | 1.22e-02 | 16 |
| GO:004507012 | Breast | DCIS | positive regulation of viral genome replication | 8/1390 | 30/18723 | 1.21e-03 | 1.28e-02 | 8 |
| GO:190015122 | Breast | DCIS | regulation of nuclear-transcribed mRNA catabolic process, deadenylation-dependent decay | 6/1390 | 18/18723 | 1.41e-03 | 1.45e-02 | 6 |
| GO:000095622 | Breast | DCIS | nuclear-transcribed mRNA catabolic process | 18/1390 | 112/18723 | 1.48e-03 | 1.50e-02 | 18 |
| GO:003465522 | Breast | DCIS | nucleobase-containing compound catabolic process | 47/1390 | 407/18723 | 1.69e-03 | 1.68e-02 | 47 |
| Page: 1 2 3 4 5 6 7 8 9 10 11 12 13 14 15 16 17 18 19 20 21 22 23 24 25 26 27 28 29 30 31 32 33 34 35 36 37 38 39 40 41 42 43 44 45 46 47 48 49 50 51 52 53 54 55 56 57 58 59 60 61 62 63 64 65 66 67 68 69 70 71 72 73 |
| Pathway ID | Tissue | Disease Stage | Description | Gene Ratio | Bg Ratio | pvalue | p.adjust | qvalue | Count |
| hsa030186 | Breast | Precancer | RNA degradation | 14/684 | 79/8465 | 3.97e-03 | 2.37e-02 | 1.81e-02 | 14 |
| hsa0301811 | Breast | Precancer | RNA degradation | 14/684 | 79/8465 | 3.97e-03 | 2.37e-02 | 1.81e-02 | 14 |
| hsa0301821 | Breast | IDC | RNA degradation | 16/867 | 79/8465 | 5.65e-03 | 3.13e-02 | 2.34e-02 | 16 |
| hsa0301831 | Breast | IDC | RNA degradation | 16/867 | 79/8465 | 5.65e-03 | 3.13e-02 | 2.34e-02 | 16 |
| hsa030184 | Breast | DCIS | RNA degradation | 16/846 | 79/8465 | 4.45e-03 | 2.46e-02 | 1.82e-02 | 16 |
| hsa030185 | Breast | DCIS | RNA degradation | 16/846 | 79/8465 | 4.45e-03 | 2.46e-02 | 1.82e-02 | 16 |
| hsa03015 | Colorectum | AD | mRNA surveillance pathway | 35/2092 | 97/8465 | 7.95e-03 | 3.13e-02 | 2.00e-02 | 35 |
| hsa030151 | Colorectum | AD | mRNA surveillance pathway | 35/2092 | 97/8465 | 7.95e-03 | 3.13e-02 | 2.00e-02 | 35 |
| hsa030152 | Colorectum | FAP | mRNA surveillance pathway | 26/1404 | 97/8465 | 7.11e-03 | 2.64e-02 | 1.60e-02 | 26 |
| hsa030153 | Colorectum | FAP | mRNA surveillance pathway | 26/1404 | 97/8465 | 7.11e-03 | 2.64e-02 | 1.60e-02 | 26 |
| hsa030187 | Endometrium | EEC | RNA degradation | 20/1237 | 79/8465 | 8.36e-03 | 3.88e-02 | 2.89e-02 | 20 |
| hsa0301812 | Endometrium | EEC | RNA degradation | 20/1237 | 79/8465 | 8.36e-03 | 3.88e-02 | 2.89e-02 | 20 |
| hsa0301810 | Esophagus | HGIN | RNA degradation | 27/1383 | 79/8465 | 7.73e-05 | 9.00e-04 | 7.15e-04 | 27 |
| hsa0301815 | Esophagus | HGIN | RNA degradation | 27/1383 | 79/8465 | 7.73e-05 | 9.00e-04 | 7.15e-04 | 27 |
| hsa0301824 | Esophagus | ESCC | RNA degradation | 62/4205 | 79/8465 | 1.18e-07 | 9.39e-07 | 4.81e-07 | 62 |
| hsa0301524 | Esophagus | ESCC | mRNA surveillance pathway | 72/4205 | 97/8465 | 6.12e-07 | 4.10e-06 | 2.10e-06 | 72 |
| hsa0301834 | Esophagus | ESCC | RNA degradation | 62/4205 | 79/8465 | 1.18e-07 | 9.39e-07 | 4.81e-07 | 62 |
| hsa0301534 | Esophagus | ESCC | mRNA surveillance pathway | 72/4205 | 97/8465 | 6.12e-07 | 4.10e-06 | 2.10e-06 | 72 |
| hsa03018 | Liver | Cirrhotic | RNA degradation | 44/2530 | 79/8465 | 1.43e-06 | 1.65e-05 | 1.02e-05 | 44 |
| hsa030154 | Liver | Cirrhotic | mRNA surveillance pathway | 46/2530 | 97/8465 | 1.92e-04 | 1.30e-03 | 8.03e-04 | 46 |
| Page: 1 2 3 |
Top |
Cell-cell communication analysis |
| Identification of potential cell-cell interactions between two cell types and their ligand-receptor pairs for different disease states |
| Ligand | Receptor | LRpair | Pathway | Tissue | Disease Stage |
| Page: 1 |
Top |
Single-cell gene regulatory network inference analysis |
| Find out the significant the regulons (TFs) and the target genes of each regulon across cell types for different disease states |
| TF | Cell Type | Tissue | Disease Stage | Target Gene | RSS | Regulon Activity |
| ∗The dot plots of a searched regulon are shown for all cell subpopulations in each disease state of each tissue based on the regulon specific score inferred using pySCENIC and by calculating the average expression. |
| Page: 1 |
Top |
Somatic mutation of malignant transformation related genes |
| Annotation of somatic variants for genes involved in malignant transformation |
| Hugo Symbol | Variant Class | Variant Classification | dbSNP RS | HGVSc | HGVSp | HGVSp Short | SWISSPROT | BIOTYPE | SIFT | PolyPhen | Tumor Sample Barcode | Tissue | Histology | Sex | Age | Stage | Therapy Types | Drugs | Outcome |
| PABPC1 | SNV | Missense_Mutation | c.1409N>T | p.Ser470Phe | p.S470F | P11940 | protein_coding | tolerated(0.09) | benign(0.042) | TCGA-A8-A0A7-01 | Breast | breast invasive carcinoma | Female | <65 | I/II | Unknown | Unknown | SD | |
| PABPC1 | SNV | Missense_Mutation | c.1635N>C | p.Leu545Phe | p.L545F | P11940 | protein_coding | deleterious(0) | probably_damaging(0.98) | TCGA-AN-A0AR-01 | Breast | breast invasive carcinoma | Female | <65 | I/II | Unknown | Unknown | SD | |
| PABPC1 | deletion | Frame_Shift_Del | novel | c.296delG | p.Gly99AlafsTer60 | p.G99Afs*60 | P11940 | protein_coding | TCGA-EW-A2FV-01 | Breast | breast invasive carcinoma | Female | <65 | III/IV | Chemotherapy | docetaxel | SD | ||
| PABPC1 | SNV | Missense_Mutation | c.833N>A | p.Arg278His | p.R278H | P11940 | protein_coding | tolerated(0.09) | benign(0.063) | TCGA-2W-A8YY-01 | Cervix | cervical & endocervical cancer | Female | <65 | I/II | Chemotherapy | cisplatin | CR | |
| PABPC1 | SNV | Missense_Mutation | rs750623722 | c.1522N>A | p.Val508Ile | p.V508I | P11940 | protein_coding | tolerated(0.44) | benign(0) | TCGA-C5-A1BE-01 | Cervix | cervical & endocervical cancer | Female | <65 | I/II | Chemotherapy | cisplatin | PD |
| PABPC1 | SNV | Missense_Mutation | novel | c.1457N>T | p.Ser486Leu | p.S486L | P11940 | protein_coding | tolerated(0.11) | benign(0) | TCGA-C5-A1BQ-01 | Cervix | cervical & endocervical cancer | Female | >=65 | III/IV | Chemotherapy | cisplatin | CR |
| PABPC1 | SNV | Missense_Mutation | novel | c.1457C>T | p.Ser486Leu | p.S486L | P11940 | protein_coding | tolerated(0.11) | benign(0) | TCGA-C5-A3HL-01 | Cervix | cervical & endocervical cancer | Female | >=65 | I/II | Unknown | Unknown | SD |
| PABPC1 | SNV | Missense_Mutation | c.833G>A | p.Arg278His | p.R278H | P11940 | protein_coding | tolerated(0.09) | benign(0.063) | TCGA-A6-5661-01 | Colorectum | colon adenocarcinoma | Female | >=65 | I/II | Unknown | Unknown | SD | |
| PABPC1 | SNV | Missense_Mutation | novel | c.823N>A | p.Glu275Lys | p.E275K | P11940 | protein_coding | deleterious(0.01) | possibly_damaging(0.889) | TCGA-AZ-4315-01 | Colorectum | colon adenocarcinoma | Male | <65 | I/II | Unknown | Unknown | SD |
| PABPC1 | SNV | Missense_Mutation | novel | c.944N>T | p.Ser315Phe | p.S315F | P11940 | protein_coding | deleterious(0) | probably_damaging(0.957) | TCGA-CK-4951-01 | Colorectum | colon adenocarcinoma | Female | >=65 | I/II | Unknown | Unknown | PD |
| Page: 1 2 3 4 5 6 |
Top |
Related drugs of malignant transformation related genes |
| Identification of chemicals and drugs interact with genes involved in malignant transfromation |
| (DGIdb 4.0) |
| Entrez ID | Symbol | Category | Interaction Types | Drug Claim Name | Drug Name | PMIDs |
| 26986 | PABPC1 | NA | GNF-PF-4618 | CHEMBL585964 | ||
| 26986 | PABPC1 | NA | SJ000027778 | CHEMBL592588 | ||
| 26986 | PABPC1 | NA | DITOLYLGUANIDINE | DITOLYLGUANIDINE | ||
| 26986 | PABPC1 | NA | SJ000040829 | CHEMBL589711 |
| Page: 1 |

Copyright 2023-Present -The University of Texas Health Science Center at Houston |