
|
|||||
|
 | |
| |
| |
| |
| |
| |
|
Gene: OSR2 |
Gene summary for OSR2 |
| Gene information | Species | Human | Gene symbol | OSR2 | Gene ID | 116039 |
| Gene name | odd-skipped related transciption factor 2 | |
| Gene Alias | OSR2 | |
| Cytomap | 8q22.2 | |
| Gene Type | protein-coding | GO ID | GO:0000122 | UniProtAcc | Q8N2R0 |
Top |
Malignant transformation analysis |
| Identification of the aberrant gene expression in precancerous and cancerous lesions by comparing the gene expression of stem-like cells in diseased tissues with normal stem cells |
| Entrez ID | Symbol | Replicates | Species | Organ | Tissue | Adj P-value | Log2FC | Malignancy |
| 116039 | OSR2 | AEH-subject1 | Human | Endometrium | AEH | 9.80e-32 | -6.48e-01 | -0.3059 |
| 116039 | OSR2 | AEH-subject2 | Human | Endometrium | AEH | 4.31e-25 | -6.14e-01 | -0.2525 |
| 116039 | OSR2 | AEH-subject3 | Human | Endometrium | AEH | 2.47e-27 | -6.26e-01 | -0.2576 |
| 116039 | OSR2 | AEH-subject4 | Human | Endometrium | AEH | 1.02e-15 | -5.75e-01 | -0.2657 |
| 116039 | OSR2 | AEH-subject5 | Human | Endometrium | AEH | 2.10e-32 | -6.72e-01 | -0.2953 |
| 116039 | OSR2 | EEC-subject1 | Human | Endometrium | EEC | 1.55e-31 | -6.58e-01 | -0.2682 |
| 116039 | OSR2 | EEC-subject2 | Human | Endometrium | EEC | 9.75e-31 | -6.65e-01 | -0.2607 |
| 116039 | OSR2 | EEC-subject3 | Human | Endometrium | EEC | 1.22e-35 | -6.51e-01 | -0.2525 |
| 116039 | OSR2 | EEC-subject4 | Human | Endometrium | EEC | 4.33e-29 | -6.17e-01 | -0.2571 |
| 116039 | OSR2 | EEC-subject5 | Human | Endometrium | EEC | 7.41e-35 | -6.72e-01 | -0.249 |
| 116039 | OSR2 | GSM5276934 | Human | Endometrium | EEC | 3.33e-30 | -6.35e-01 | -0.0913 |
| 116039 | OSR2 | GSM5276935 | Human | Endometrium | EEC | 5.94e-34 | -6.73e-01 | -0.123 |
| 116039 | OSR2 | GSM5276937 | Human | Endometrium | EEC | 1.10e-20 | -5.97e-01 | -0.0897 |
| 116039 | OSR2 | GSM6177620_NYU_UCEC1_lib1_lib1 | Human | Endometrium | EEC | 5.48e-25 | -6.26e-01 | -0.1869 |
| 116039 | OSR2 | GSM6177620_NYU_UCEC1_lib2_lib2 | Human | Endometrium | EEC | 2.55e-28 | -6.83e-01 | -0.1875 |
| 116039 | OSR2 | GSM6177620_NYU_UCEC1_lib3_lib3 | Human | Endometrium | EEC | 3.77e-28 | -6.35e-01 | -0.1883 |
| 116039 | OSR2 | GSM6177621_NYU_UCEC2_lib1_lib1 | Human | Endometrium | EEC | 3.55e-35 | -6.74e-01 | -0.1934 |
| 116039 | OSR2 | GSM6177622_NYU_UCEC3_lib1_lib1 | Human | Endometrium | EEC | 1.40e-37 | -6.73e-01 | -0.1917 |
| 116039 | OSR2 | GSM6177622_NYU_UCEC3_lib2_lib2 | Human | Endometrium | EEC | 2.62e-39 | -6.70e-01 | -0.1916 |
| 116039 | OSR2 | GSM6177623_NYU_UCEC3_Vis | Human | Endometrium | EEC | 2.81e-07 | -4.42e-01 | -0.1269 |
| Page: 1 2 3 4 |
| Tissue | Expression Dynamics | Abbreviation |
| Endometrium | 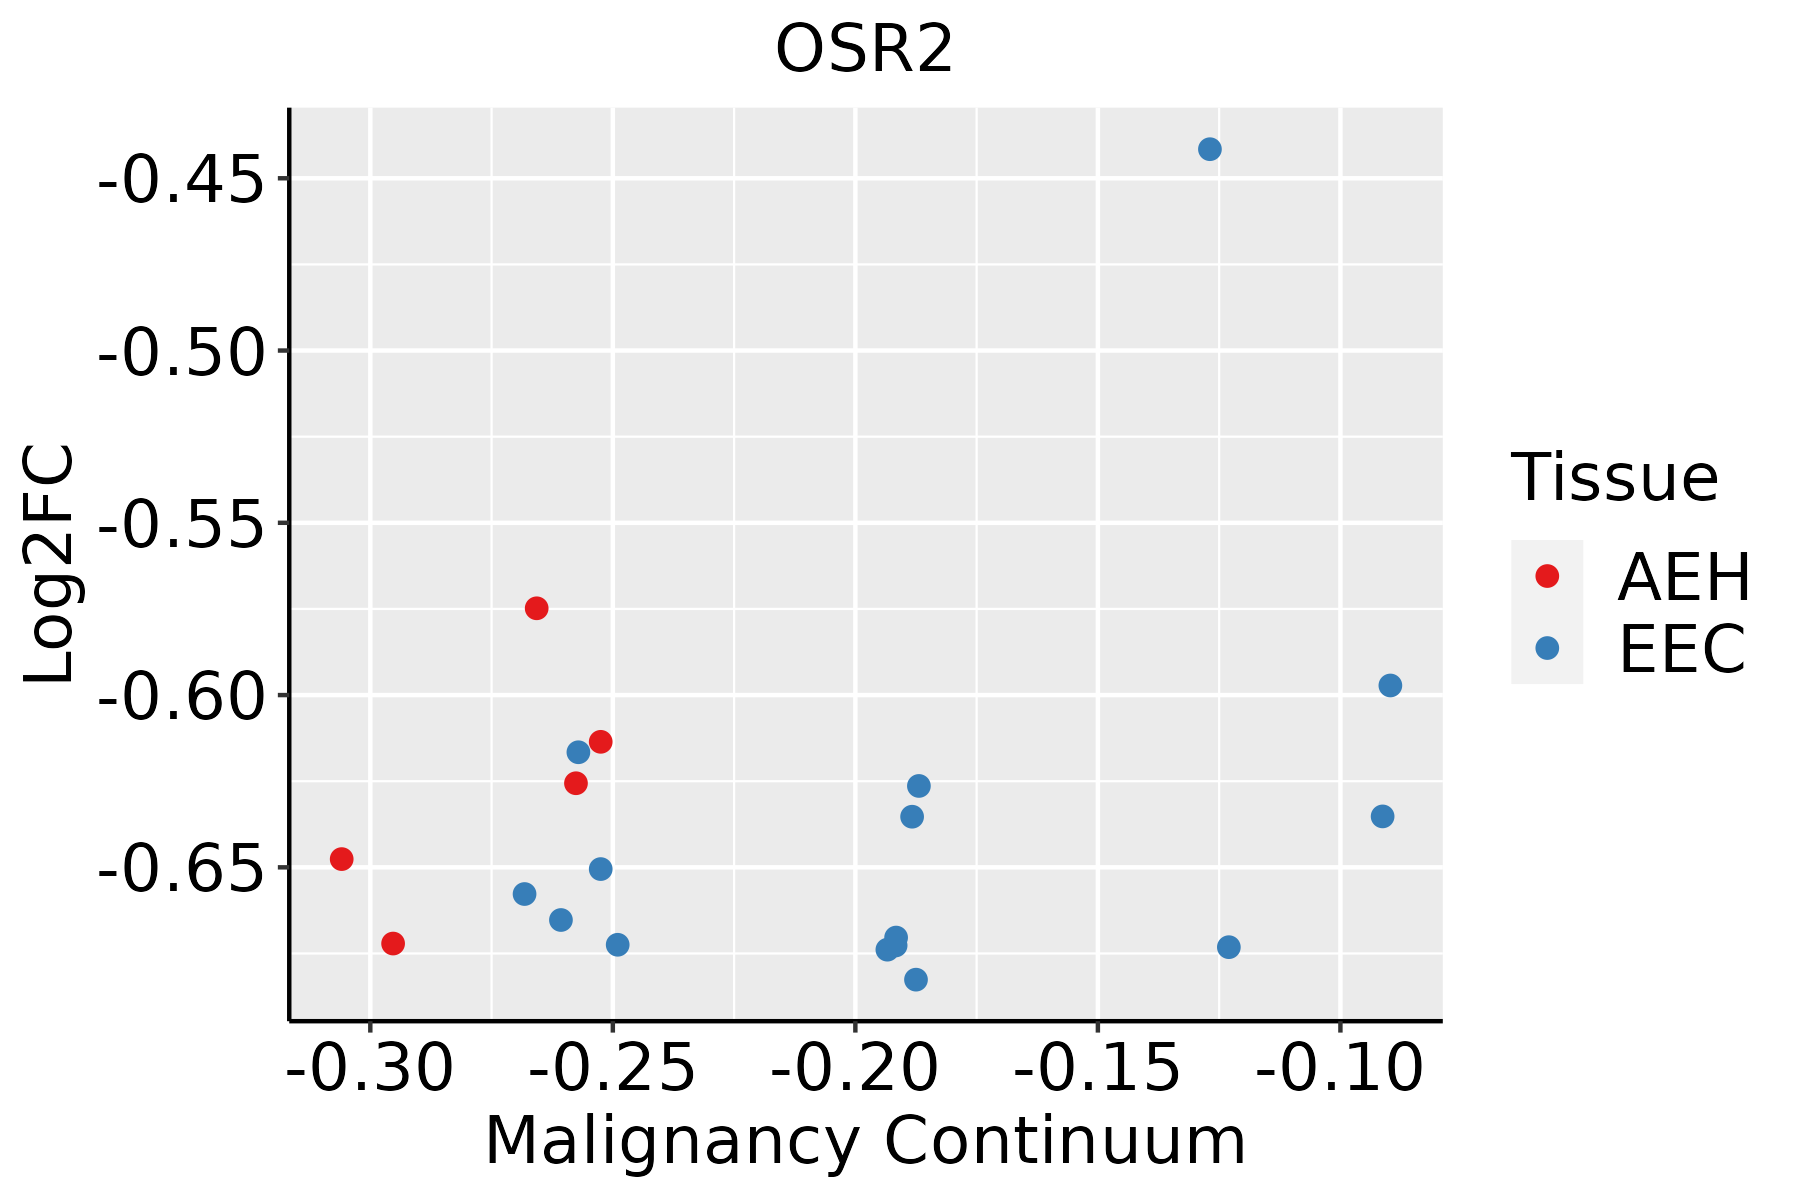 | AEH: Atypical endometrial hyperplasia |
| EEC: Endometrioid Cancer | ||
| Esophagus | 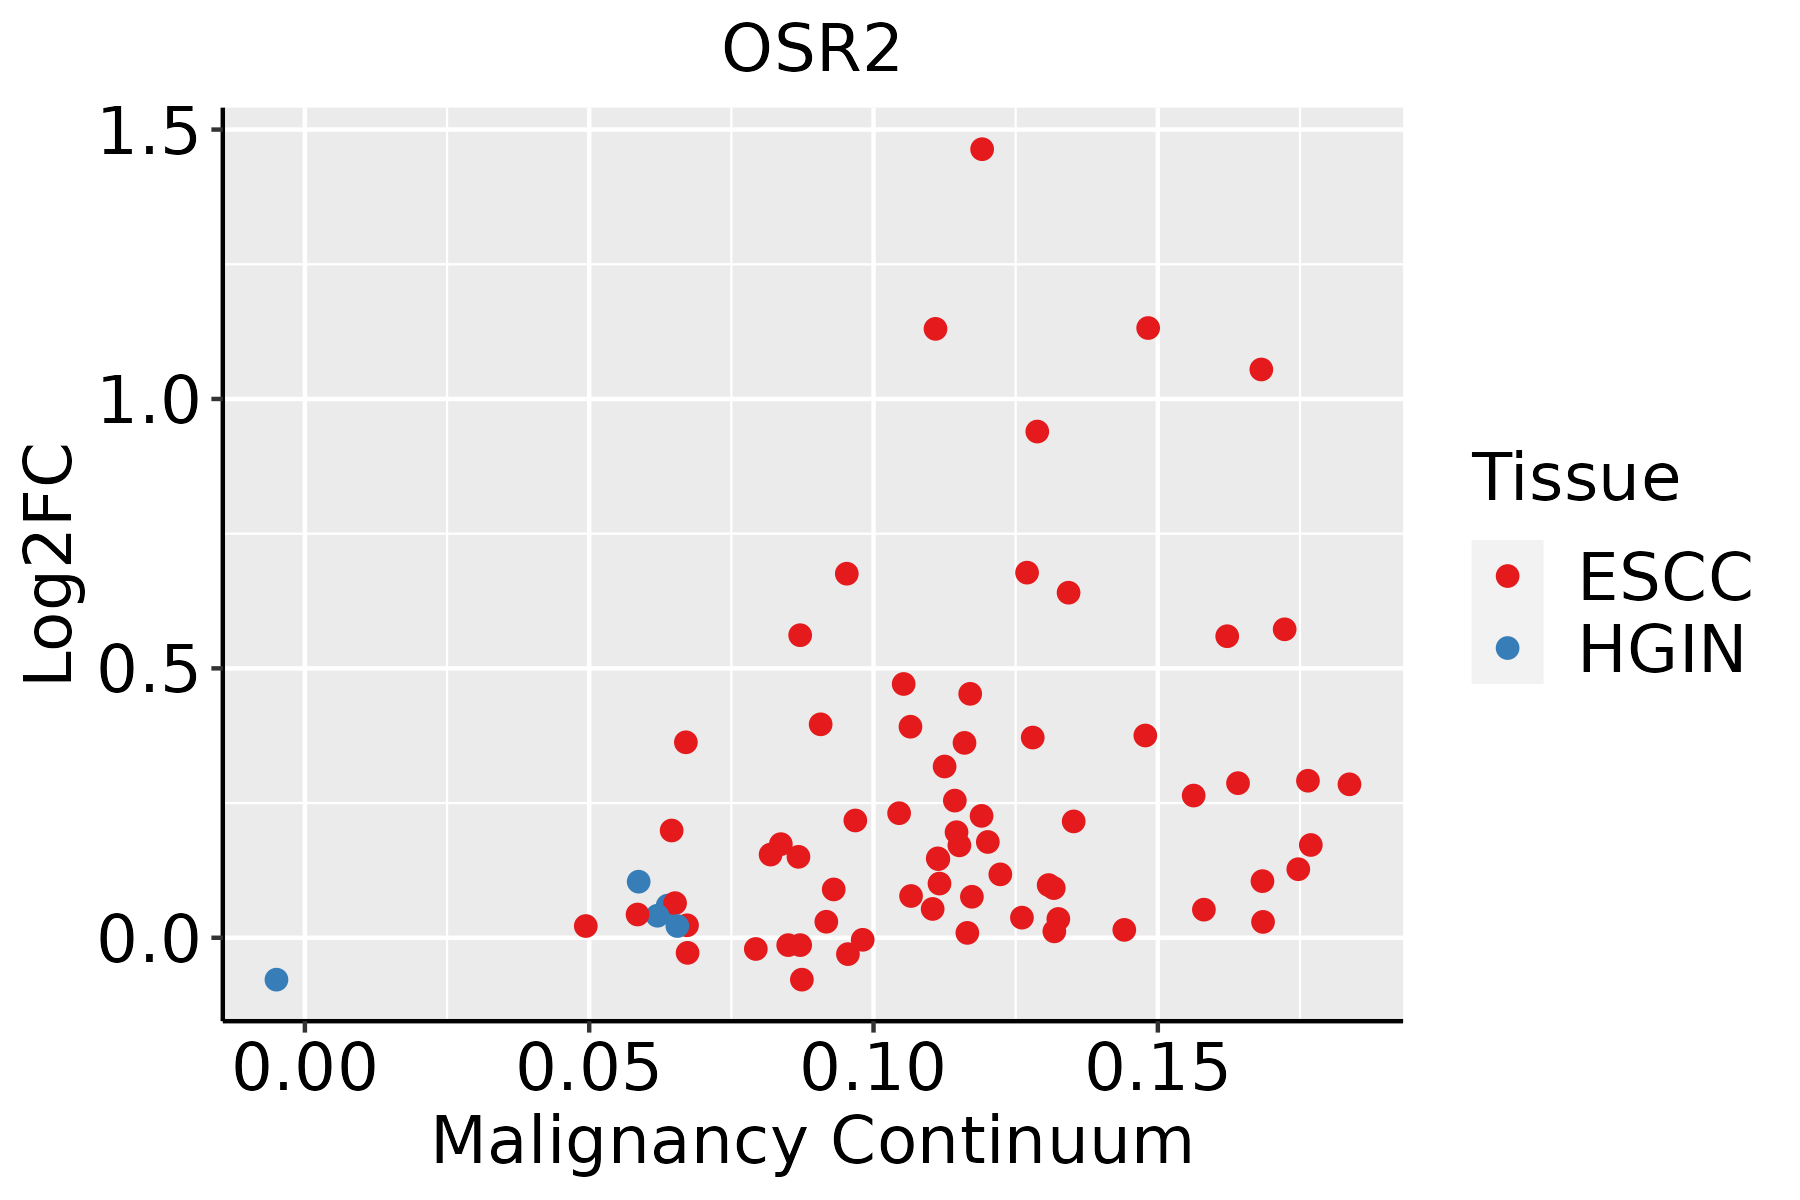 | ESCC: Esophageal squamous cell carcinoma |
| HGIN: High-grade intraepithelial neoplasias | ||
| LGIN: Low-grade intraepithelial neoplasias | ||
| Liver | 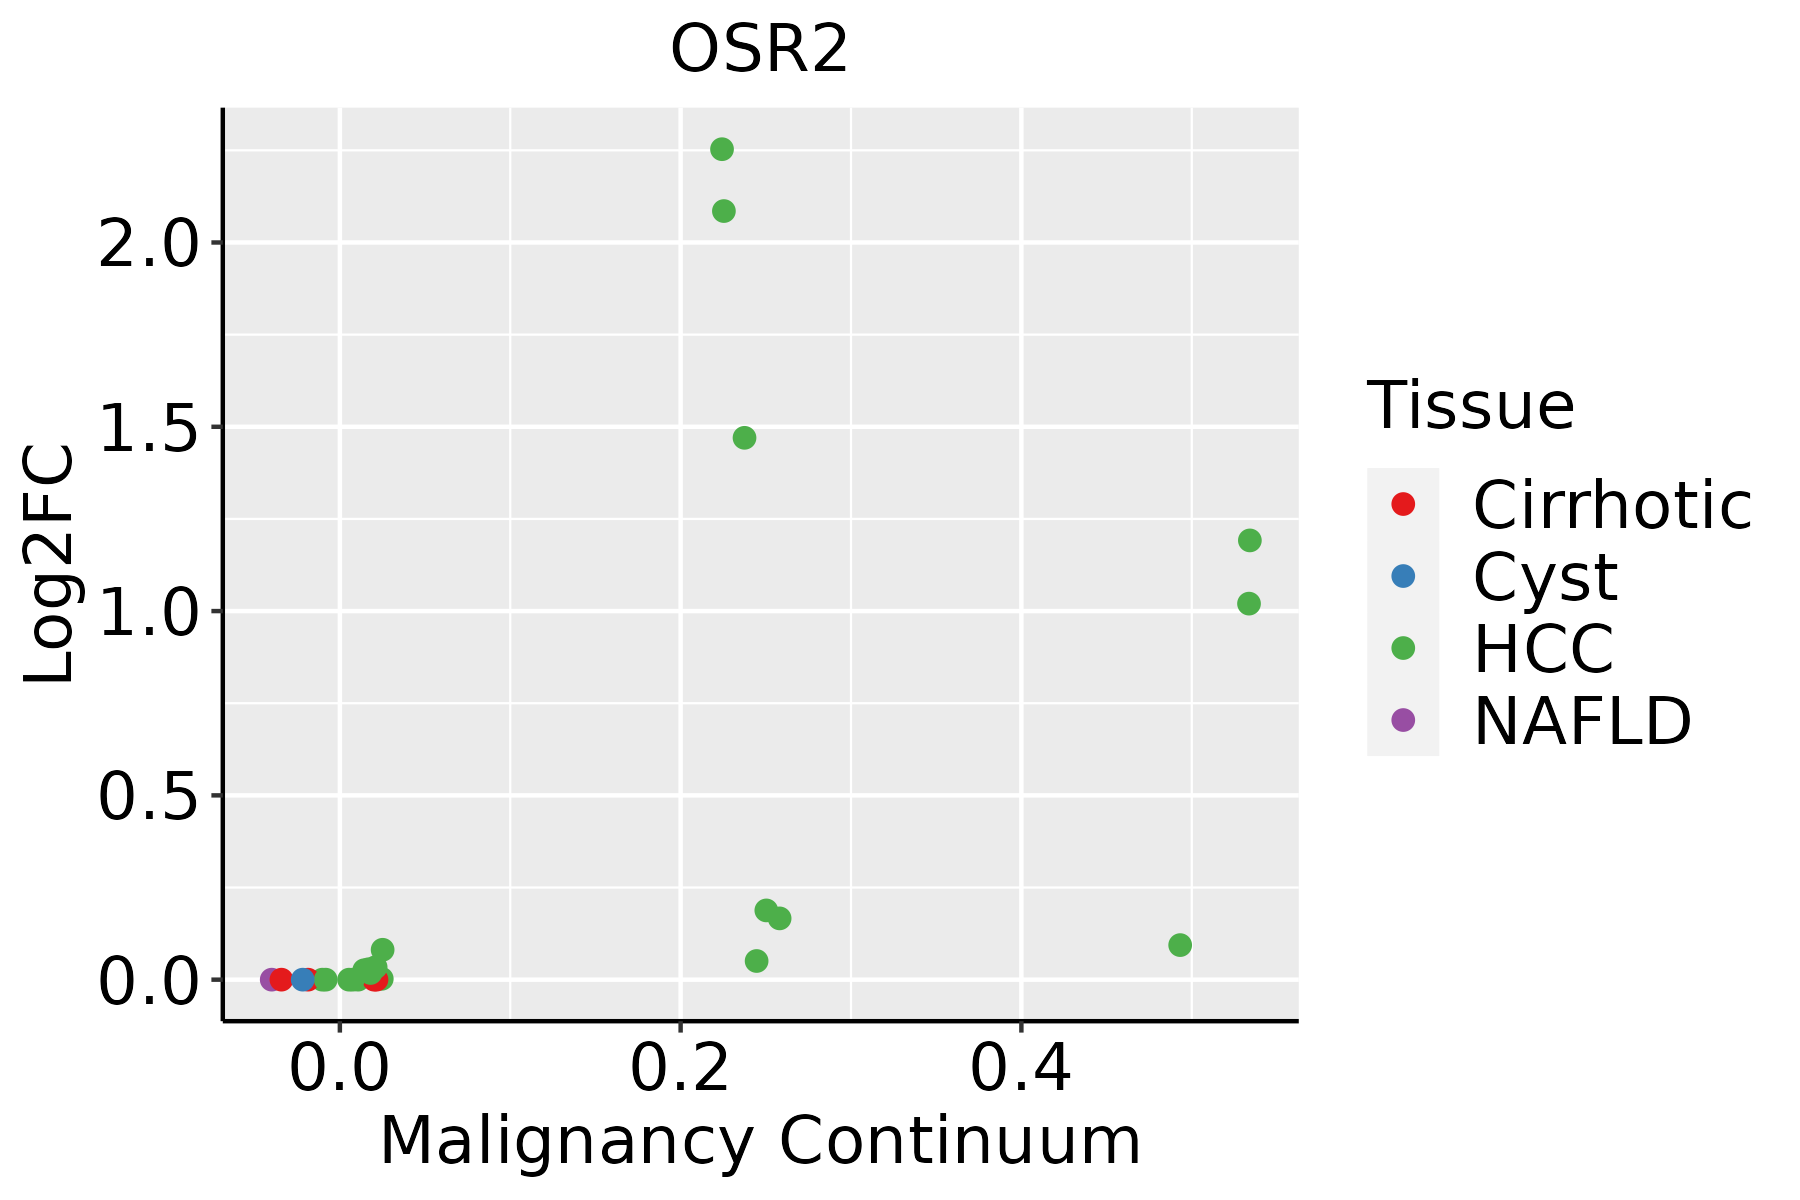 | HCC: Hepatocellular carcinoma |
| NAFLD: Non-alcoholic fatty liver disease | ||
| Oral Cavity |  | EOLP: Erosive Oral lichen planus |
| LP: leukoplakia | ||
| NEOLP: Non-erosive oral lichen planus | ||
| OSCC: Oral squamous cell carcinoma |
| ∗log2FC in expression of this searched gene in stem-like cells from each diseased tissue sample relative to stem-like cells in normal samples in each tissue plotted against the malignancy continuum. Samples are colored based on if they are from different disease stage. |
Top |
Malignant transformation related pathway analysis |
| Find out the enriched GO biological processes and KEGG pathways involved in transition from healthy to precancer to cancer |
| Tissue | Disease Stage | Enriched GO biological Processes |
| Colorectum | AD |  |
| Colorectum | SER |  |
| Colorectum | MSS |  |
| Colorectum | MSI-H |  |
| Colorectum | FAP |  |
| ∗Top 15 enriched GO BP terms are showed in the bar plot of each disease state in each tissue. Each row represents a significant GO biological process which is colored according to the -log10(p.adjust). |
| Page: 1 2 3 4 5 6 7 8 9 |
| GO ID | Tissue | Disease Stage | Description | Gene Ratio | Bg Ratio | pvalue | p.adjust | Count |
| GO:00016558 | Oral cavity | OSCC | urogenital system development | 160/7305 | 338/18723 | 1.03e-03 | 5.31e-03 | 160 |
| GO:00603484 | Oral cavity | OSCC | bone development | 99/7305 | 205/18723 | 4.13e-03 | 1.68e-02 | 99 |
| GO:004819316 | Oral cavity | LP | Golgi vesicle transport | 141/4623 | 296/18723 | 6.11e-18 | 1.06e-15 | 141 |
| GO:001605013 | Oral cavity | LP | vesicle organization | 128/4623 | 300/18723 | 4.96e-12 | 3.98e-10 | 128 |
| GO:004828412 | Oral cavity | LP | organelle fusion | 56/4623 | 141/18723 | 5.55e-05 | 7.62e-04 | 56 |
| GO:000690611 | Oral cavity | LP | vesicle fusion | 44/4623 | 106/18723 | 1.01e-04 | 1.24e-03 | 44 |
| GO:009017411 | Oral cavity | LP | organelle membrane fusion | 45/4623 | 110/18723 | 1.28e-04 | 1.49e-03 | 45 |
| GO:00610251 | Oral cavity | LP | membrane fusion | 58/4623 | 163/18723 | 1.19e-03 | 9.62e-03 | 58 |
| GO:000689111 | Oral cavity | LP | intra-Golgi vesicle-mediated transport | 16/4623 | 33/18723 | 2.59e-03 | 1.83e-02 | 16 |
| GO:000150315 | Oral cavity | LP | ossification | 123/4623 | 408/18723 | 6.55e-03 | 3.84e-02 | 123 |
| GO:0048193110 | Skin | cSCC | Golgi vesicle transport | 153/4864 | 296/18723 | 1.85e-21 | 3.41e-19 | 153 |
| GO:001605015 | Skin | cSCC | vesicle organization | 135/4864 | 300/18723 | 5.98e-13 | 3.44e-11 | 135 |
| GO:00482845 | Skin | cSCC | organelle fusion | 60/4864 | 141/18723 | 1.32e-05 | 1.67e-04 | 60 |
| GO:00610255 | Skin | cSCC | membrane fusion | 63/4864 | 163/18723 | 2.49e-04 | 2.03e-03 | 63 |
| GO:000689112 | Skin | cSCC | intra-Golgi vesicle-mediated transport | 18/4864 | 33/18723 | 4.45e-04 | 3.42e-03 | 18 |
| GO:00069064 | Skin | cSCC | vesicle fusion | 43/4864 | 106/18723 | 7.14e-04 | 5.03e-03 | 43 |
| GO:00901744 | Skin | cSCC | organelle membrane fusion | 44/4864 | 110/18723 | 8.82e-04 | 6.07e-03 | 44 |
| GO:004819320 | Thyroid | PTC | Golgi vesicle transport | 186/5968 | 296/18723 | 3.09e-28 | 1.22e-25 | 186 |
| GO:001605017 | Thyroid | PTC | vesicle organization | 163/5968 | 300/18723 | 4.74e-16 | 3.69e-14 | 163 |
| GO:00482846 | Thyroid | PTC | organelle fusion | 71/5968 | 141/18723 | 3.68e-06 | 4.70e-05 | 71 |
| Page: 1 2 3 4 5 6 |
| Pathway ID | Tissue | Disease Stage | Description | Gene Ratio | Bg Ratio | pvalue | p.adjust | qvalue | Count |
| Page: 1 |
Top |
Cell-cell communication analysis |
| Identification of potential cell-cell interactions between two cell types and their ligand-receptor pairs for different disease states |
| Ligand | Receptor | LRpair | Pathway | Tissue | Disease Stage |
| Page: 1 |
Top |
Single-cell gene regulatory network inference analysis |
| Find out the significant the regulons (TFs) and the target genes of each regulon across cell types for different disease states |
| TF | Cell Type | Tissue | Disease Stage | Target Gene | RSS | Regulon Activity |
| OSR2 | GLAN | Endometrium | ADJ | MMP11,SPON2,ISLR, etc. | 6.05e-01 |  |
| OSR2 | GLAN | Endometrium | AEH | MMP11,SPON2,ISLR, etc. | 3.92e-01 |  |
| OSR2 | PLA | Esophagus | Healthy | OTUD4,OVOL2,STAC, etc. | 2.68e-02 |  |
| OSR2 | MYOFIB | Esophagus | ADJ | ENTPD2,CTD-2003C8.2,CPZ, etc. | 6.05e-04 |  |
| OSR2 | SMC | Esophagus | ESCC | ENTPD2,CTD-2003C8.2,CPZ, etc. | 2.75e-02 |  |
| OSR2 | MYOFIB | Esophagus | Healthy | ENTPD2,CTD-2003C8.2,CPZ, etc. | 1.31e-03 | |
| OSR2 | INCAF | Esophagus | Healthy | ENTPD2,CTD-2003C8.2,CPZ, etc. | 1.53e-02 | |
| OSR2 | MSC | Esophagus | Healthy | ENTPD2,CTD-2003C8.2,CPZ, etc. | 3.30e-03 | |
| OSR2 | pDC | Prostate | BPH | PCOLCE,DCN,GPM6B, etc. | 1.61e-01 |  |
| OSR2 | INCAF | Prostate | BPH | OLFML3,DCN,LGALS3BP, etc. | 1.08e-01 | |
| ∗The dot plots of a searched regulon are shown for all cell subpopulations in each disease state of each tissue based on the regulon specific score inferred using pySCENIC and by calculating the average expression. |
| Page: 1 2 |
Top |
Somatic mutation of malignant transformation related genes |
| Annotation of somatic variants for genes involved in malignant transformation |
| Hugo Symbol | Variant Class | Variant Classification | dbSNP RS | HGVSc | HGVSp | HGVSp Short | SWISSPROT | BIOTYPE | SIFT | PolyPhen | Tumor Sample Barcode | Tissue | Histology | Sex | Age | Stage | Therapy Types | Drugs | Outcome |
| OSR2 | SNV | Missense_Mutation | c.1124N>T | p.Ser375Phe | p.S375F | Q8N2R0 | protein_coding | deleterious_low_confidence(0) | possibly_damaging(0.76) | TCGA-AR-A1AI-01 | Breast | breast invasive carcinoma | Female | <65 | I/II | Chemotherapy | cytoxan | PD | |
| OSR2 | SNV | Missense_Mutation | c.699N>G | p.Asp233Glu | p.D233E | Q8N2R0 | protein_coding | tolerated_low_confidence(0.17) | benign(0.013) | TCGA-E9-A1NA-01 | Breast | breast invasive carcinoma | Female | <65 | I/II | Chemotherapy | cyclophosphamide | SD | |
| OSR2 | SNV | Missense_Mutation | c.502C>G | p.Gln168Glu | p.Q168E | Q8N2R0 | protein_coding | deleterious_low_confidence(0) | benign(0.244) | TCGA-EW-A1PA-01 | Breast | breast invasive carcinoma | Female | <65 | I/II | Chemotherapy | cyclophosphamide | SD | |
| OSR2 | insertion | Nonsense_Mutation | novel | c.938_939insATTTTATTAAATCTTATATCCATATAGAAGAATAATTGCAACATAA | p.Thr314PhefsTer3 | p.T314Ffs*3 | Q8N2R0 | protein_coding | TCGA-A2-A0CT-01 | Breast | breast invasive carcinoma | Female | >=65 | I/II | Chemotherapy | cytoxan | SD | ||
| OSR2 | SNV | Missense_Mutation | c.1078N>A | p.Gln360Lys | p.Q360K | Q8N2R0 | protein_coding | deleterious_low_confidence(0) | possibly_damaging(0.694) | TCGA-EK-A2PG-01 | Cervix | cervical & endocervical cancer | Female | >=65 | I/II | Unknown | Unknown | SD | |
| OSR2 | SNV | Missense_Mutation | c.496N>A | p.Ala166Thr | p.A166T | Q8N2R0 | protein_coding | deleterious_low_confidence(0.02) | probably_damaging(0.993) | TCGA-MA-AA3X-01 | Cervix | cervical & endocervical cancer | Female | <65 | III/IV | Chemotherapy | cisplatin | CR | |
| OSR2 | SNV | Missense_Mutation | novel | c.1105N>C | p.Thr369Pro | p.T369P | Q8N2R0 | protein_coding | deleterious_low_confidence(0.01) | possibly_damaging(0.837) | TCGA-AA-3510-01 | Colorectum | colon adenocarcinoma | Male | >=65 | I/II | Unknown | Unknown | SD |
| OSR2 | SNV | Missense_Mutation | novel | c.820T>G | p.Leu274Val | p.L274V | Q8N2R0 | protein_coding | deleterious_low_confidence(0.03) | benign(0.297) | TCGA-AA-3684-01 | Colorectum | colon adenocarcinoma | Female | >=65 | III/IV | Unknown | Unknown | SD |
| OSR2 | SNV | Missense_Mutation | novel | c.709N>C | p.Phe237Leu | p.F237L | Q8N2R0 | protein_coding | deleterious_low_confidence(0.04) | probably_damaging(0.986) | TCGA-AA-3984-01 | Colorectum | colon adenocarcinoma | Female | <65 | I/II | Unknown | Unknown | SD |
| OSR2 | SNV | Missense_Mutation | c.386N>T | p.Ala129Val | p.A129V | Q8N2R0 | protein_coding | deleterious_low_confidence(0) | probably_damaging(0.99) | TCGA-AD-6965-01 | Colorectum | colon adenocarcinoma | Male | <65 | III/IV | Chemotherapy | oxaliplatin | PD |
| Page: 1 2 3 4 5 6 7 |
Top |
Related drugs of malignant transformation related genes |
| Identification of chemicals and drugs interact with genes involved in malignant transfromation |
| (DGIdb 4.0) |
| Entrez ID | Symbol | Category | Interaction Types | Drug Claim Name | Drug Name | PMIDs |
| Page: 1 |

Copyright 2023-Present -The University of Texas Health Science Center at Houston |