
|
|||||
|
 | |
| |
| |
| |
| |
| |
|
Gene: NOL9 |
Gene summary for NOL9 |
| Gene information | Species | Human | Gene symbol | NOL9 | Gene ID | 79707 |
| Gene name | nucleolar protein 9 | |
| Gene Alias | Grc3 | |
| Cytomap | 1p36.31 | |
| Gene Type | protein-coding | GO ID | GO:0000448 | UniProtAcc | Q5SY16 |
Top |
Malignant transformation analysis |
| Identification of the aberrant gene expression in precancerous and cancerous lesions by comparing the gene expression of stem-like cells in diseased tissues with normal stem cells |
| Entrez ID | Symbol | Replicates | Species | Organ | Tissue | Adj P-value | Log2FC | Malignancy |
| 79707 | NOL9 | LZE2T | Human | Esophagus | ESCC | 4.35e-02 | 5.05e-01 | 0.082 |
| 79707 | NOL9 | LZE7T | Human | Esophagus | ESCC | 1.27e-02 | 2.61e-01 | 0.0667 |
| 79707 | NOL9 | LZE22T | Human | Esophagus | ESCC | 3.89e-02 | 1.65e-01 | 0.068 |
| 79707 | NOL9 | LZE24T | Human | Esophagus | ESCC | 1.16e-12 | 1.62e-01 | 0.0596 |
| 79707 | NOL9 | P1T-E | Human | Esophagus | ESCC | 4.29e-02 | 1.47e-01 | 0.0875 |
| 79707 | NOL9 | P2T-E | Human | Esophagus | ESCC | 1.62e-31 | 4.71e-01 | 0.1177 |
| 79707 | NOL9 | P4T-E | Human | Esophagus | ESCC | 9.78e-21 | 4.56e-01 | 0.1323 |
| 79707 | NOL9 | P5T-E | Human | Esophagus | ESCC | 9.53e-15 | 2.28e-01 | 0.1327 |
| 79707 | NOL9 | P8T-E | Human | Esophagus | ESCC | 2.08e-14 | 1.48e-01 | 0.0889 |
| 79707 | NOL9 | P9T-E | Human | Esophagus | ESCC | 3.15e-04 | 8.52e-02 | 0.1131 |
| 79707 | NOL9 | P10T-E | Human | Esophagus | ESCC | 1.76e-16 | 3.20e-01 | 0.116 |
| 79707 | NOL9 | P11T-E | Human | Esophagus | ESCC | 1.43e-08 | 3.19e-01 | 0.1426 |
| 79707 | NOL9 | P12T-E | Human | Esophagus | ESCC | 9.32e-17 | 1.90e-01 | 0.1122 |
| 79707 | NOL9 | P15T-E | Human | Esophagus | ESCC | 3.40e-18 | 2.53e-01 | 0.1149 |
| 79707 | NOL9 | P16T-E | Human | Esophagus | ESCC | 1.95e-11 | 2.55e-01 | 0.1153 |
| 79707 | NOL9 | P19T-E | Human | Esophagus | ESCC | 8.49e-07 | 5.66e-01 | 0.1662 |
| 79707 | NOL9 | P20T-E | Human | Esophagus | ESCC | 2.06e-40 | 9.32e-01 | 0.1124 |
| 79707 | NOL9 | P21T-E | Human | Esophagus | ESCC | 2.02e-29 | 5.90e-01 | 0.1617 |
| 79707 | NOL9 | P22T-E | Human | Esophagus | ESCC | 1.36e-11 | 1.45e-01 | 0.1236 |
| 79707 | NOL9 | P23T-E | Human | Esophagus | ESCC | 1.61e-19 | 3.25e-01 | 0.108 |
| Page: 1 2 3 4 5 |
| Tissue | Expression Dynamics | Abbreviation |
| Esophagus |  | ESCC: Esophageal squamous cell carcinoma |
| HGIN: High-grade intraepithelial neoplasias | ||
| LGIN: Low-grade intraepithelial neoplasias | ||
| Liver | 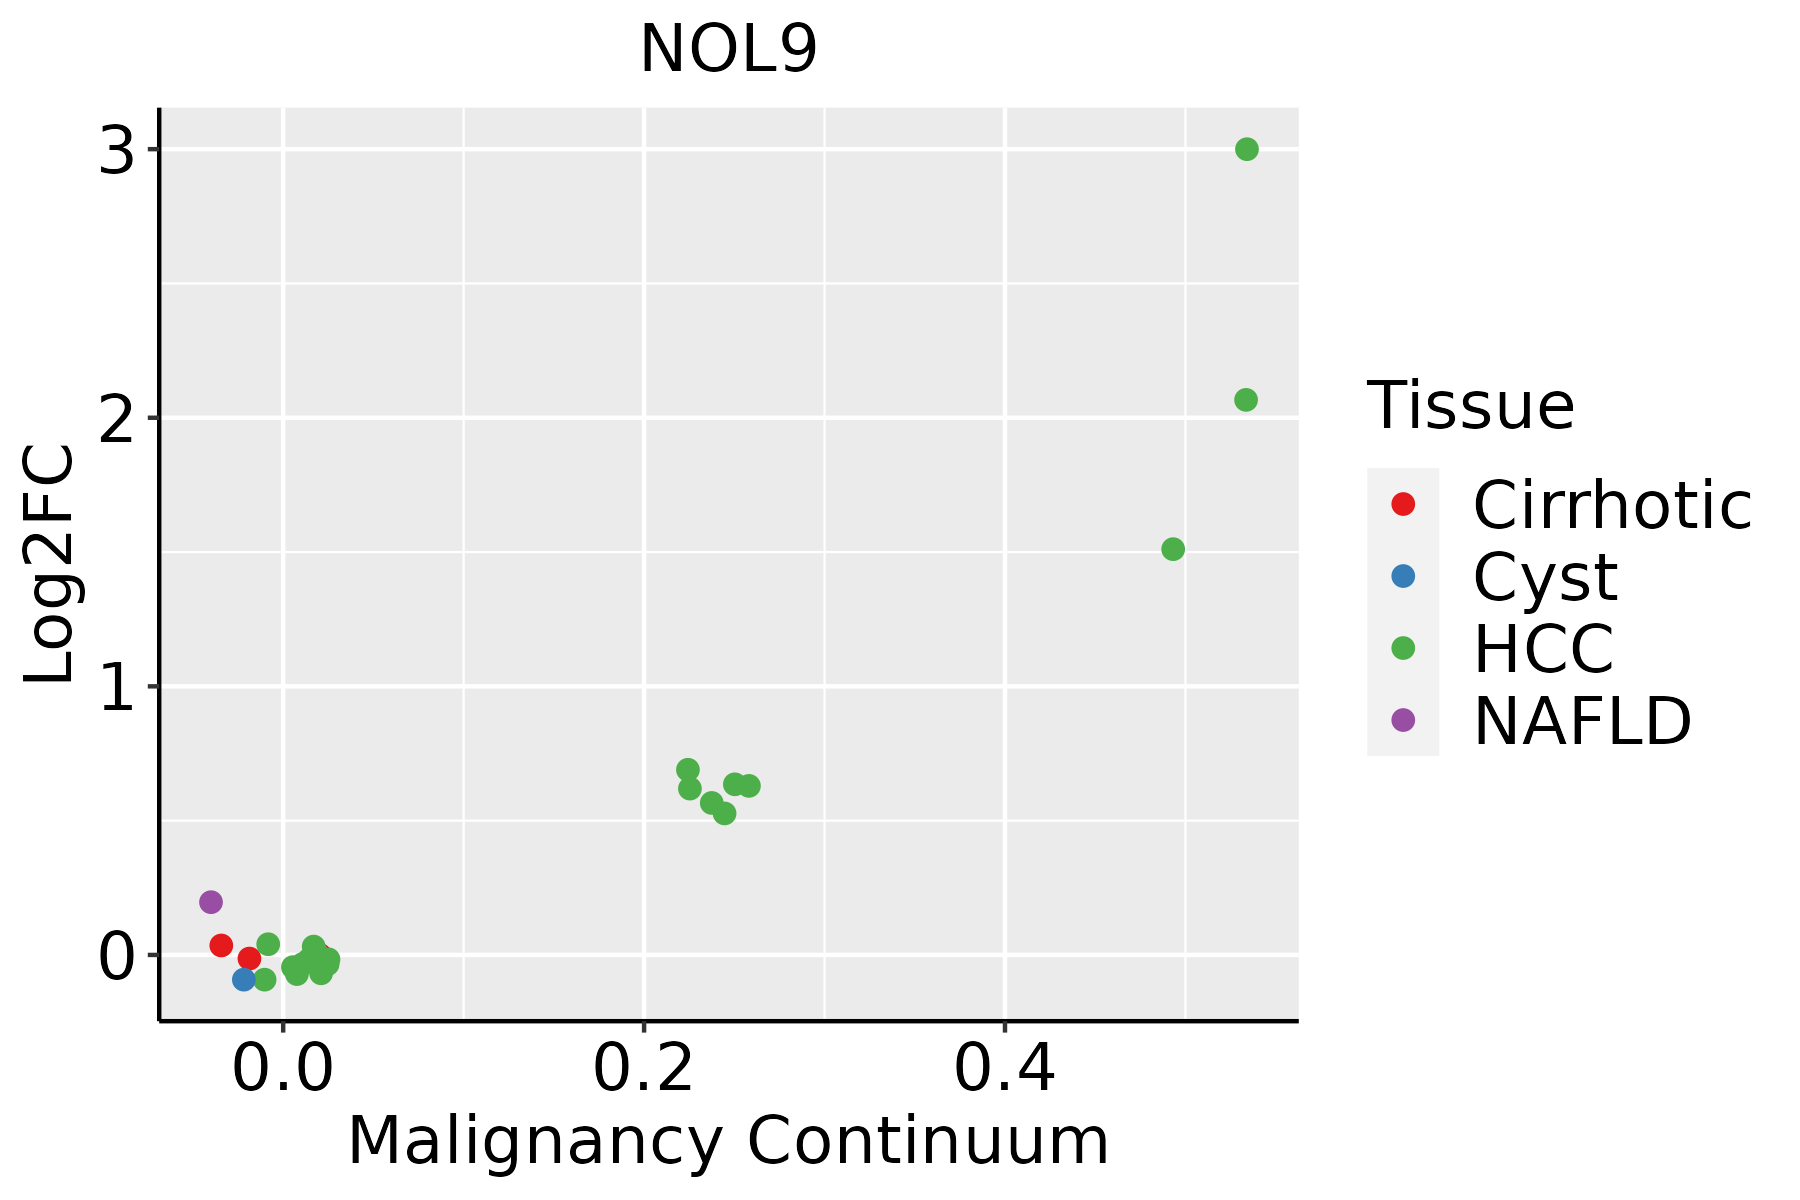 | HCC: Hepatocellular carcinoma |
| NAFLD: Non-alcoholic fatty liver disease | ||
| Oral Cavity |  | EOLP: Erosive Oral lichen planus |
| LP: leukoplakia | ||
| NEOLP: Non-erosive oral lichen planus | ||
| OSCC: Oral squamous cell carcinoma | ||
| Thyroid |  | ATC: Anaplastic thyroid cancer |
| HT: Hashimoto's thyroiditis | ||
| PTC: Papillary thyroid cancer |
| ∗log2FC in expression of this searched gene in stem-like cells from each diseased tissue sample relative to stem-like cells in normal samples in each tissue plotted against the malignancy continuum. Samples are colored based on if they are from different disease stage. |
Top |
Malignant transformation related pathway analysis |
| Find out the enriched GO biological processes and KEGG pathways involved in transition from healthy to precancer to cancer |
| Tissue | Disease Stage | Enriched GO biological Processes |
| Colorectum | AD |  |
| Colorectum | SER |  |
| Colorectum | MSS |  |
| Colorectum | MSI-H |  |
| Colorectum | FAP |  |
| ∗Top 15 enriched GO BP terms are showed in the bar plot of each disease state in each tissue. Each row represents a significant GO biological process which is colored according to the -log10(p.adjust). |
| Page: 1 2 3 4 5 6 7 8 9 |
| GO ID | Tissue | Disease Stage | Description | Gene Ratio | Bg Ratio | pvalue | p.adjust | Count |
| GO:000047911 | Thyroid | ATC | endonucleolytic cleavage of tricistronic rRNA transcript (SSU-rRNA, 5.8S rRNA, LSU-rRNA) | 11/6293 | 15/18723 | 1.94e-03 | 9.41e-03 | 11 |
| GO:000046611 | Thyroid | ATC | maturation of 5.8S rRNA from tricistronic rRNA transcript (SSU-rRNA, 5.8S rRNA, LSU-rRNA) | 15/6293 | 24/18723 | 3.52e-03 | 1.56e-02 | 15 |
| GO:009030511 | Thyroid | ATC | nucleic acid phosphodiester bond hydrolysis | 107/6293 | 261/18723 | 7.21e-03 | 2.84e-02 | 107 |
| Page: 1 2 3 4 5 |
| Pathway ID | Tissue | Disease Stage | Description | Gene Ratio | Bg Ratio | pvalue | p.adjust | qvalue | Count |
| Page: 1 |
Top |
Cell-cell communication analysis |
| Identification of potential cell-cell interactions between two cell types and their ligand-receptor pairs for different disease states |
| Ligand | Receptor | LRpair | Pathway | Tissue | Disease Stage |
| Page: 1 |
Top |
Single-cell gene regulatory network inference analysis |
| Find out the significant the regulons (TFs) and the target genes of each regulon across cell types for different disease states |
| TF | Cell Type | Tissue | Disease Stage | Target Gene | RSS | Regulon Activity |
| ∗The dot plots of a searched regulon are shown for all cell subpopulations in each disease state of each tissue based on the regulon specific score inferred using pySCENIC and by calculating the average expression. |
| Page: 1 |
Top |
Somatic mutation of malignant transformation related genes |
| Annotation of somatic variants for genes involved in malignant transformation |
| Hugo Symbol | Variant Class | Variant Classification | dbSNP RS | HGVSc | HGVSp | HGVSp Short | SWISSPROT | BIOTYPE | SIFT | PolyPhen | Tumor Sample Barcode | Tissue | Histology | Sex | Age | Stage | Therapy Types | Drugs | Outcome |
| NOL9 | insertion | In_Frame_Ins | novel | c.1735_1736insAGCCGAGACGGTGTCAGGGCCGCCTCCAAGGCC | p.Gly579delinsGluProArgArgCysGlnGlyArgLeuGlnGlyArg | p.G579delinsEPRRCQGRLQGR | Q5SY16 | protein_coding | TCGA-A2-A04V-01 | Breast | breast invasive carcinoma | Female | <65 | I/II | Chemotherapy | cytoxan | PD | ||
| NOL9 | insertion | Frame_Shift_Ins | novel | c.533_534insTAACGTTTATAGTTTAGCCGAGGAGATGGCAGTCCTAAAGG | p.Leu179AsnfsTer27 | p.L179Nfs*27 | Q5SY16 | protein_coding | TCGA-A2-A0D1-01 | Breast | breast invasive carcinoma | Female | >=65 | I/II | Chemotherapy | taxotere | SD | ||
| NOL9 | insertion | Frame_Shift_Ins | novel | c.1612_1613insTAGCGGCAGGTAG | p.Pro538LeufsTer11 | p.P538Lfs*11 | Q5SY16 | protein_coding | TCGA-A7-A0CG-01 | Breast | breast invasive carcinoma | Female | >=65 | I/II | Unknown | Unknown | SD | ||
| NOL9 | SNV | Missense_Mutation | novel | c.1987G>A | p.Val663Ile | p.V663I | Q5SY16 | protein_coding | tolerated(0.32) | benign(0.007) | TCGA-EA-A3HU-01 | Cervix | cervical & endocervical cancer | Female | <65 | I/II | Unknown | Unknown | SD |
| NOL9 | SNV | Missense_Mutation | c.1849N>C | p.Glu617Gln | p.E617Q | Q5SY16 | protein_coding | tolerated(0.05) | probably_damaging(0.917) | TCGA-EA-A6QX-01 | Cervix | cervical & endocervical cancer | Female | <65 | III/IV | Unknown | Unknown | SD | |
| NOL9 | SNV | Missense_Mutation | c.967T>G | p.Leu323Val | p.L323V | Q5SY16 | protein_coding | deleterious(0) | probably_damaging(0.946) | TCGA-FU-A3HZ-01 | Cervix | cervical & endocervical cancer | Female | <65 | I/II | Chemotherapy | cisplatin | CR | |
| NOL9 | SNV | Missense_Mutation | c.731N>G | p.Ile244Ser | p.I244S | Q5SY16 | protein_coding | deleterious(0.02) | benign(0.143) | TCGA-AA-3509-01 | Colorectum | colon adenocarcinoma | Female | <65 | I/II | Unknown | Unknown | SD | |
| NOL9 | SNV | Missense_Mutation | c.1459N>G | p.Ser487Gly | p.S487G | Q5SY16 | protein_coding | tolerated(0.13) | benign(0.011) | TCGA-AA-3982-01 | Colorectum | colon adenocarcinoma | Male | >=65 | III/IV | Unknown | Unknown | SD | |
| NOL9 | SNV | Missense_Mutation | c.1394N>T | p.Arg465Ile | p.R465I | Q5SY16 | protein_coding | deleterious(0) | probably_damaging(0.943) | TCGA-AA-3984-01 | Colorectum | colon adenocarcinoma | Female | <65 | I/II | Unknown | Unknown | SD | |
| NOL9 | SNV | Missense_Mutation | c.1846A>T | p.Met616Leu | p.M616L | Q5SY16 | protein_coding | deleterious(0.01) | possibly_damaging(0.621) | TCGA-AA-A01D-01 | Colorectum | colon adenocarcinoma | Female | <65 | III/IV | Chemotherapy | capecitabine | PD |
| Page: 1 2 3 4 5 |
Top |
Related drugs of malignant transformation related genes |
| Identification of chemicals and drugs interact with genes involved in malignant transfromation |
| (DGIdb 4.0) |
| Entrez ID | Symbol | Category | Interaction Types | Drug Claim Name | Drug Name | PMIDs |
| Page: 1 |

Copyright 2023-Present -The University of Texas Health Science Center at Houston |