| Tissue | Expression Dynamics | Abbreviation |
| Breast | 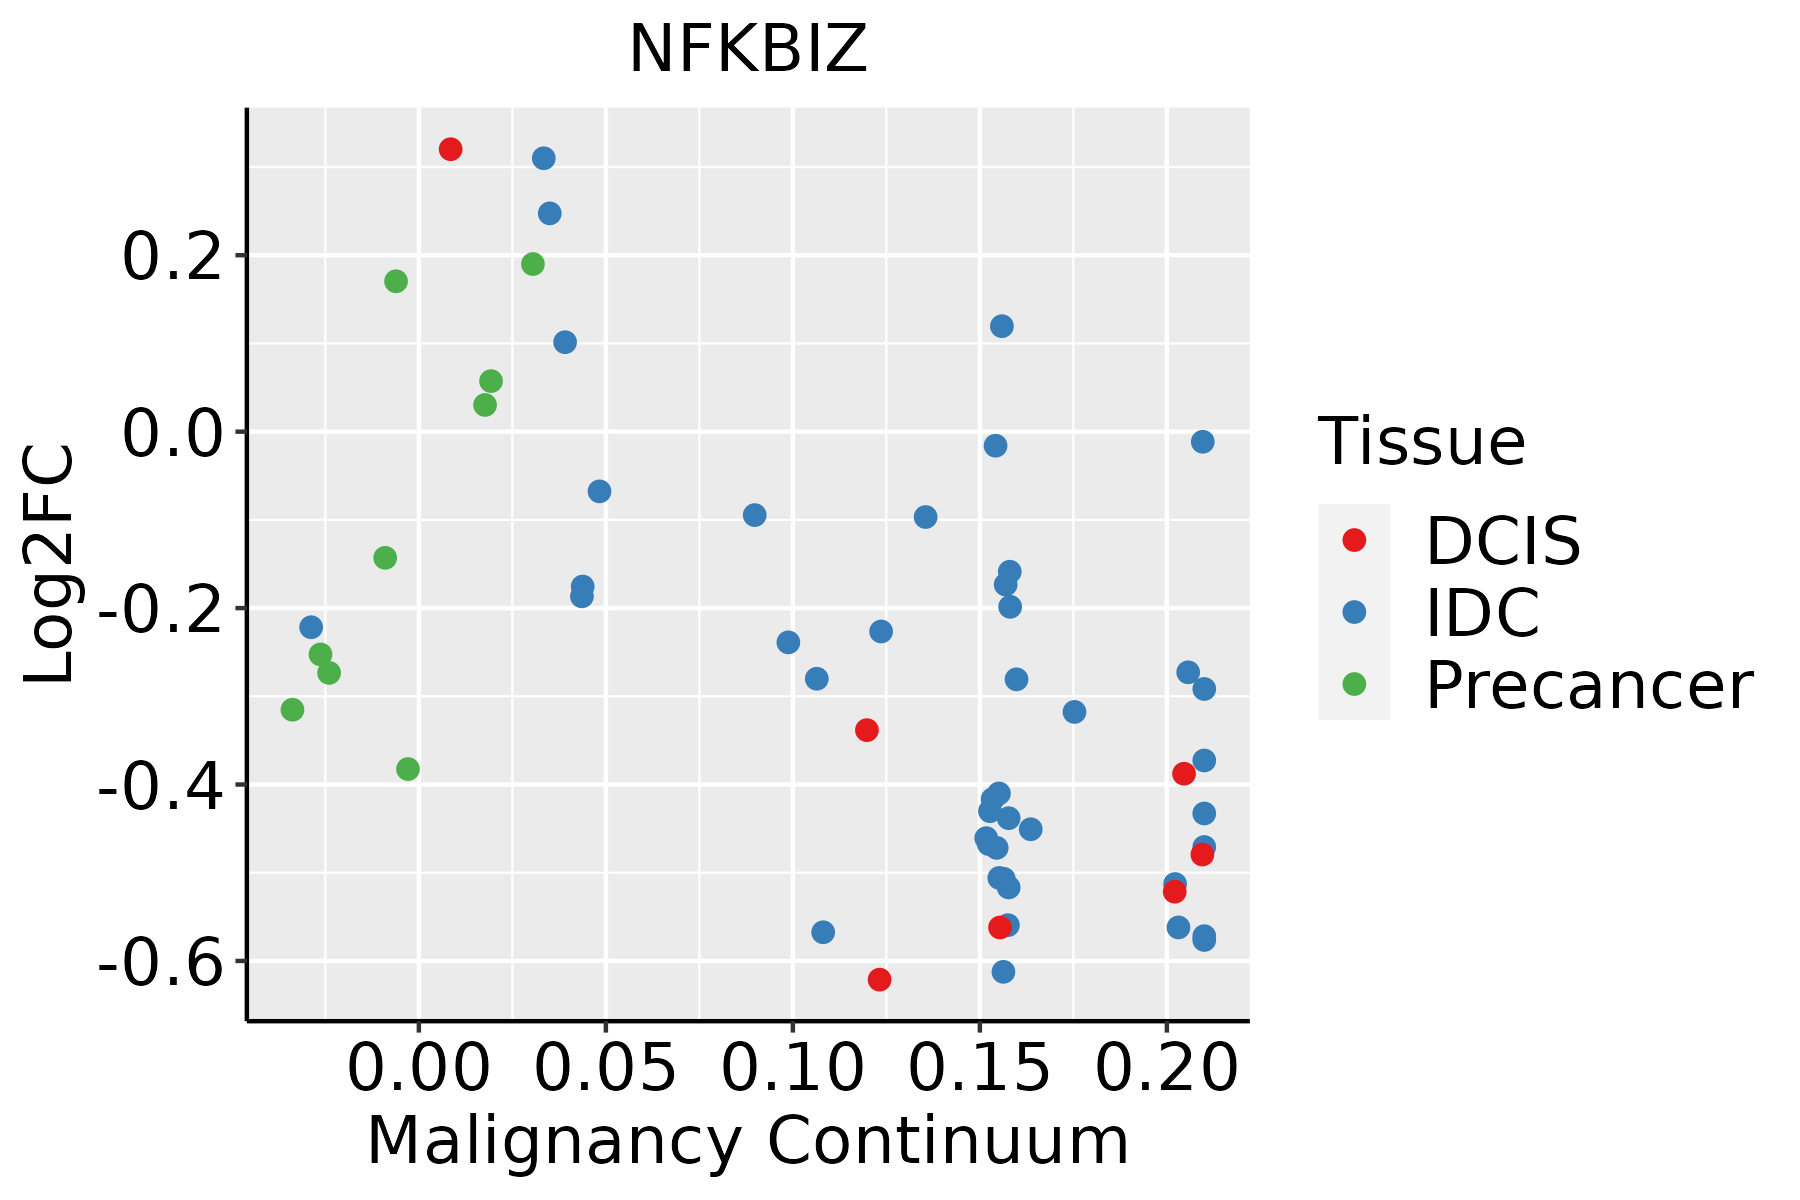 | IDC: Invasive ductal carcinoma |
| DCIS: Ductal carcinoma in situ |
| Precancer(BRCA1-mut): Precancerous lesion from BRCA1 mutation carriers |
| Cervix | 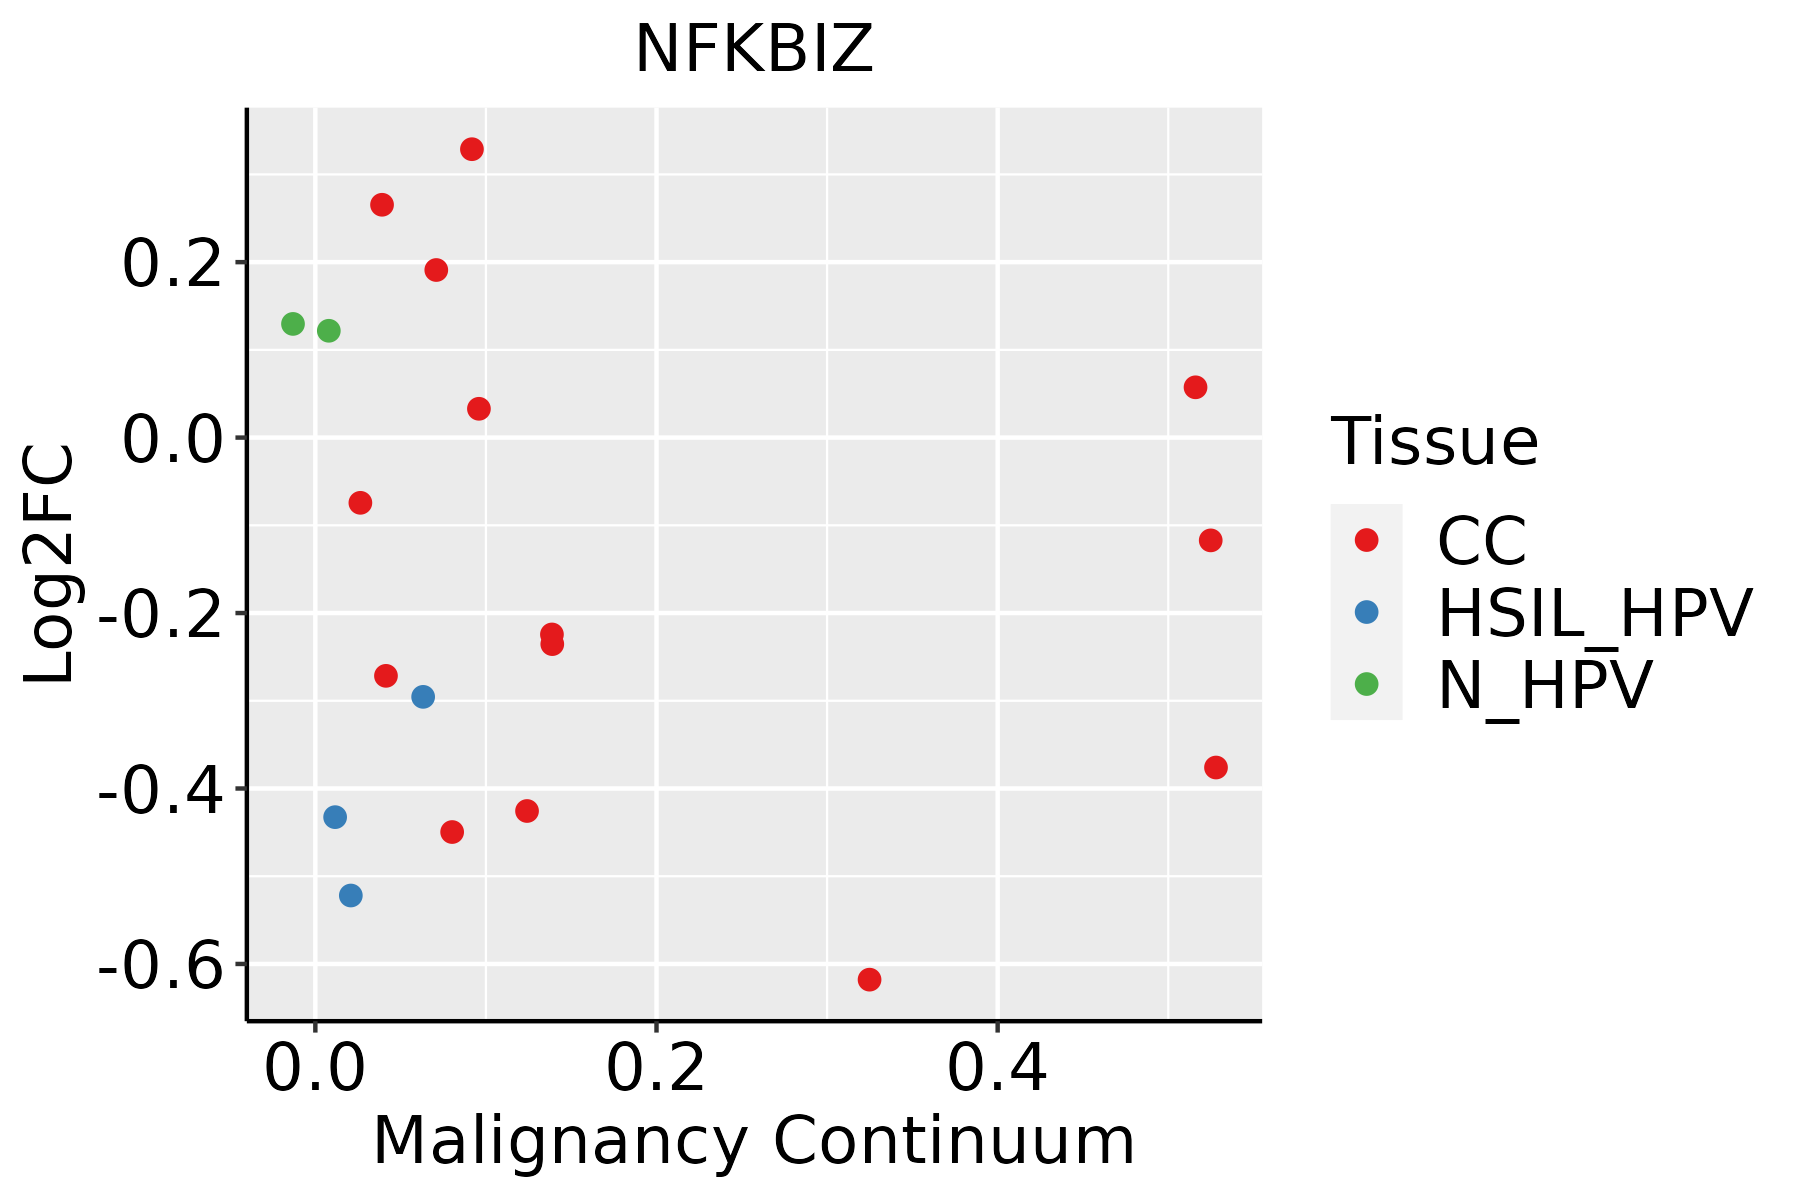 | CC: Cervix cancer |
| HSIL_HPV: HPV-infected high-grade squamous intraepithelial lesions |
| N_HPV: HPV-infected normal cervix |
| Endometrium |  | AEH: Atypical endometrial hyperplasia |
| EEC: Endometrioid Cancer |
| Esophagus |  | ESCC: Esophageal squamous cell carcinoma |
| HGIN: High-grade intraepithelial neoplasias |
| LGIN: Low-grade intraepithelial neoplasias |
| Liver | 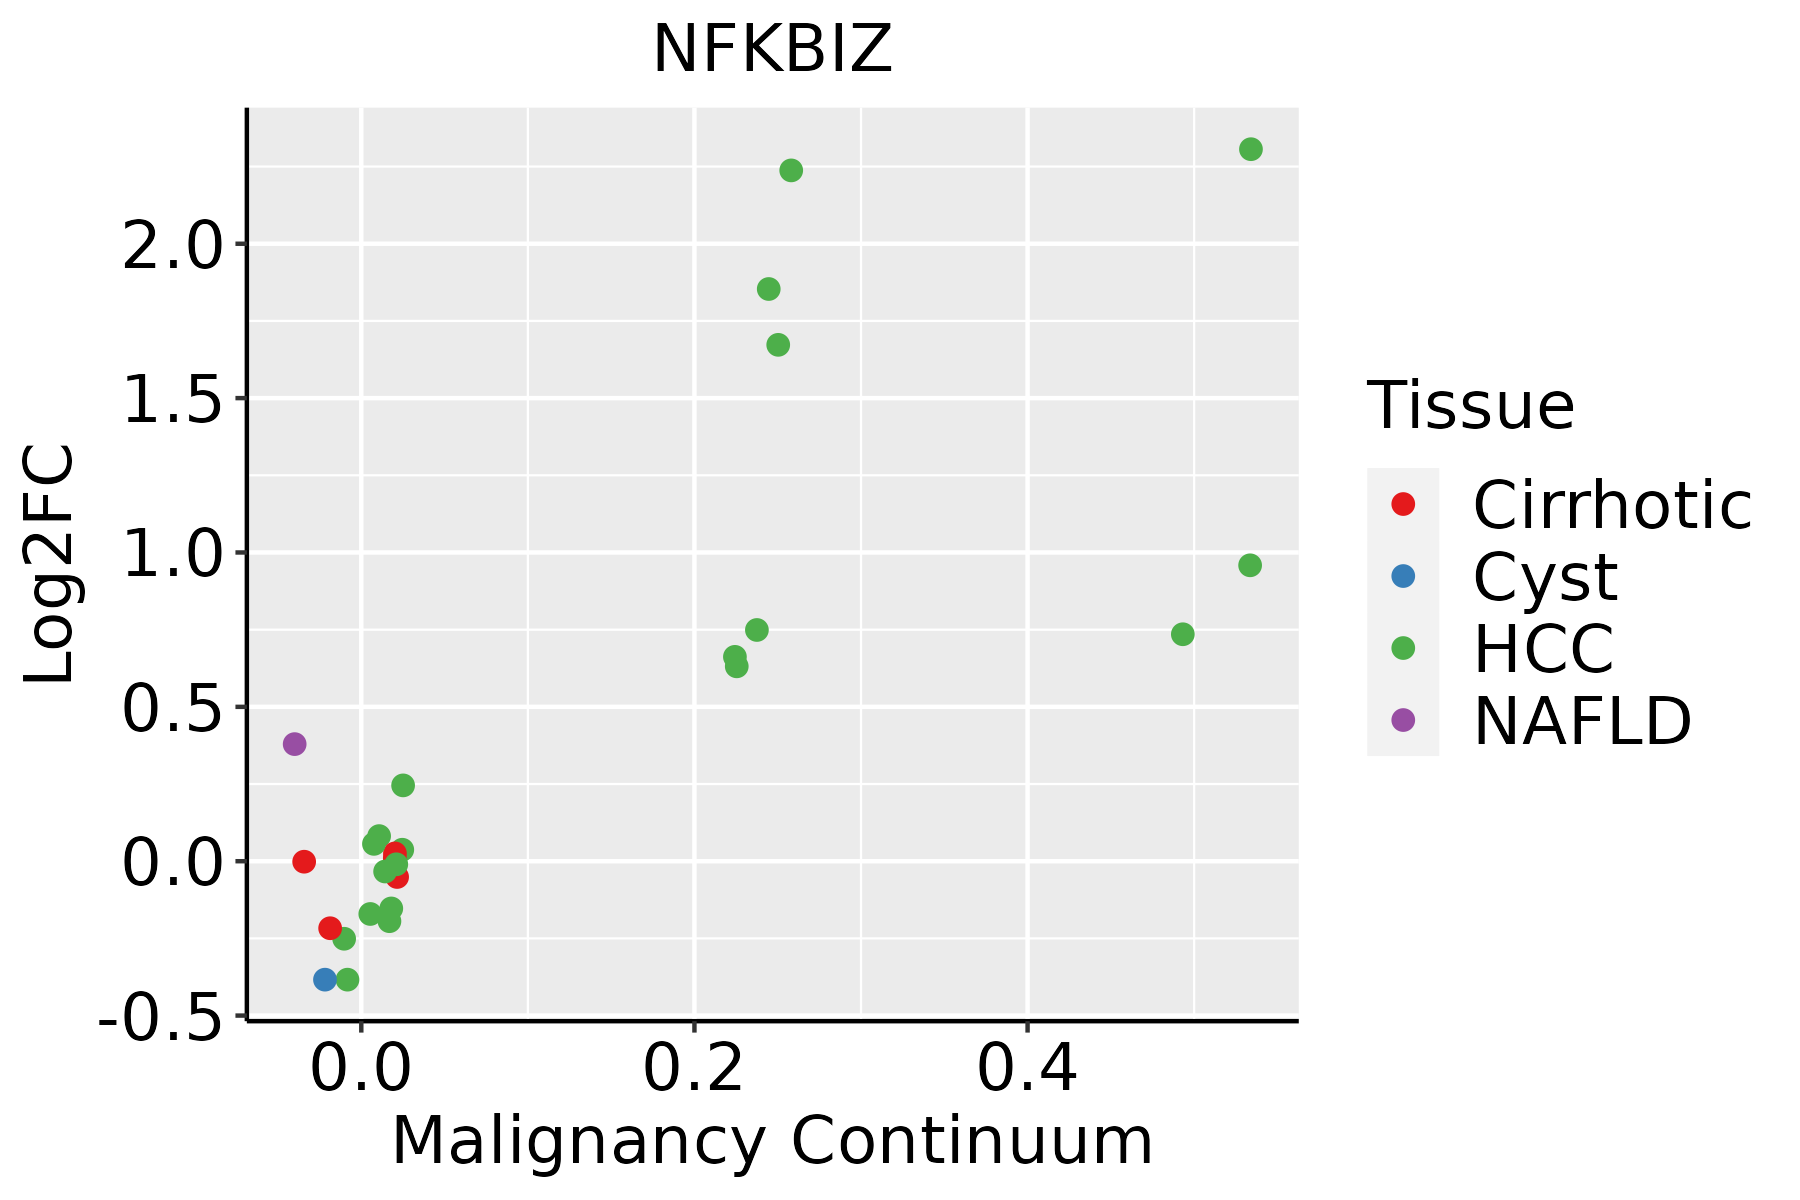 | HCC: Hepatocellular carcinoma |
| NAFLD: Non-alcoholic fatty liver disease |
| Lung | 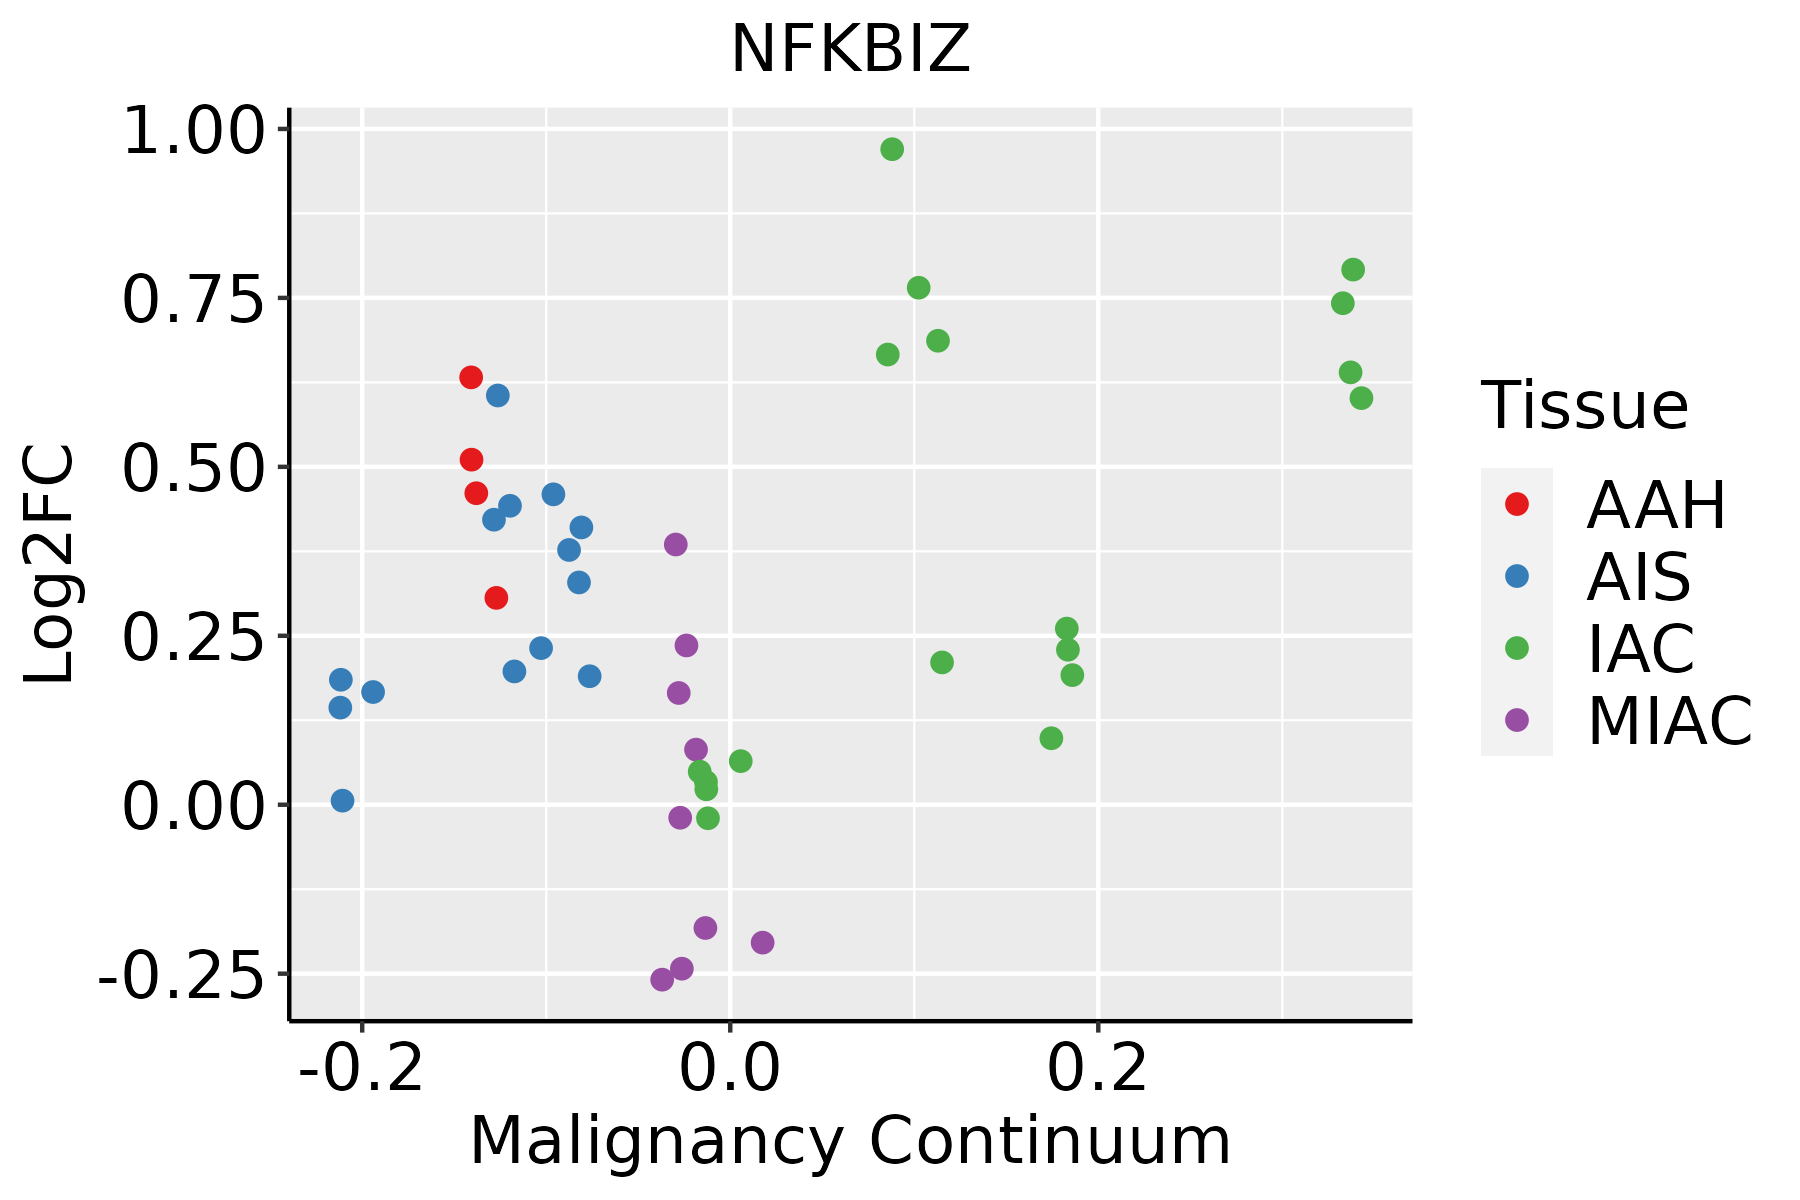 | AAH: Atypical adenomatous hyperplasia |
| AIS: Adenocarcinoma in situ |
| IAC: Invasive lung adenocarcinoma |
| MIA: Minimally invasive adenocarcinoma |
| Oral Cavity |  | EOLP: Erosive Oral lichen planus |
| LP: leukoplakia |
| NEOLP: Non-erosive oral lichen planus |
| OSCC: Oral squamous cell carcinoma |
| Prostate |  | BPH: Benign Prostatic Hyperplasia |
| Skin | 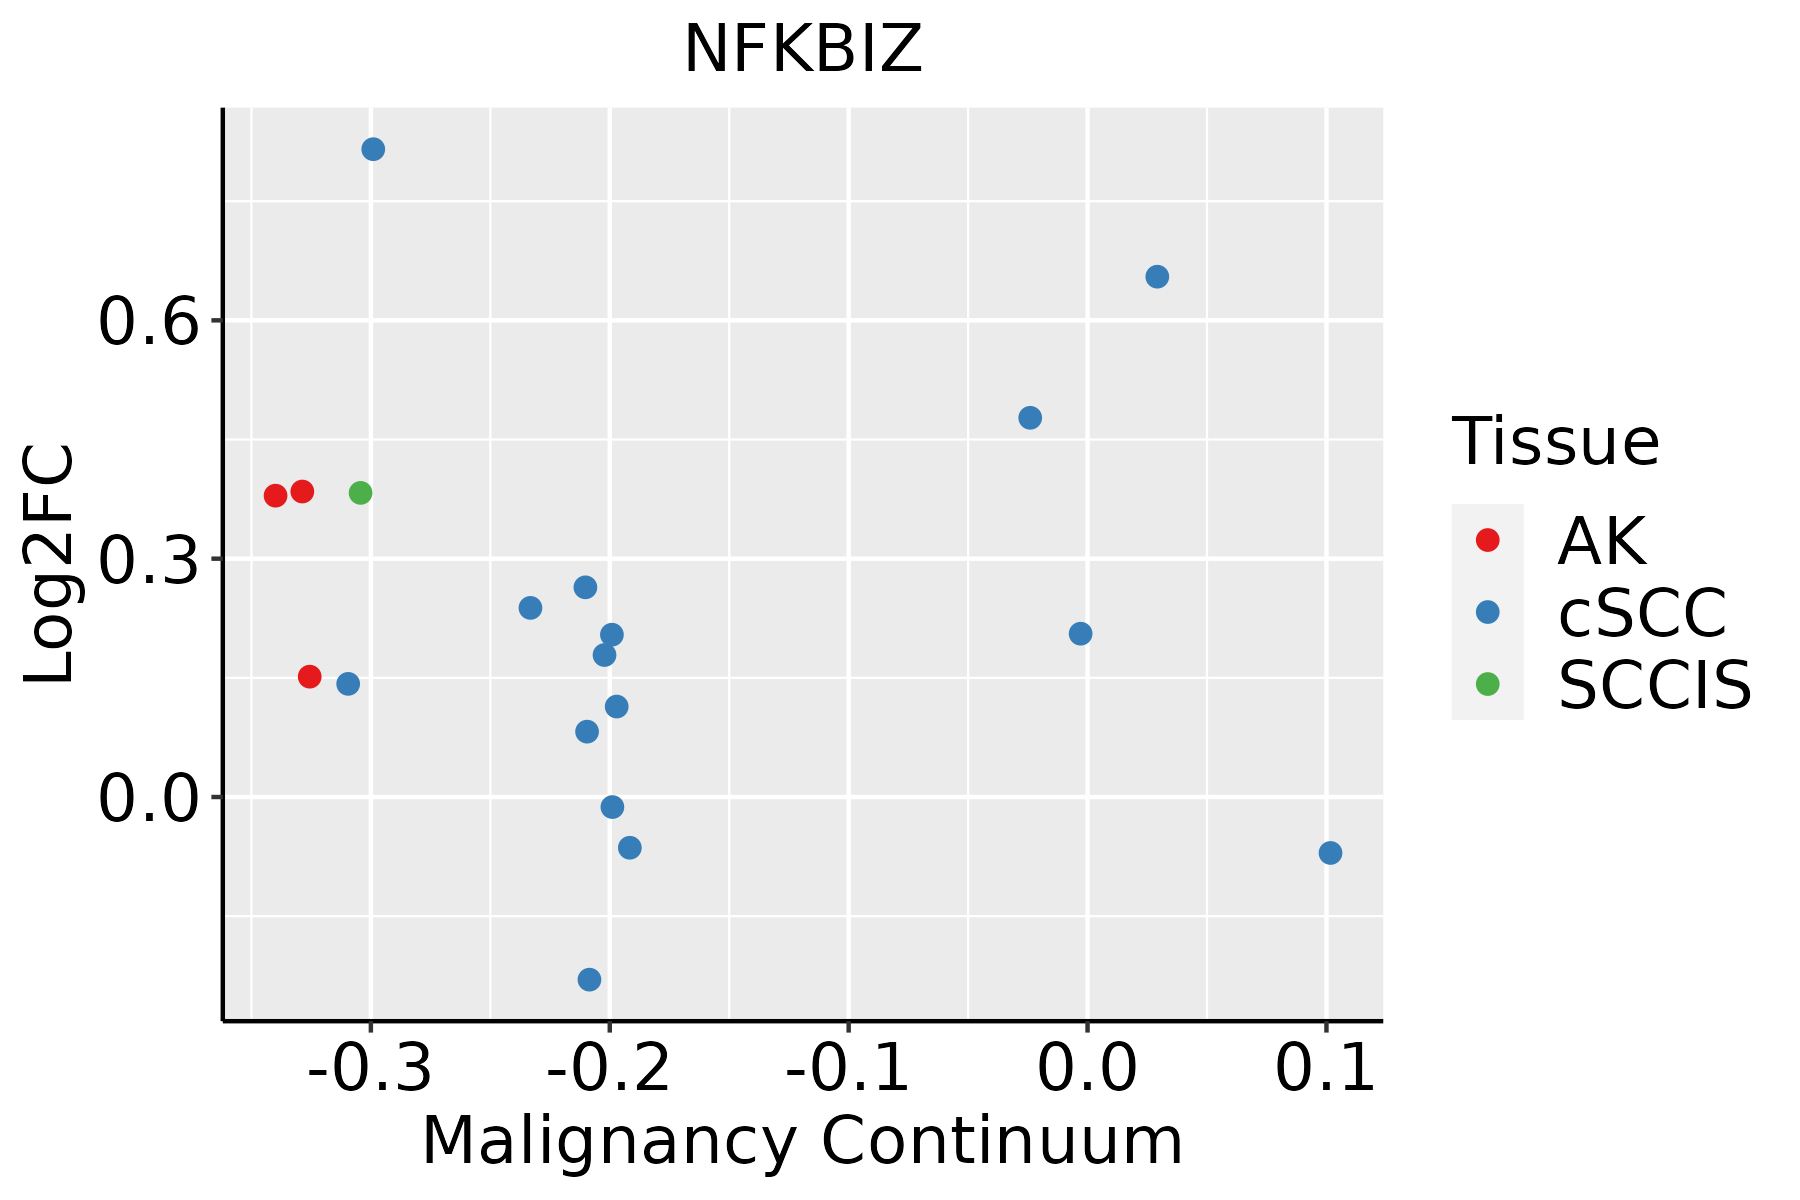 | AK: Actinic keratosis |
| cSCC: Cutaneous squamous cell carcinoma |
| SCCIS:squamous cell carcinoma in situ |
| Thyroid | 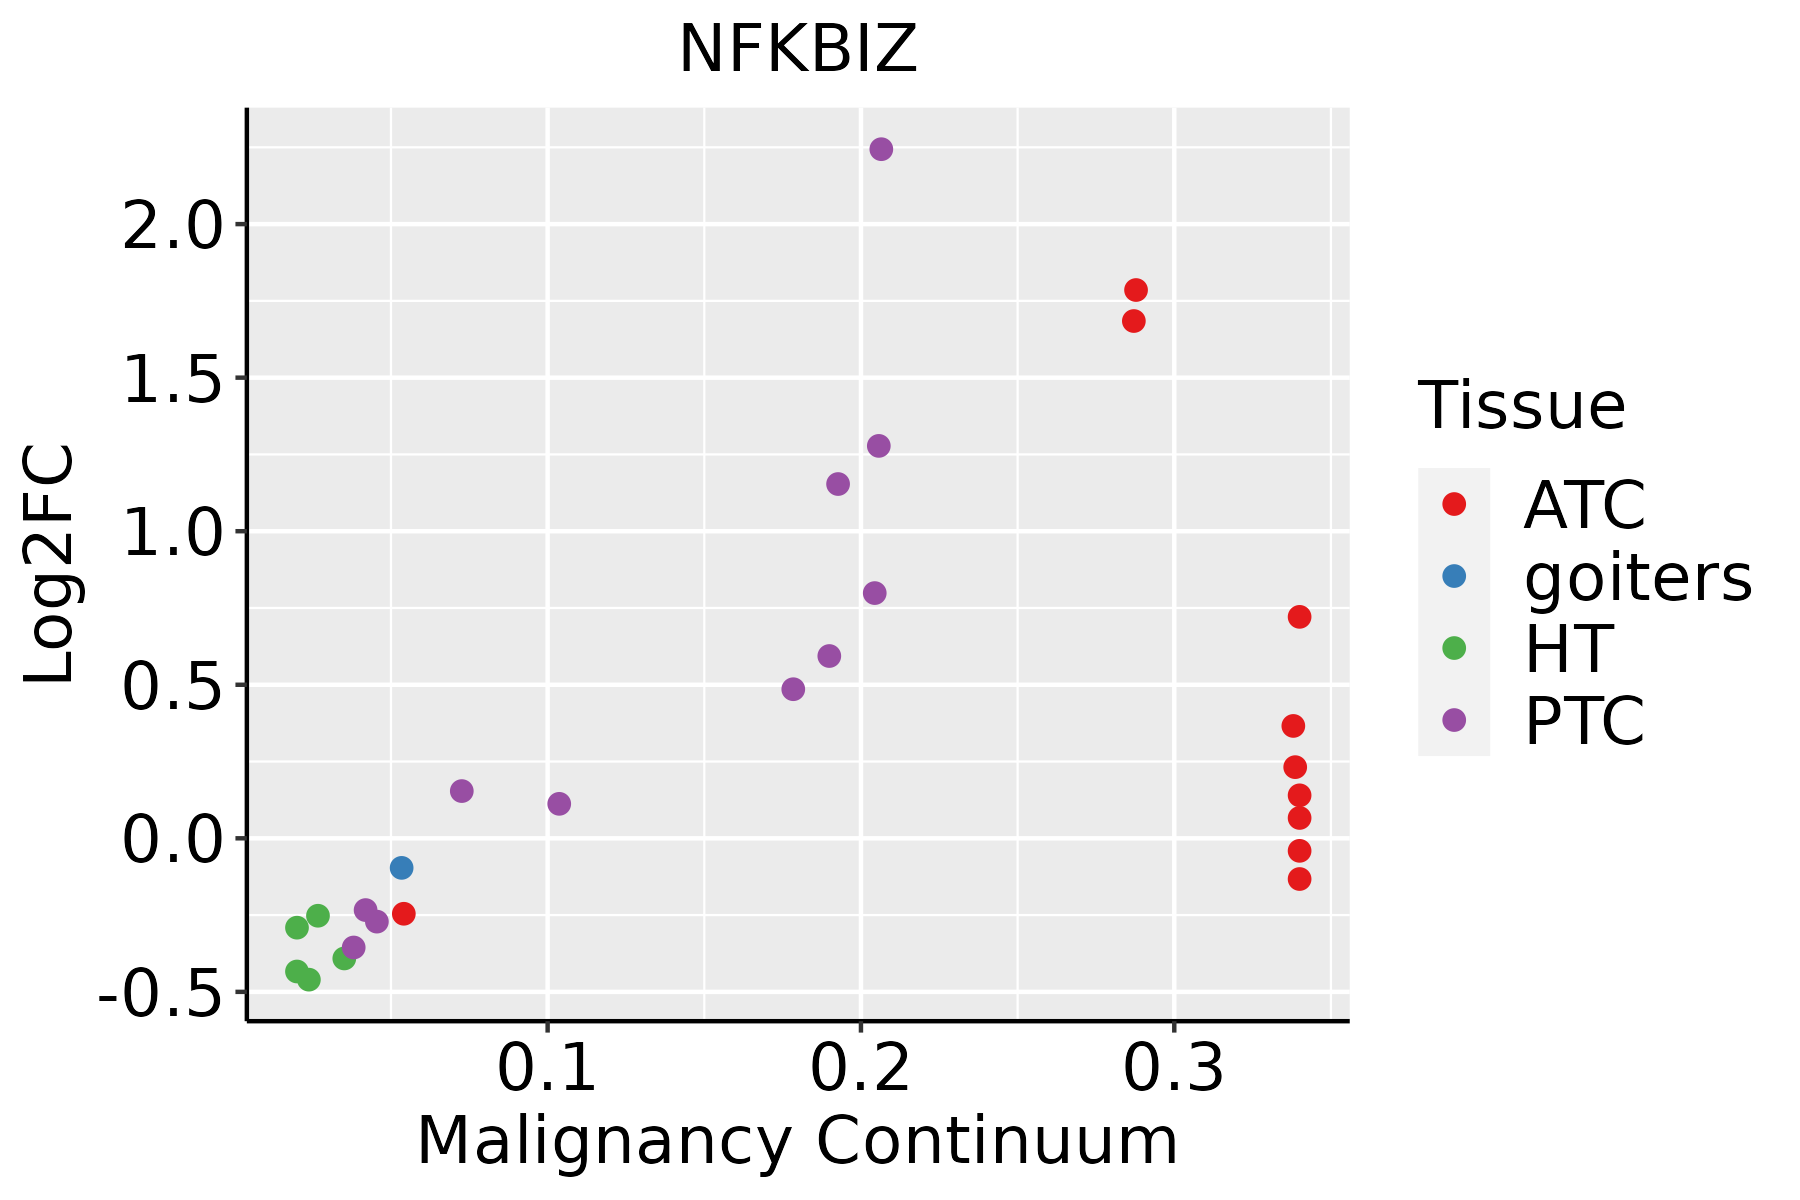 | ATC: Anaplastic thyroid cancer |
| HT: Hashimoto's thyroiditis |
| PTC: Papillary thyroid cancer |
| GO ID | Tissue | Disease Stage | Description | Gene Ratio | Bg Ratio | pvalue | p.adjust | Count |
| GO:19031314 | Cervix | CC | mononuclear cell differentiation | 76/2311 | 426/18723 | 5.66e-04 | 5.42e-03 | 76 |
| GO:00456192 | Cervix | CC | regulation of lymphocyte differentiation | 37/2311 | 174/18723 | 6.06e-04 | 5.69e-03 | 37 |
| GO:0002768 | Cervix | CC | immune response-regulating cell surface receptor signaling pathway | 59/2311 | 315/18723 | 6.64e-04 | 6.11e-03 | 59 |
| GO:00466342 | Cervix | CC | regulation of alpha-beta T cell activation | 25/2311 | 104/18723 | 7.13e-04 | 6.46e-03 | 25 |
| GO:00026973 | Cervix | CC | regulation of immune effector process | 62/2311 | 339/18723 | 9.25e-04 | 7.84e-03 | 62 |
| GO:00026967 | Cervix | CC | positive regulation of leukocyte activation | 72/2311 | 409/18723 | 1.13e-03 | 9.31e-03 | 72 |
| GO:00512516 | Cervix | CC | positive regulation of lymphocyte activation | 65/2311 | 362/18723 | 1.15e-03 | 9.39e-03 | 65 |
| GO:00508676 | Cervix | CC | positive regulation of cell activation | 73/2311 | 420/18723 | 1.50e-03 | 1.16e-02 | 73 |
| GO:00508524 | Cervix | CC | T cell receptor signaling pathway | 27/2311 | 123/18723 | 1.93e-03 | 1.42e-02 | 27 |
| GO:00466353 | Cervix | CC | positive regulation of alpha-beta T cell activation | 17/2311 | 67/18723 | 2.62e-03 | 1.81e-02 | 17 |
| GO:00024603 | Cervix | CC | adaptive immune response based on somatic recombination of immune receptors built from immunoglobulin superfamily domains | 62/2311 | 356/18723 | 3.09e-03 | 2.03e-02 | 62 |
| GO:0002263 | Cervix | CC | cell activation involved in immune response | 50/2311 | 279/18723 | 4.16e-03 | 2.57e-02 | 50 |
| GO:0002699 | Cervix | CC | positive regulation of immune effector process | 43/2311 | 235/18723 | 5.13e-03 | 3.02e-02 | 43 |
| GO:0002819 | Cervix | CC | regulation of adaptive immune response | 35/2311 | 183/18723 | 5.38e-03 | 3.11e-02 | 35 |
| GO:00300981 | Cervix | CC | lymphocyte differentiation | 63/2311 | 374/18723 | 6.21e-03 | 3.52e-02 | 63 |
| GO:0002822 | Cervix | CC | regulation of adaptive immune response based on somatic recombination of immune receptors built from immunoglobulin superfamily domains | 32/2311 | 168/18723 | 8.00e-03 | 4.18e-02 | 32 |
| GO:00466312 | Cervix | CC | alpha-beta T cell activation | 30/2311 | 156/18723 | 8.73e-03 | 4.48e-02 | 30 |
| GO:19021073 | Cervix | CC | positive regulation of leukocyte differentiation | 30/2311 | 157/18723 | 9.56e-03 | 4.73e-02 | 30 |
| GO:19037083 | Cervix | CC | positive regulation of hemopoiesis | 30/2311 | 157/18723 | 9.56e-03 | 4.73e-02 | 30 |
| GO:004578515 | Cervix | HSIL_HPV | positive regulation of cell adhesion | 48/737 | 437/18723 | 1.37e-10 | 4.72e-08 | 48 |
| Pathway ID | Tissue | Disease Stage | Description | Gene Ratio | Bg Ratio | pvalue | p.adjust | qvalue | Count |
| hsa052028 | Esophagus | ESCC | Transcriptional misregulation in cancer | 116/4205 | 193/8465 | 2.08e-03 | 5.95e-03 | 3.05e-03 | 116 |
| hsa0520213 | Esophagus | ESCC | Transcriptional misregulation in cancer | 116/4205 | 193/8465 | 2.08e-03 | 5.95e-03 | 3.05e-03 | 116 |
| hsa052026 | Lung | IAC | Transcriptional misregulation in cancer | 40/1053 | 193/8465 | 6.90e-04 | 5.90e-03 | 3.92e-03 | 40 |
| hsa0520211 | Lung | IAC | Transcriptional misregulation in cancer | 40/1053 | 193/8465 | 6.90e-04 | 5.90e-03 | 3.92e-03 | 40 |
| hsa052022 | Lung | AIS | Transcriptional misregulation in cancer | 39/961 | 193/8465 | 2.15e-04 | 2.41e-03 | 1.54e-03 | 39 |
| hsa052023 | Lung | AIS | Transcriptional misregulation in cancer | 39/961 | 193/8465 | 2.15e-04 | 2.41e-03 | 1.54e-03 | 39 |
| hsa052024 | Lung | MIAC | Transcriptional misregulation in cancer | 22/507 | 193/8465 | 2.64e-03 | 2.26e-02 | 1.64e-02 | 22 |
| hsa052025 | Lung | MIAC | Transcriptional misregulation in cancer | 22/507 | 193/8465 | 2.64e-03 | 2.26e-02 | 1.64e-02 | 22 |
| hsa052027 | Prostate | BPH | Transcriptional misregulation in cancer | 53/1718 | 193/8465 | 9.56e-03 | 2.92e-02 | 1.81e-02 | 53 |
| hsa0520212 | Prostate | BPH | Transcriptional misregulation in cancer | 53/1718 | 193/8465 | 9.56e-03 | 2.92e-02 | 1.81e-02 | 53 |
| hsa0520221 | Prostate | Tumor | Transcriptional misregulation in cancer | 59/1791 | 193/8465 | 1.22e-03 | 5.26e-03 | 3.26e-03 | 59 |
| hsa0520231 | Prostate | Tumor | Transcriptional misregulation in cancer | 59/1791 | 193/8465 | 1.22e-03 | 5.26e-03 | 3.26e-03 | 59 |
| Hugo Symbol | Variant Class | Variant Classification | dbSNP RS | HGVSc | HGVSp | HGVSp Short | SWISSPROT | BIOTYPE | SIFT | PolyPhen | Tumor Sample Barcode | Tissue | Histology | Sex | Age | Stage | Therapy Types | Drugs | Outcome |
| NFKBIZ | SNV | Missense_Mutation | | c.727N>C | p.Val243Leu | p.V243L | Q9BYH8 | protein_coding | deleterious_low_confidence(0.03) | benign(0.015) | TCGA-A2-A0CX-01 | Breast | breast invasive carcinoma | Female | <65 | I/II | Chemotherapy | adriamycin | SD |
| NFKBIZ | SNV | Missense_Mutation | | c.1165G>C | p.Glu389Gln | p.E389Q | Q9BYH8 | protein_coding | tolerated(0.29) | benign(0.056) | TCGA-A2-A0YK-01 | Breast | breast invasive carcinoma | Female | <65 | I/II | Chemotherapy | cytoxan | SD |
| NFKBIZ | SNV | Missense_Mutation | novel | c.876N>C | p.Gln292His | p.Q292H | Q9BYH8 | protein_coding | deleterious_low_confidence(0) | possibly_damaging(0.671) | TCGA-A7-A4SA-01 | Breast | breast invasive carcinoma | Female | <65 | I/II | Chemotherapy | doxorubicin | CR |
| NFKBIZ | SNV | Missense_Mutation | novel | c.1100A>G | p.Asn367Ser | p.N367S | Q9BYH8 | protein_coding | tolerated_low_confidence(0.65) | benign(0) | TCGA-A8-A09D-01 | Breast | breast invasive carcinoma | Female | <65 | I/II | Chemotherapy | doxorubicin | CR |
| NFKBIZ | SNV | Missense_Mutation | novel | c.2083G>A | p.Asp695Asn | p.D695N | Q9BYH8 | protein_coding | tolerated(0.06) | probably_damaging(0.914) | TCGA-AR-A2LE-01 | Breast | breast invasive carcinoma | Female | >=65 | I/II | Hormone Therapy | tamoxiphen | PD |
| NFKBIZ | SNV | Missense_Mutation | | c.1621N>G | p.Gln541Glu | p.Q541E | Q9BYH8 | protein_coding | tolerated(0.06) | possibly_damaging(0.474) | TCGA-D8-A1XK-01 | Breast | breast invasive carcinoma | Female | <65 | I/II | Chemotherapy | doxorubicine+cyclophosphamide | SD |
| NFKBIZ | SNV | Missense_Mutation | | c.1445N>T | p.Ser482Ile | p.S482I | Q9BYH8 | protein_coding | deleterious(0) | probably_damaging(0.997) | TCGA-E9-A1NA-01 | Breast | breast invasive carcinoma | Female | <65 | I/II | Chemotherapy | cyclophosphamide | SD |
| NFKBIZ | SNV | Missense_Mutation | novel | c.403N>G | p.Ser135Ala | p.S135A | Q9BYH8 | protein_coding | tolerated_low_confidence(0.07) | benign(0.003) | TCGA-GM-A3NY-01 | Breast | breast invasive carcinoma | Female | >=65 | I/II | Hormone Therapy | arimidex | SD |
| NFKBIZ | insertion | Nonsense_Mutation | novel | c.1876_1877insAACATATAAGATGATATCTGTTTTGAAAGCTCCTGAAAGATTTTA | p.Leu626delinsGlnHisIleArgTerTyrLeuPheTerLysLeuLeuLysAspPheMet | p.L626delinsQHIR*YLF*KLLKDFM | Q9BYH8 | protein_coding | | | TCGA-A8-A07L-01 | Breast | breast invasive carcinoma | Female | <65 | III/IV | Chemotherapy | | CR |
| NFKBIZ | insertion | Nonsense_Mutation | novel | c.791_792insAGATTTCAGATTTTCAGATTAGGGATACTCAACTGTATTATTA | p.Pro265AspfsTer7 | p.P265Dfs*7 | Q9BYH8 | protein_coding | | | TCGA-AO-A0J2-01 | Breast | breast invasive carcinoma | Female | <65 | I/II | Chemotherapy | cyclophosphamide | SD |


