
|
|||||
|
 | |
| |
| |
| |
| |
| |
|
Gene: NDC1 |
Gene summary for NDC1 |
| Gene information | Species | Human | Gene symbol | NDC1 | Gene ID | 55706 |
| Gene name | NDC1 transmembrane nucleoporin | |
| Gene Alias | NET3 | |
| Cytomap | 1p32.3 | |
| Gene Type | protein-coding | GO ID | GO:0000003 | UniProtAcc | Q9BTX1 |
Top |
Malignant transformation analysis |
| Identification of the aberrant gene expression in precancerous and cancerous lesions by comparing the gene expression of stem-like cells in diseased tissues with normal stem cells |
| Entrez ID | Symbol | Replicates | Species | Organ | Tissue | Adj P-value | Log2FC | Malignancy |
| 55706 | NDC1 | CCI_1 | Human | Cervix | CC | 5.50e-04 | 3.25e-01 | 0.528 |
| 55706 | NDC1 | CCI_2 | Human | Cervix | CC | 4.14e-11 | 6.41e-01 | 0.5249 |
| 55706 | NDC1 | CCI_3 | Human | Cervix | CC | 3.47e-08 | 6.35e-01 | 0.516 |
| 55706 | NDC1 | LZE24T | Human | Esophagus | ESCC | 6.45e-06 | 3.22e-01 | 0.0596 |
| 55706 | NDC1 | P2T-E | Human | Esophagus | ESCC | 5.48e-15 | 2.64e-01 | 0.1177 |
| 55706 | NDC1 | P4T-E | Human | Esophagus | ESCC | 2.48e-05 | 2.65e-01 | 0.1323 |
| 55706 | NDC1 | P5T-E | Human | Esophagus | ESCC | 1.02e-12 | 3.17e-01 | 0.1327 |
| 55706 | NDC1 | P8T-E | Human | Esophagus | ESCC | 2.48e-09 | 1.17e-01 | 0.0889 |
| 55706 | NDC1 | P9T-E | Human | Esophagus | ESCC | 2.63e-02 | 1.25e-01 | 0.1131 |
| 55706 | NDC1 | P10T-E | Human | Esophagus | ESCC | 5.05e-17 | 2.97e-01 | 0.116 |
| 55706 | NDC1 | P12T-E | Human | Esophagus | ESCC | 2.57e-09 | 1.47e-01 | 0.1122 |
| 55706 | NDC1 | P15T-E | Human | Esophagus | ESCC | 2.44e-05 | 2.75e-01 | 0.1149 |
| 55706 | NDC1 | P16T-E | Human | Esophagus | ESCC | 6.26e-11 | 1.03e-01 | 0.1153 |
| 55706 | NDC1 | P19T-E | Human | Esophagus | ESCC | 2.61e-02 | 2.63e-01 | 0.1662 |
| 55706 | NDC1 | P20T-E | Human | Esophagus | ESCC | 6.17e-10 | 2.11e-01 | 0.1124 |
| 55706 | NDC1 | P21T-E | Human | Esophagus | ESCC | 3.70e-21 | 5.09e-01 | 0.1617 |
| 55706 | NDC1 | P22T-E | Human | Esophagus | ESCC | 7.79e-11 | 7.25e-02 | 0.1236 |
| 55706 | NDC1 | P23T-E | Human | Esophagus | ESCC | 1.02e-02 | 2.19e-01 | 0.108 |
| 55706 | NDC1 | P24T-E | Human | Esophagus | ESCC | 2.12e-05 | 1.53e-01 | 0.1287 |
| 55706 | NDC1 | P26T-E | Human | Esophagus | ESCC | 9.28e-14 | 2.02e-01 | 0.1276 |
| Page: 1 2 3 4 |
| Tissue | Expression Dynamics | Abbreviation |
| Cervix | 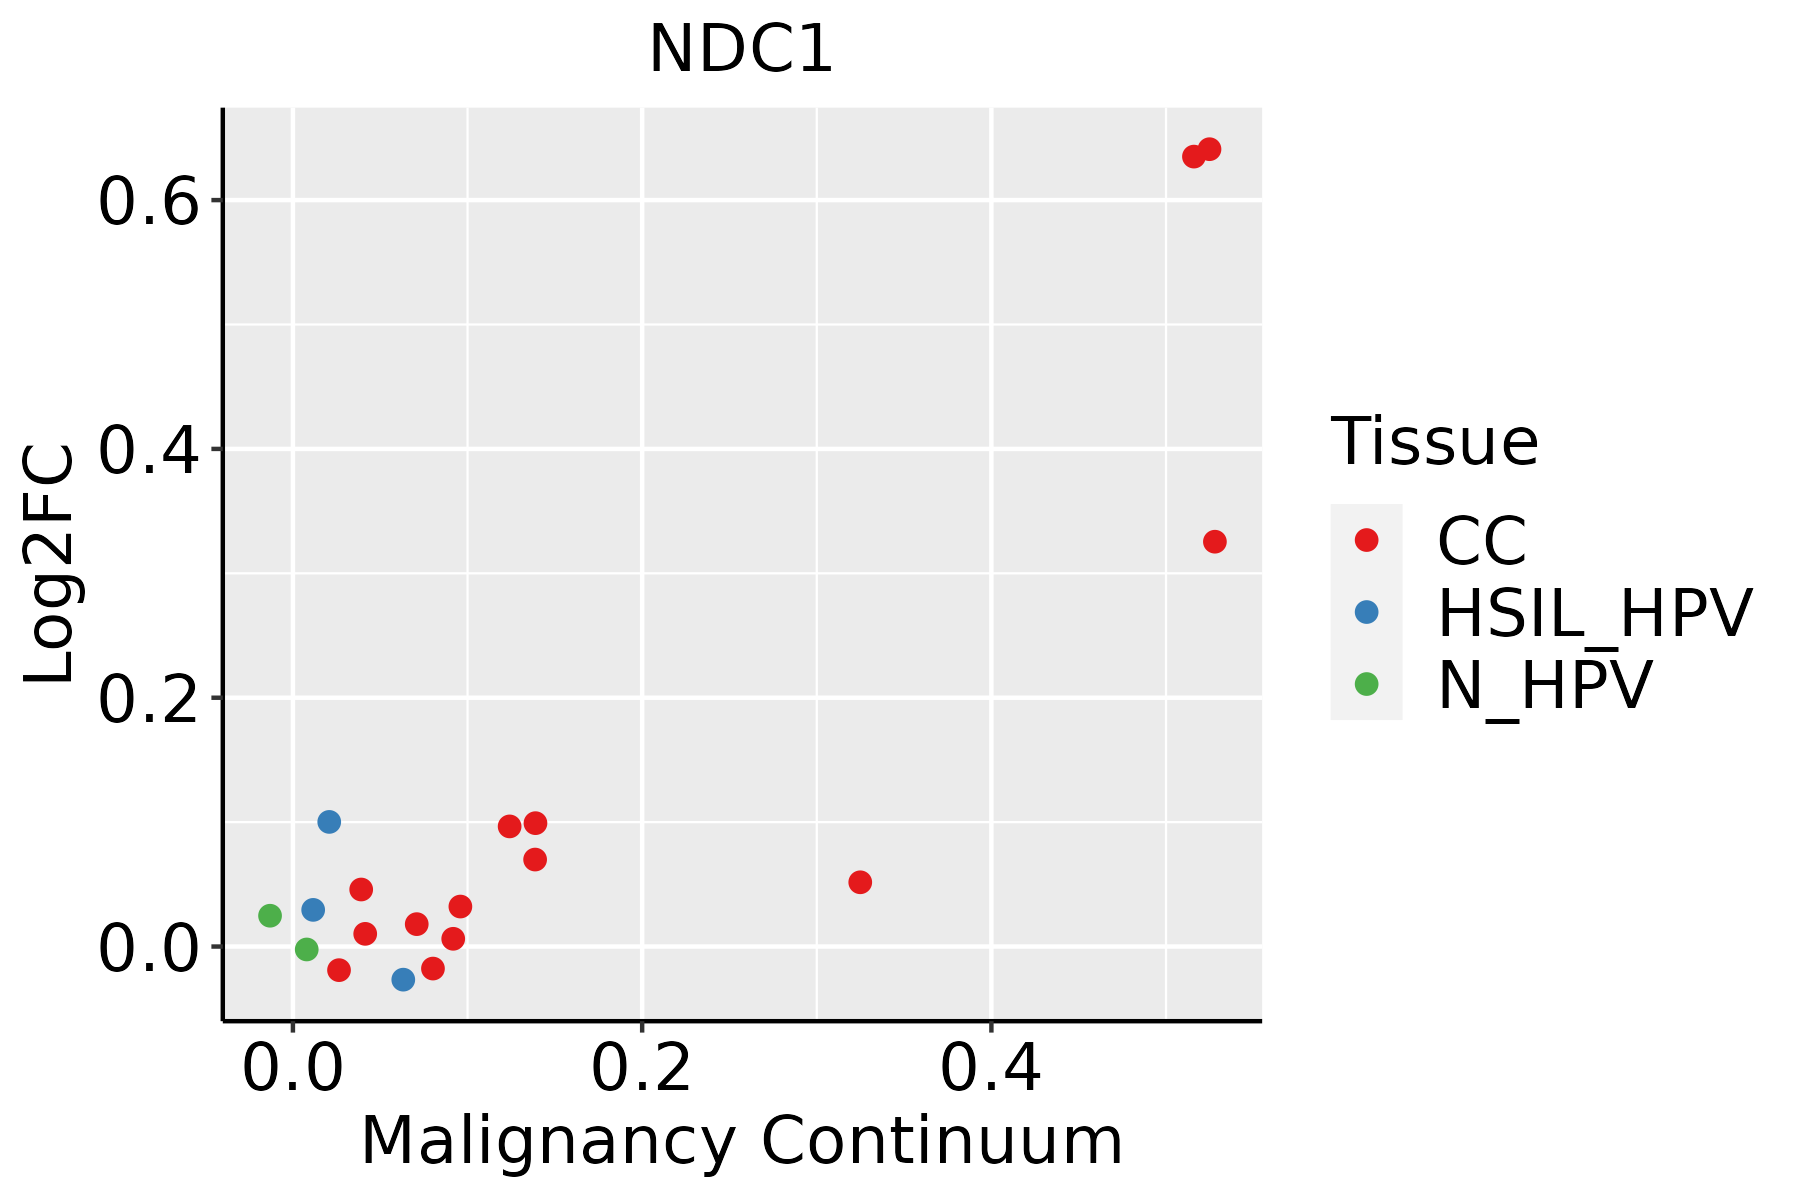 | CC: Cervix cancer |
| HSIL_HPV: HPV-infected high-grade squamous intraepithelial lesions | ||
| N_HPV: HPV-infected normal cervix | ||
| Esophagus | 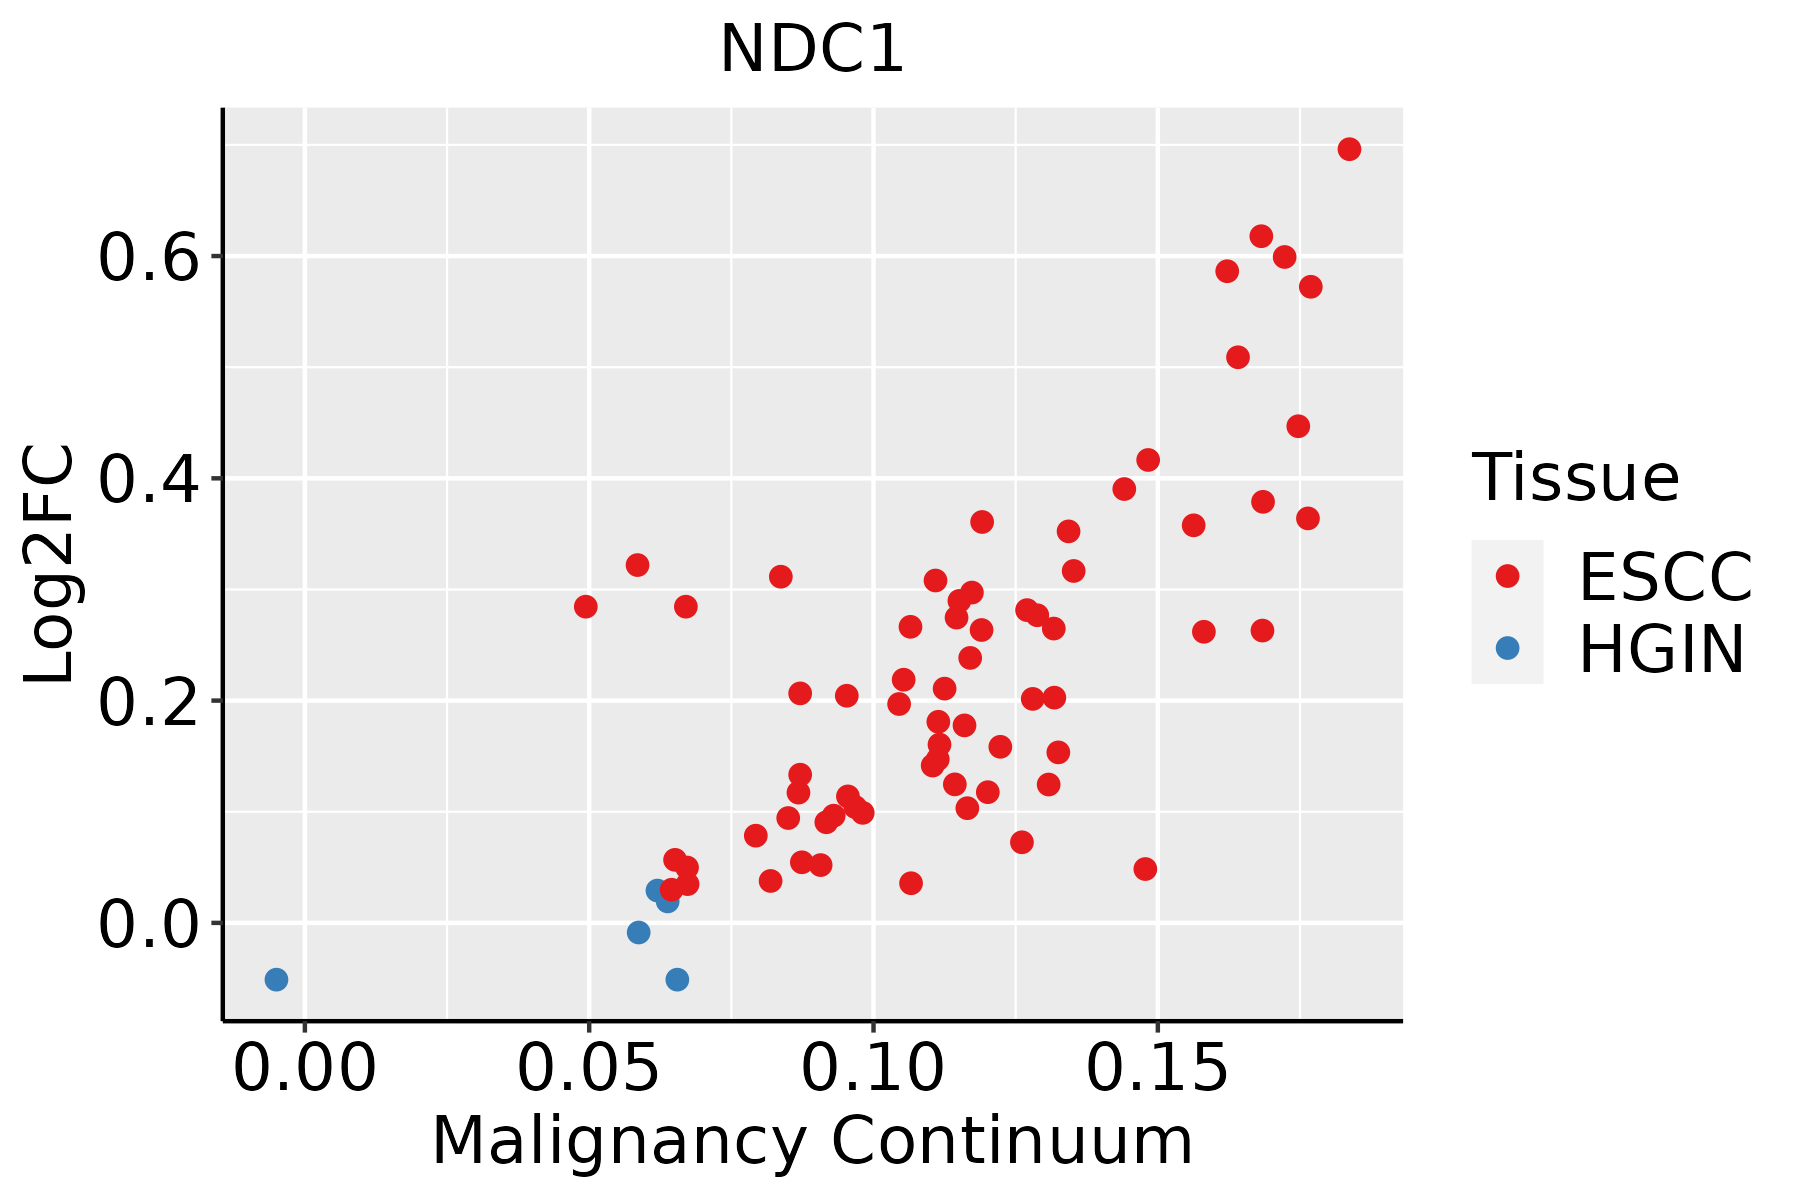 | ESCC: Esophageal squamous cell carcinoma |
| HGIN: High-grade intraepithelial neoplasias | ||
| LGIN: Low-grade intraepithelial neoplasias | ||
| Liver | 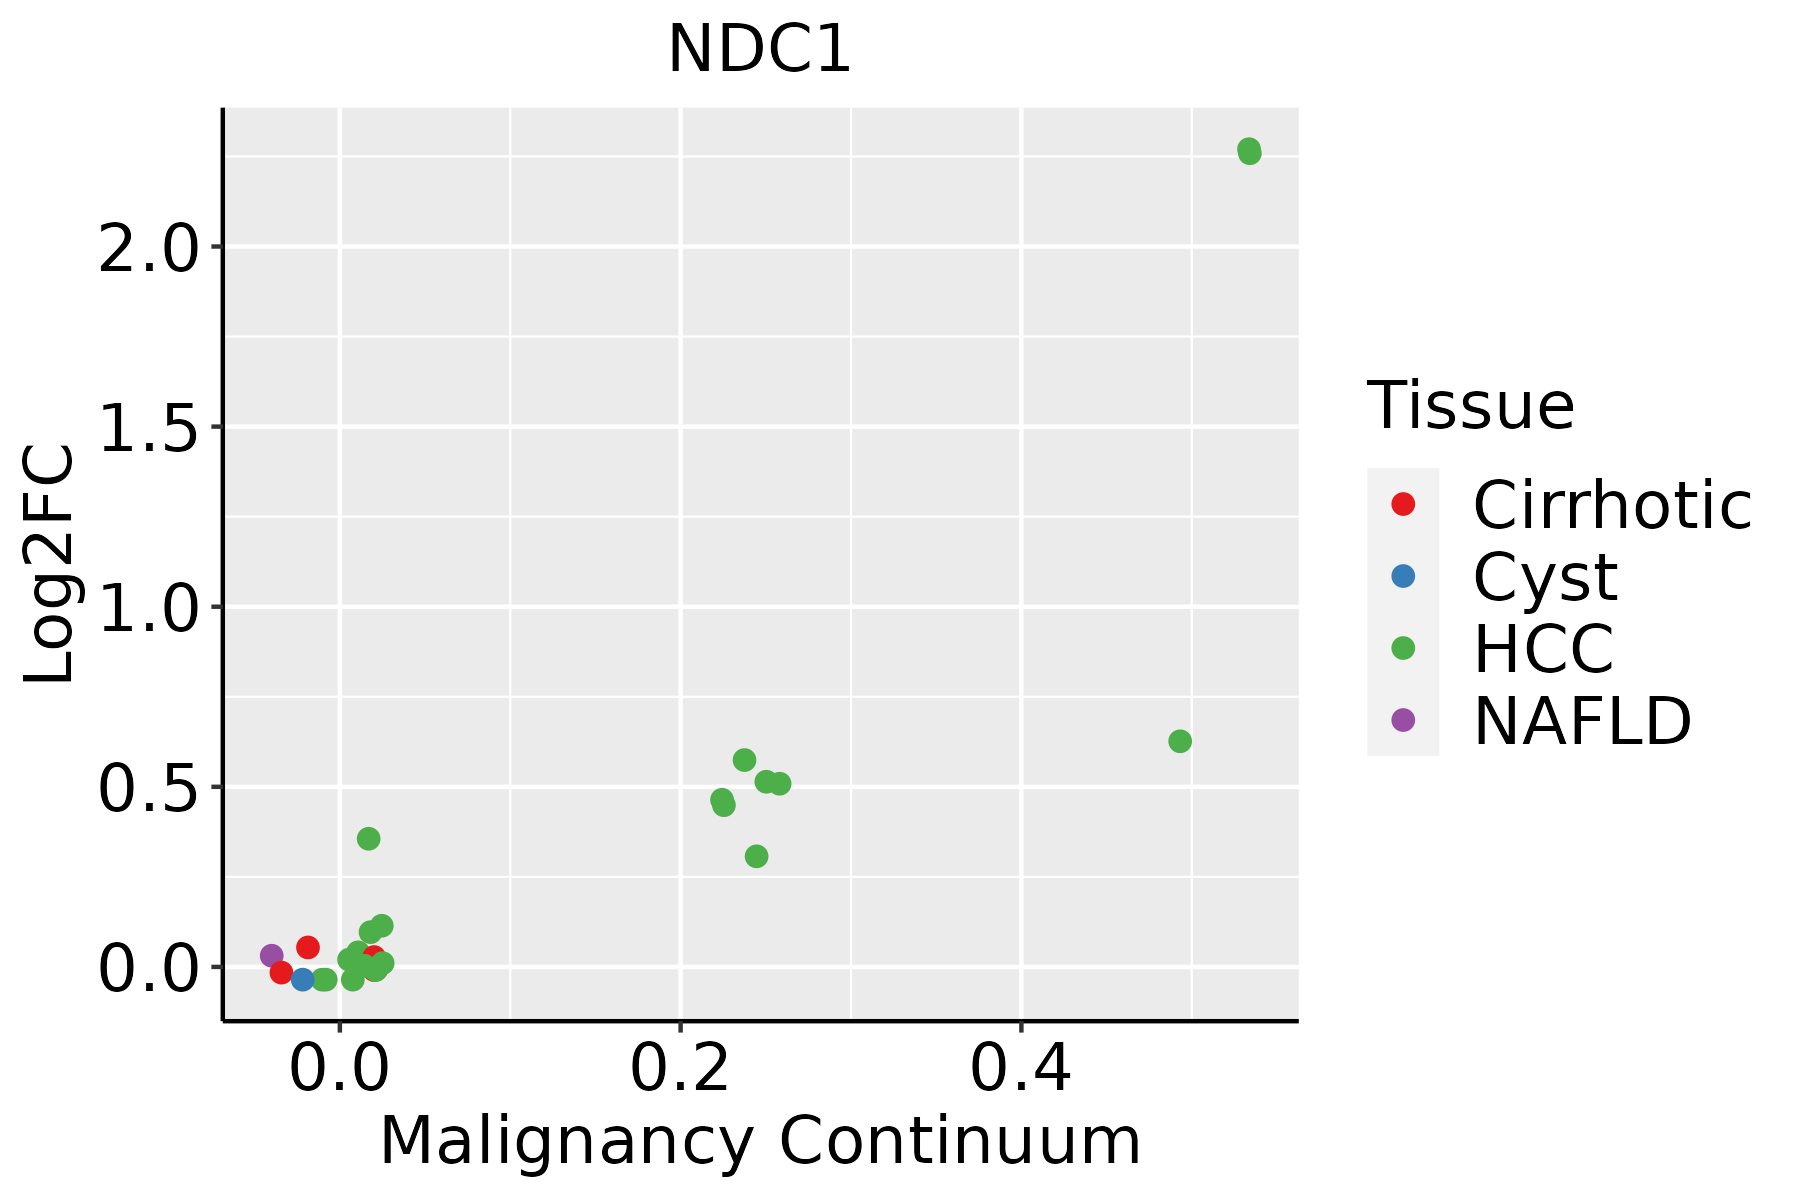 | HCC: Hepatocellular carcinoma |
| NAFLD: Non-alcoholic fatty liver disease | ||
| Oral Cavity | 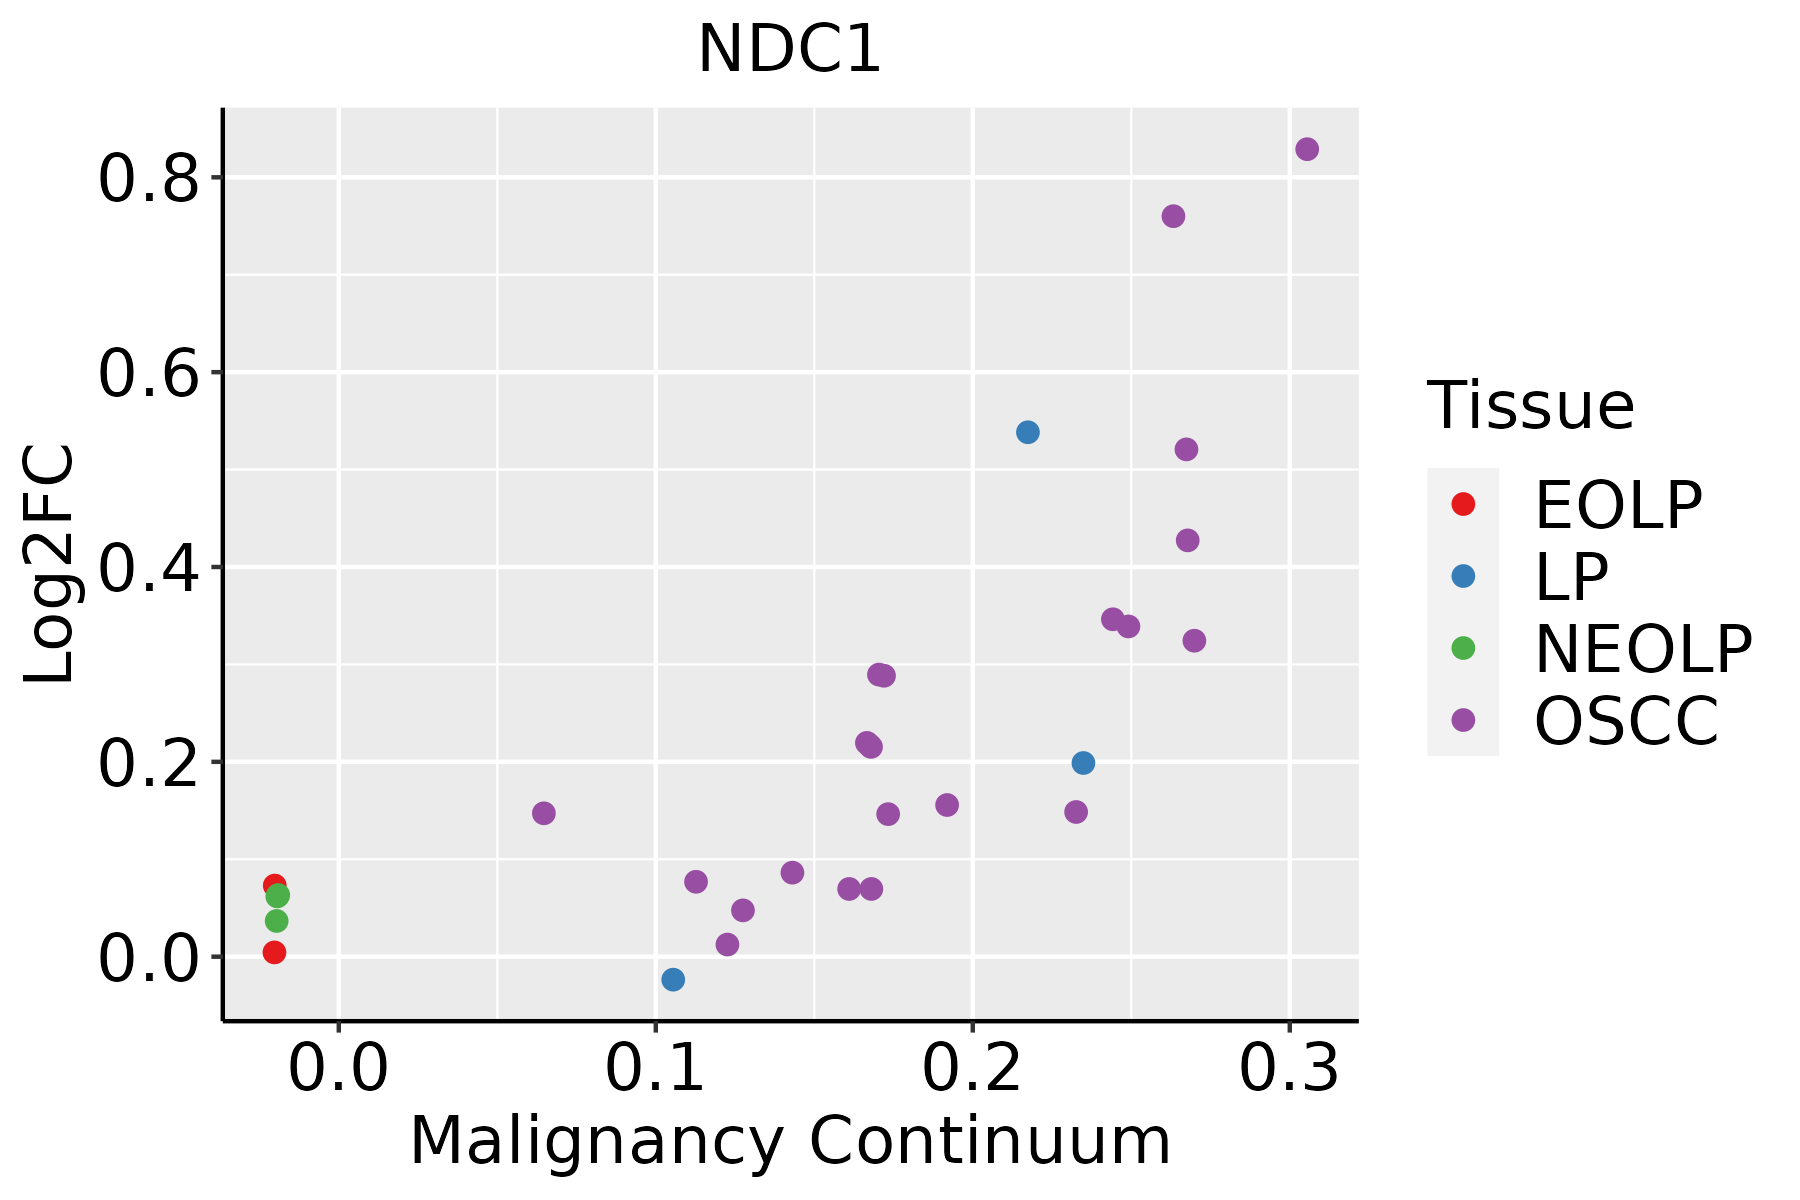 | EOLP: Erosive Oral lichen planus |
| LP: leukoplakia | ||
| NEOLP: Non-erosive oral lichen planus | ||
| OSCC: Oral squamous cell carcinoma |
| ∗log2FC in expression of this searched gene in stem-like cells from each diseased tissue sample relative to stem-like cells in normal samples in each tissue plotted against the malignancy continuum. Samples are colored based on if they are from different disease stage. |
Top |
Malignant transformation related pathway analysis |
| Find out the enriched GO biological processes and KEGG pathways involved in transition from healthy to precancer to cancer |
| Tissue | Disease Stage | Enriched GO biological Processes |
| Colorectum | AD |  |
| Colorectum | SER |  |
| Colorectum | MSS |  |
| Colorectum | MSI-H |  |
| Colorectum | FAP |  |
| ∗Top 15 enriched GO BP terms are showed in the bar plot of each disease state in each tissue. Each row represents a significant GO biological process which is colored according to the -log10(p.adjust). |
| Page: 1 2 3 4 5 6 7 8 9 |
| GO ID | Tissue | Disease Stage | Description | Gene Ratio | Bg Ratio | pvalue | p.adjust | Count |
| GO:009886915 | Endometrium | EEC | cellular oxidant detoxification | 27/2168 | 101/18723 | 2.17e-05 | 3.89e-04 | 27 |
| GO:007135615 | Endometrium | EEC | cellular response to tumor necrosis factor | 45/2168 | 229/18723 | 2.54e-04 | 2.94e-03 | 45 |
| GO:003320912 | Endometrium | EEC | tumor necrosis factor-mediated signaling pathway | 24/2168 | 99/18723 | 3.12e-04 | 3.47e-03 | 24 |
| GO:003461215 | Endometrium | EEC | response to tumor necrosis factor | 48/2168 | 253/18723 | 3.77e-04 | 4.03e-03 | 48 |
| GO:009875415 | Endometrium | EEC | detoxification | 32/2168 | 152/18723 | 5.52e-04 | 5.52e-03 | 32 |
| GO:000838026 | Esophagus | HGIN | RNA splicing | 160/2587 | 434/18723 | 3.74e-34 | 1.12e-30 | 160 |
| GO:000037520 | Esophagus | HGIN | RNA splicing, via transesterification reactions | 115/2587 | 324/18723 | 3.16e-23 | 3.80e-20 | 115 |
| GO:009719327 | Esophagus | HGIN | intrinsic apoptotic signaling pathway | 90/2587 | 288/18723 | 1.50e-14 | 2.80e-12 | 90 |
| GO:003497625 | Esophagus | HGIN | response to endoplasmic reticulum stress | 81/2587 | 256/18723 | 1.47e-13 | 2.32e-11 | 81 |
| GO:200124227 | Esophagus | HGIN | regulation of intrinsic apoptotic signaling pathway | 58/2587 | 164/18723 | 2.57e-12 | 3.58e-10 | 58 |
| GO:200123327 | Esophagus | HGIN | regulation of apoptotic signaling pathway | 97/2587 | 356/18723 | 1.36e-11 | 1.57e-09 | 97 |
| GO:190589725 | Esophagus | HGIN | regulation of response to endoplasmic reticulum stress | 31/2587 | 82/18723 | 5.25e-08 | 2.91e-06 | 31 |
| GO:007005920 | Esophagus | HGIN | intrinsic apoptotic signaling pathway in response to endoplasmic reticulum stress | 25/2587 | 63/18723 | 3.41e-07 | 1.57e-05 | 25 |
| GO:200123427 | Esophagus | HGIN | negative regulation of apoptotic signaling pathway | 59/2587 | 224/18723 | 4.68e-07 | 2.07e-05 | 59 |
| GO:200124325 | Esophagus | HGIN | negative regulation of intrinsic apoptotic signaling pathway | 33/2587 | 98/18723 | 4.73e-07 | 2.07e-05 | 33 |
| GO:19022359 | Esophagus | HGIN | regulation of endoplasmic reticulum stress-induced intrinsic apoptotic signaling pathway | 15/2587 | 32/18723 | 6.76e-06 | 2.08e-04 | 15 |
| GO:190357320 | Esophagus | HGIN | negative regulation of response to endoplasmic reticulum stress | 18/2587 | 44/18723 | 8.97e-06 | 2.64e-04 | 18 |
| GO:190223620 | Esophagus | HGIN | negative regulation of endoplasmic reticulum stress-induced intrinsic apoptotic signaling pathway | 11/2587 | 20/18723 | 1.73e-05 | 4.71e-04 | 11 |
| GO:0008380111 | Esophagus | ESCC | RNA splicing | 336/8552 | 434/18723 | 1.74e-42 | 3.67e-39 | 336 |
| GO:0000375111 | Esophagus | ESCC | RNA splicing, via transesterification reactions | 248/8552 | 324/18723 | 3.05e-30 | 1.49e-27 | 248 |
| Page: 1 2 3 4 5 6 7 8 9 10 11 12 13 14 15 16 17 18 19 20 |
| Pathway ID | Tissue | Disease Stage | Description | Gene Ratio | Bg Ratio | pvalue | p.adjust | qvalue | Count |
| hsa0501418 | Cervix | CC | Amyotrophic lateral sclerosis | 103/1267 | 364/8465 | 1.79e-11 | 4.47e-10 | 2.64e-10 | 103 |
| hsa0501419 | Cervix | CC | Amyotrophic lateral sclerosis | 103/1267 | 364/8465 | 1.79e-11 | 4.47e-10 | 2.64e-10 | 103 |
| hsa05014210 | Esophagus | ESCC | Amyotrophic lateral sclerosis | 266/4205 | 364/8465 | 1.31e-20 | 2.20e-18 | 1.13e-18 | 266 |
| hsa0501438 | Esophagus | ESCC | Amyotrophic lateral sclerosis | 266/4205 | 364/8465 | 1.31e-20 | 2.20e-18 | 1.13e-18 | 266 |
| hsa0501422 | Liver | HCC | Amyotrophic lateral sclerosis | 252/4020 | 364/8465 | 8.85e-18 | 7.41e-16 | 4.12e-16 | 252 |
| hsa03013 | Liver | HCC | Nucleocytoplasmic transport | 81/4020 | 108/8465 | 4.28e-09 | 6.83e-08 | 3.80e-08 | 81 |
| hsa0501432 | Liver | HCC | Amyotrophic lateral sclerosis | 252/4020 | 364/8465 | 8.85e-18 | 7.41e-16 | 4.12e-16 | 252 |
| hsa030131 | Liver | HCC | Nucleocytoplasmic transport | 81/4020 | 108/8465 | 4.28e-09 | 6.83e-08 | 3.80e-08 | 81 |
| hsa0501428 | Oral cavity | OSCC | Amyotrophic lateral sclerosis | 246/3704 | 364/8465 | 6.65e-21 | 1.11e-18 | 5.67e-19 | 246 |
| hsa030136 | Oral cavity | OSCC | Nucleocytoplasmic transport | 82/3704 | 108/8465 | 7.93e-12 | 1.33e-10 | 6.77e-11 | 82 |
| hsa05014112 | Oral cavity | OSCC | Amyotrophic lateral sclerosis | 246/3704 | 364/8465 | 6.65e-21 | 1.11e-18 | 5.67e-19 | 246 |
| hsa0301311 | Oral cavity | OSCC | Nucleocytoplasmic transport | 82/3704 | 108/8465 | 7.93e-12 | 1.33e-10 | 6.77e-11 | 82 |
| hsa0501429 | Oral cavity | LP | Amyotrophic lateral sclerosis | 197/2418 | 364/8465 | 1.25e-25 | 1.39e-23 | 8.93e-24 | 197 |
| hsa030132 | Oral cavity | LP | Nucleocytoplasmic transport | 53/2418 | 108/8465 | 4.68e-06 | 4.10e-05 | 2.64e-05 | 53 |
| hsa0501437 | Oral cavity | LP | Amyotrophic lateral sclerosis | 197/2418 | 364/8465 | 1.25e-25 | 1.39e-23 | 8.93e-24 | 197 |
| hsa030133 | Oral cavity | LP | Nucleocytoplasmic transport | 53/2418 | 108/8465 | 4.68e-06 | 4.10e-05 | 2.64e-05 | 53 |
| Page: 1 |
Top |
Cell-cell communication analysis |
| Identification of potential cell-cell interactions between two cell types and their ligand-receptor pairs for different disease states |
| Ligand | Receptor | LRpair | Pathway | Tissue | Disease Stage |
| Page: 1 |
Top |
Single-cell gene regulatory network inference analysis |
| Find out the significant the regulons (TFs) and the target genes of each regulon across cell types for different disease states |
| TF | Cell Type | Tissue | Disease Stage | Target Gene | RSS | Regulon Activity |
| ∗The dot plots of a searched regulon are shown for all cell subpopulations in each disease state of each tissue based on the regulon specific score inferred using pySCENIC and by calculating the average expression. |
| Page: 1 |
Top |
Somatic mutation of malignant transformation related genes |
| Annotation of somatic variants for genes involved in malignant transformation |
| Hugo Symbol | Variant Class | Variant Classification | dbSNP RS | HGVSc | HGVSp | HGVSp Short | SWISSPROT | BIOTYPE | SIFT | PolyPhen | Tumor Sample Barcode | Tissue | Histology | Sex | Age | Stage | Therapy Types | Drugs | Outcome |
| NDC1 | SNV | Missense_Mutation | c.2019A>C | p.Lys673Asn | p.K673N | Q9BTX1 | protein_coding | deleterious(0) | probably_damaging(0.992) | TCGA-AC-A23H-01 | Breast | breast invasive carcinoma | Female | >=65 | I/II | Unknown | Unknown | PD | |
| NDC1 | SNV | Missense_Mutation | c.978C>G | p.Ile326Met | p.I326M | Q9BTX1 | protein_coding | deleterious(0) | probably_damaging(0.91) | TCGA-AC-A23H-01 | Breast | breast invasive carcinoma | Female | >=65 | I/II | Unknown | Unknown | PD | |
| NDC1 | SNV | Missense_Mutation | novel | c.1807G>A | p.Asp603Asn | p.D603N | Q9BTX1 | protein_coding | deleterious(0) | benign(0.136) | TCGA-AN-A046-01 | Breast | breast invasive carcinoma | Female | >=65 | I/II | Unknown | Unknown | SD |
| NDC1 | SNV | Missense_Mutation | novel | c.1720G>A | p.Ala574Thr | p.A574T | Q9BTX1 | protein_coding | deleterious(0) | probably_damaging(0.999) | TCGA-AN-A046-01 | Breast | breast invasive carcinoma | Female | >=65 | I/II | Unknown | Unknown | SD |
| NDC1 | SNV | Missense_Mutation | c.426T>G | p.Phe142Leu | p.F142L | Q9BTX1 | protein_coding | tolerated(0.51) | benign(0.009) | TCGA-BH-A0B1-01 | Breast | breast invasive carcinoma | Female | >=65 | I/II | Chemotherapy | adriamycin | SD | |
| NDC1 | SNV | Missense_Mutation | c.797A>C | p.Asn266Thr | p.N266T | Q9BTX1 | protein_coding | deleterious(0.01) | possibly_damaging(0.816) | TCGA-FU-A3HZ-01 | Cervix | cervical & endocervical cancer | Female | <65 | I/II | Chemotherapy | cisplatin | CR | |
| NDC1 | SNV | Missense_Mutation | c.1050C>G | p.Phe350Leu | p.F350L | Q9BTX1 | protein_coding | deleterious(0) | probably_damaging(0.983) | TCGA-Q1-A73O-01 | Cervix | cervical & endocervical cancer | Female | <65 | I/II | Chemotherapy | cisplatin | CR | |
| NDC1 | SNV | Missense_Mutation | c.125T>C | p.Val42Ala | p.V42A | Q9BTX1 | protein_coding | tolerated(0.49) | benign(0.005) | TCGA-AA-3510-01 | Colorectum | colon adenocarcinoma | Male | >=65 | I/II | Unknown | Unknown | SD | |
| NDC1 | SNV | Missense_Mutation | novel | c.1807N>A | p.Asp603Asn | p.D603N | Q9BTX1 | protein_coding | deleterious(0) | benign(0.136) | TCGA-AA-3984-01 | Colorectum | colon adenocarcinoma | Female | <65 | I/II | Unknown | Unknown | SD |
| NDC1 | SNV | Missense_Mutation | c.859T>C | p.Ser287Pro | p.S287P | Q9BTX1 | protein_coding | deleterious(0.03) | possibly_damaging(0.658) | TCGA-AD-5900-01 | Colorectum | colon adenocarcinoma | Male | >=65 | I/II | Unknown | Unknown | SD |
| Page: 1 2 3 4 5 6 |
Top |
Related drugs of malignant transformation related genes |
| Identification of chemicals and drugs interact with genes involved in malignant transfromation |
| (DGIdb 4.0) |
| Entrez ID | Symbol | Category | Interaction Types | Drug Claim Name | Drug Name | PMIDs |
| Page: 1 |

Copyright 2023-Present -The University of Texas Health Science Center at Houston |