Schematic overview of the cellular and molecular mechanisms involved in the cancer progression, including the proposed cellular and molecular mechanisms in cancer cells trajectory. AT1: alveolar type 1 cells; AT2: alveolar type 2 cells; AAH: atypical adenomatous hyperplasia; AIS: adenocarcinoma in situ; MIA: minimally invasive adenocarcinoma; IA: invasive adenocarcinoma; EMT: epithelial-mesenchymal transition

Home

Download

Statistics

Help

Contact

Center for Computational Systems Medicine
leaf

Gene summary

leaf

Malignant transformation analysis

leaf

Malignant transformation related pathway analysis

leaf

Cell-cell communication analysis

leaf

Single-cell gene regulatory network inference analysis

leaf

Somatic mutation of malignant transformation related genes

leaf

Related drugs of malignant transformation related genes

Gene: NASP

Gene summary for NASP

check button Gene summary.

Gene informationSpeciesHuman
Gene symbol

NASP

Gene ID

4678

Gene namenuclear autoantigenic sperm protein
Gene AliasFLB7527
Cytomap1p34.1
Gene Typeprotein-coding
GO ID

GO:0000003

UniProtAcc

P49321


Top

Malignant transformation analysis

check button Identification of the aberrant gene expression in precancerous and cancerous lesions by comparing the gene expression of stem-like cells in diseased tissues with normal stem cells
check button Malignant transformation involving gene list.
Entrez IDSymbolReplicatesSpeciesOrganTissueAdj P-valueLog2FCMalignancy
4678NASPHTA11_1391_2000001011HumanColorectumAD1.33e-034.86e-01-0.059
4678NASPHTA11_99999970781_79442HumanColorectumMSS2.94e-064.24e-010.294
4678NASPA015-C-203HumanColorectumFAP4.40e-031.11e-01-0.1294
4678NASPA002-C-205HumanColorectumFAP1.74e-022.18e-01-0.1236
4678NASPA015-C-104HumanColorectumFAP2.15e-041.20e-01-0.1899
4678NASPA002-C-016HumanColorectumFAP3.61e-023.13e-020.0521
4678NASPA002-C-116HumanColorectumFAP1.84e-048.74e-02-0.0452
4678NASPF034HumanColorectumFAP3.38e-032.13e-01-0.0665
4678NASPAEH-subject1HumanEndometriumAEH1.98e-031.99e-01-0.3059
4678NASPAEH-subject2HumanEndometriumAEH1.71e-05-1.17e-01-0.2525
4678NASPAEH-subject3HumanEndometriumAEH5.48e-04-2.11e-02-0.2576
4678NASPAEH-subject5HumanEndometriumAEH6.85e-05-2.09e-01-0.2953
4678NASPEEC-subject1HumanEndometriumEEC5.27e-05-3.62e-02-0.2682
4678NASPEEC-subject3HumanEndometriumEEC3.53e-20-2.58e-01-0.2525
4678NASPEEC-subject5HumanEndometriumEEC2.13e-02-2.02e-01-0.249
4678NASPGSM6177620_NYU_UCEC1_lib1_lib1HumanEndometriumEEC7.69e-30-2.05e-01-0.1869
4678NASPGSM6177620_NYU_UCEC1_lib2_lib2HumanEndometriumEEC4.06e-21-3.00e-01-0.1875
4678NASPGSM6177620_NYU_UCEC1_lib3_lib3HumanEndometriumEEC1.94e-28-2.64e-01-0.1883
4678NASPGSM6177621_NYU_UCEC2_lib1_lib1HumanEndometriumEEC7.07e-24-1.02e-02-0.1934
4678NASPGSM6177622_NYU_UCEC3_lib1_lib1HumanEndometriumEEC2.11e-42-2.60e-01-0.1917
Page: 1 2 3 4 5 6 7 8 9 

check button Transcriptomic changes along malignancy continuum.
TissueExpression DynamicsAbbreviation
Colorectum (GSE201348)The image shows the transcriptomic changes along malignancy continuum.log2FC in expression of this searched gene in stem-like cells from each diseased tissue sample relative to stem-like cells in normal samples in each tissue plotted against the malignancy continuum. Samples are colored based on if they are from different disease stage.
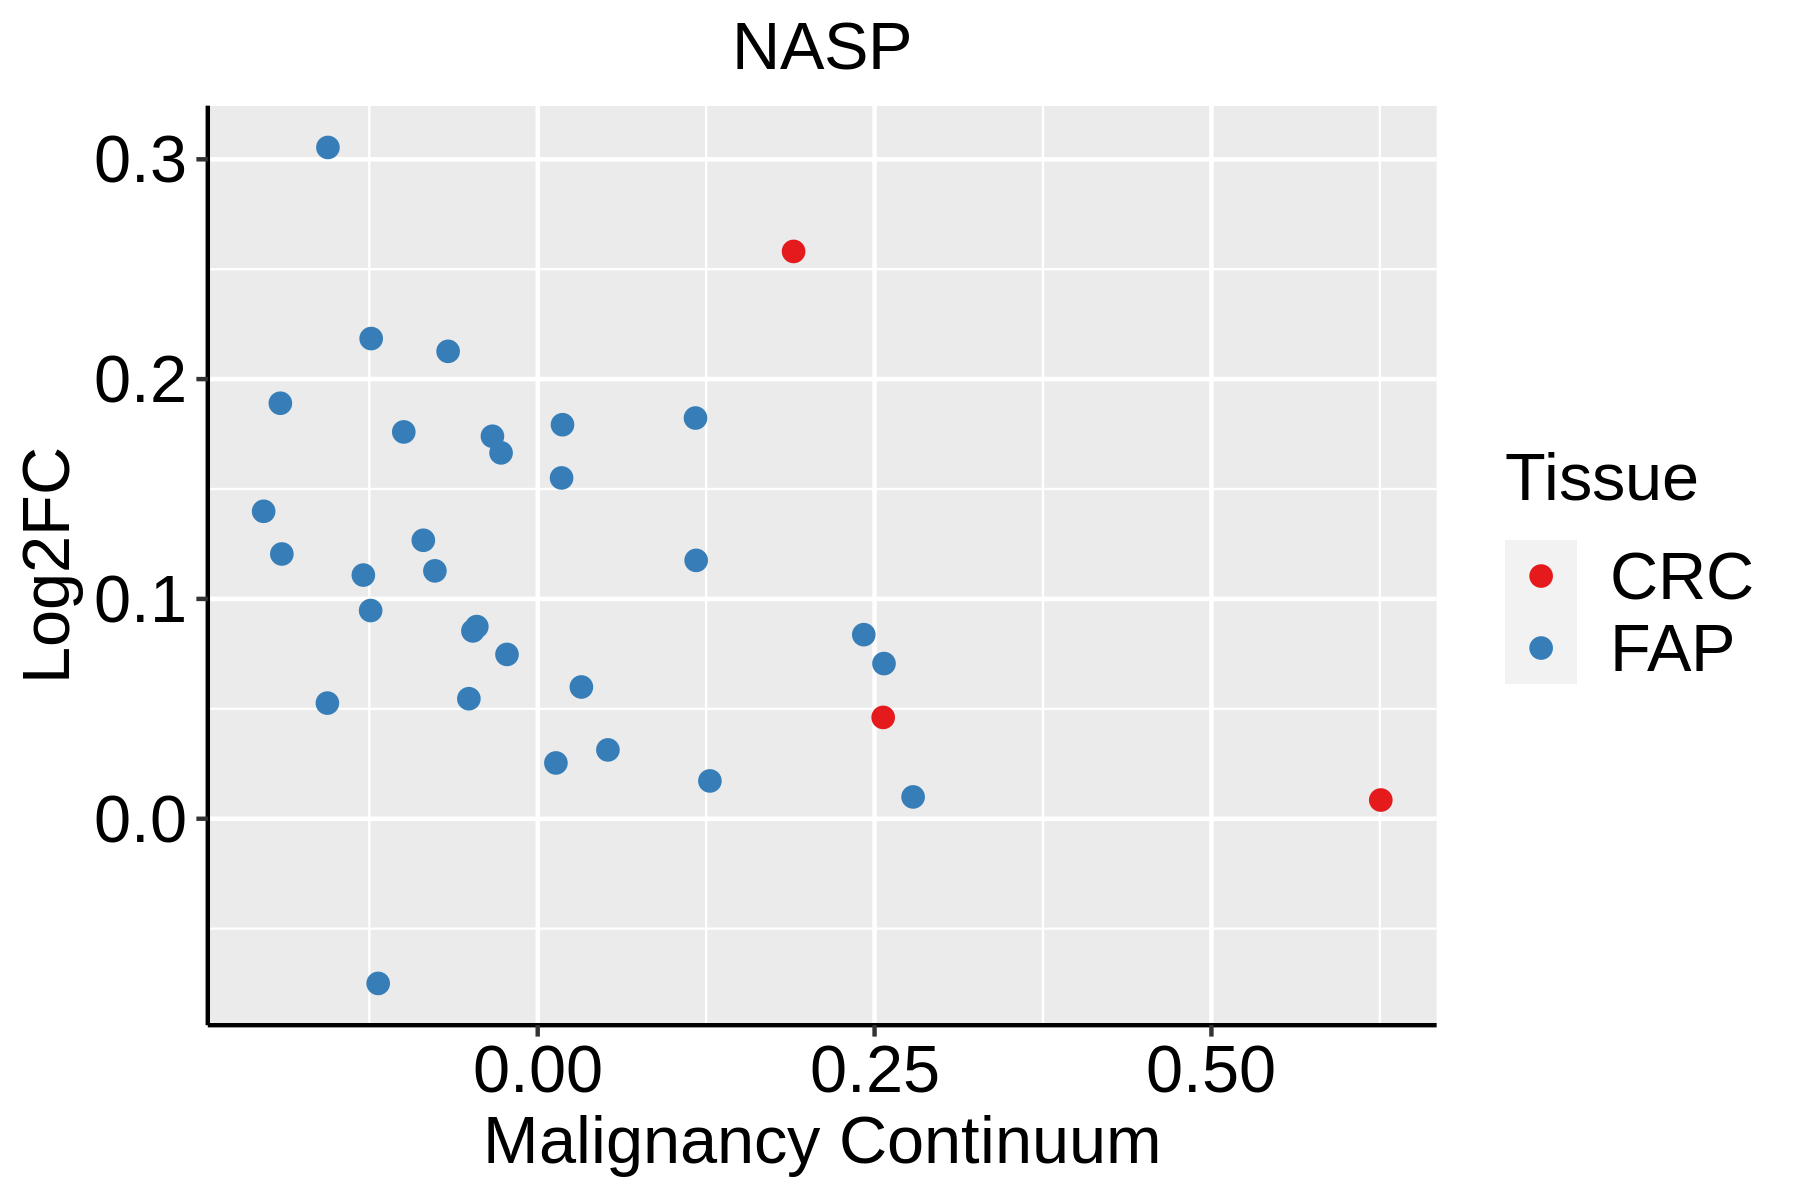
FAP: Familial adenomatous polyposis
CRC: Colorectal cancer
Colorectum (HTA11)The image shows the transcriptomic changes along malignancy continuum.log2FC in expression of this searched gene in stem-like cells from each diseased tissue sample relative to stem-like cells in normal samples in each tissue plotted against the malignancy continuum. Samples are colored based on if they are from different disease stage.AD: Adenomas
SER: Sessile serrated lesions
MSI-H: Microsatellite-high colorectal cancer
MSS: Microsatellite stable colorectal cancer
EndometriumThe image shows the transcriptomic changes along malignancy continuum.log2FC in expression of this searched gene in stem-like cells from each diseased tissue sample relative to stem-like cells in normal samples in each tissue plotted against the malignancy continuum. Samples are colored based on if they are from different disease stage.AEH: Atypical endometrial hyperplasia
EEC: Endometrioid Cancer
EsophagusThe image shows the transcriptomic changes along malignancy continuum.log2FC in expression of this searched gene in stem-like cells from each diseased tissue sample relative to stem-like cells in normal samples in each tissue plotted against the malignancy continuum. Samples are colored based on if they are from different disease stage.ESCC: Esophageal squamous cell carcinoma
HGIN: High-grade intraepithelial neoplasias
LGIN: Low-grade intraepithelial neoplasias
LiverThe image shows the transcriptomic changes along malignancy continuum.log2FC in expression of this searched gene in stem-like cells from each diseased tissue sample relative to stem-like cells in normal samples in each tissue plotted against the malignancy continuum. Samples are colored based on if they are from different disease stage.
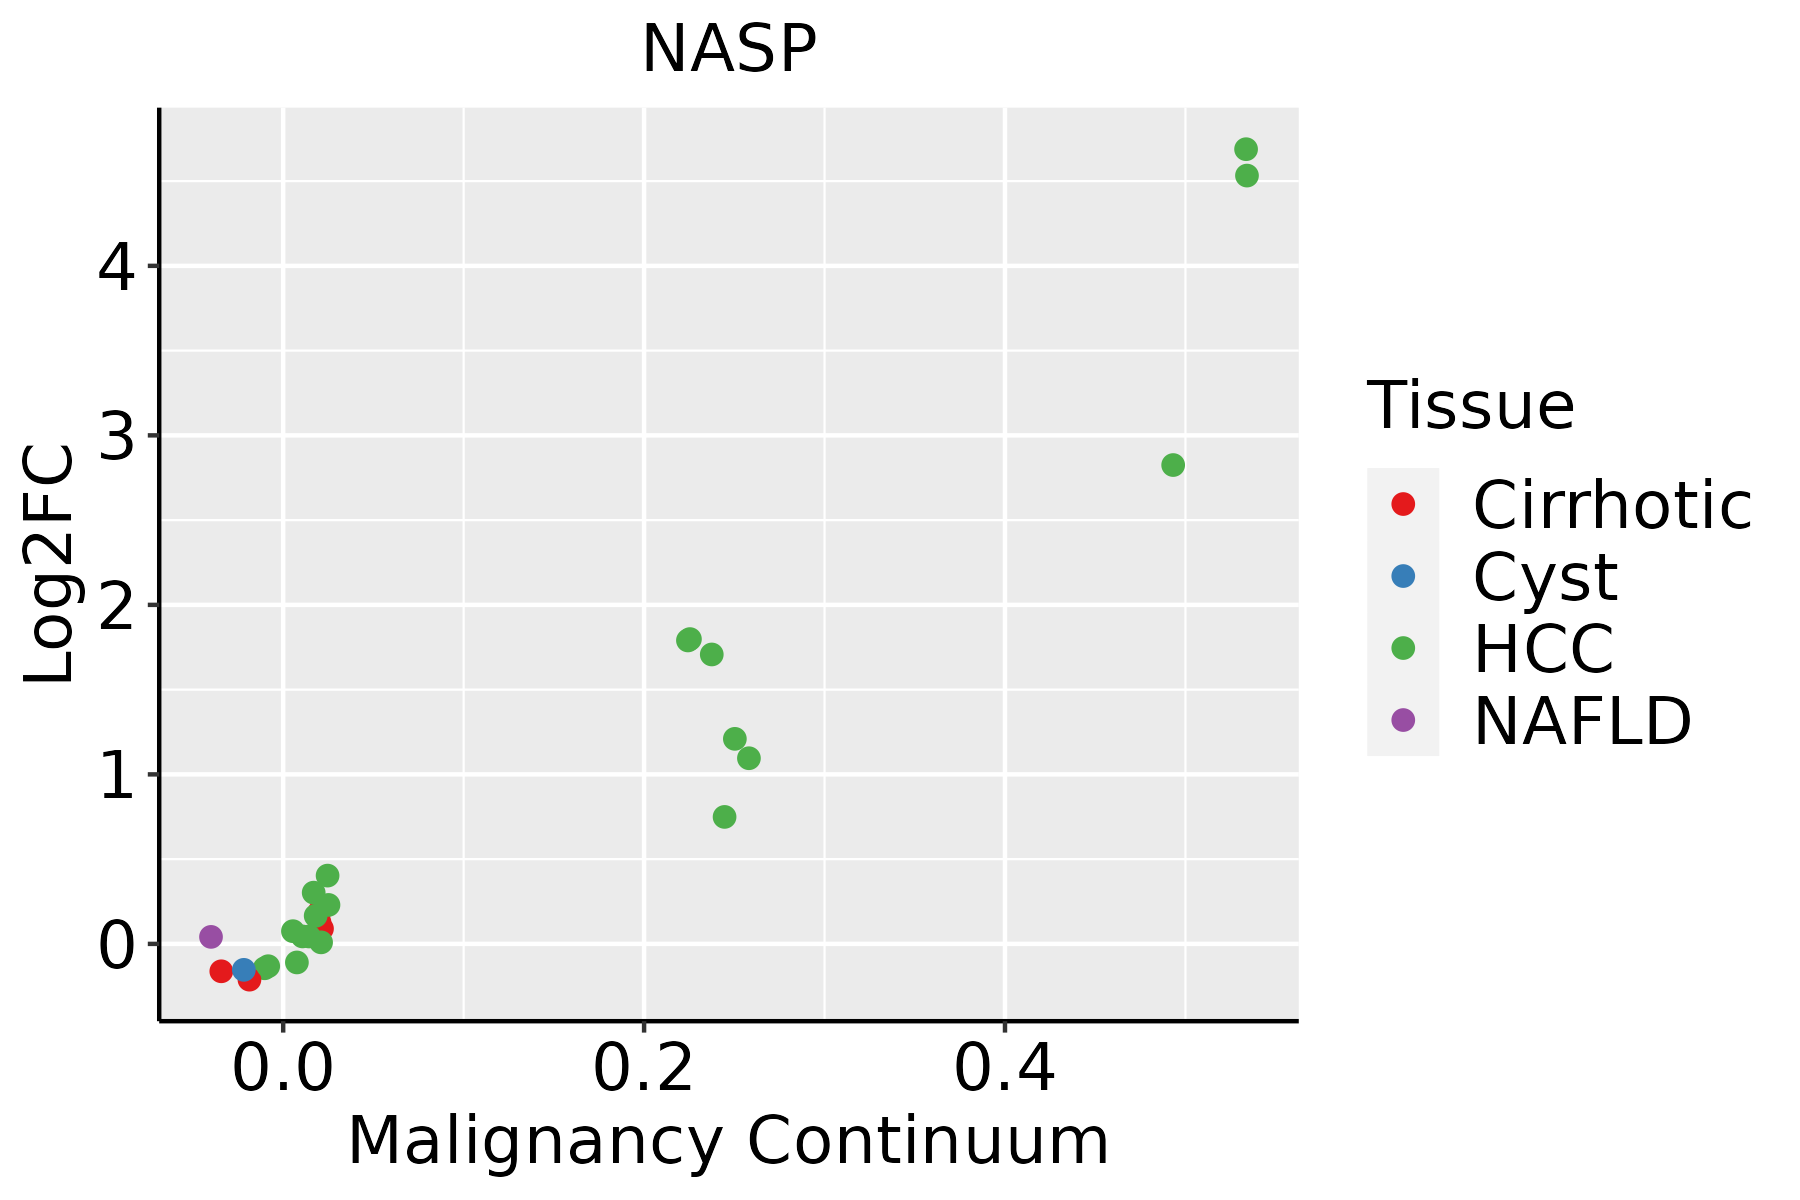
HCC: Hepatocellular carcinoma
NAFLD: Non-alcoholic fatty liver disease
LungThe image shows the transcriptomic changes along malignancy continuum.log2FC in expression of this searched gene in stem-like cells from each diseased tissue sample relative to stem-like cells in normal samples in each tissue plotted against the malignancy continuum. Samples are colored based on if they are from different disease stage.
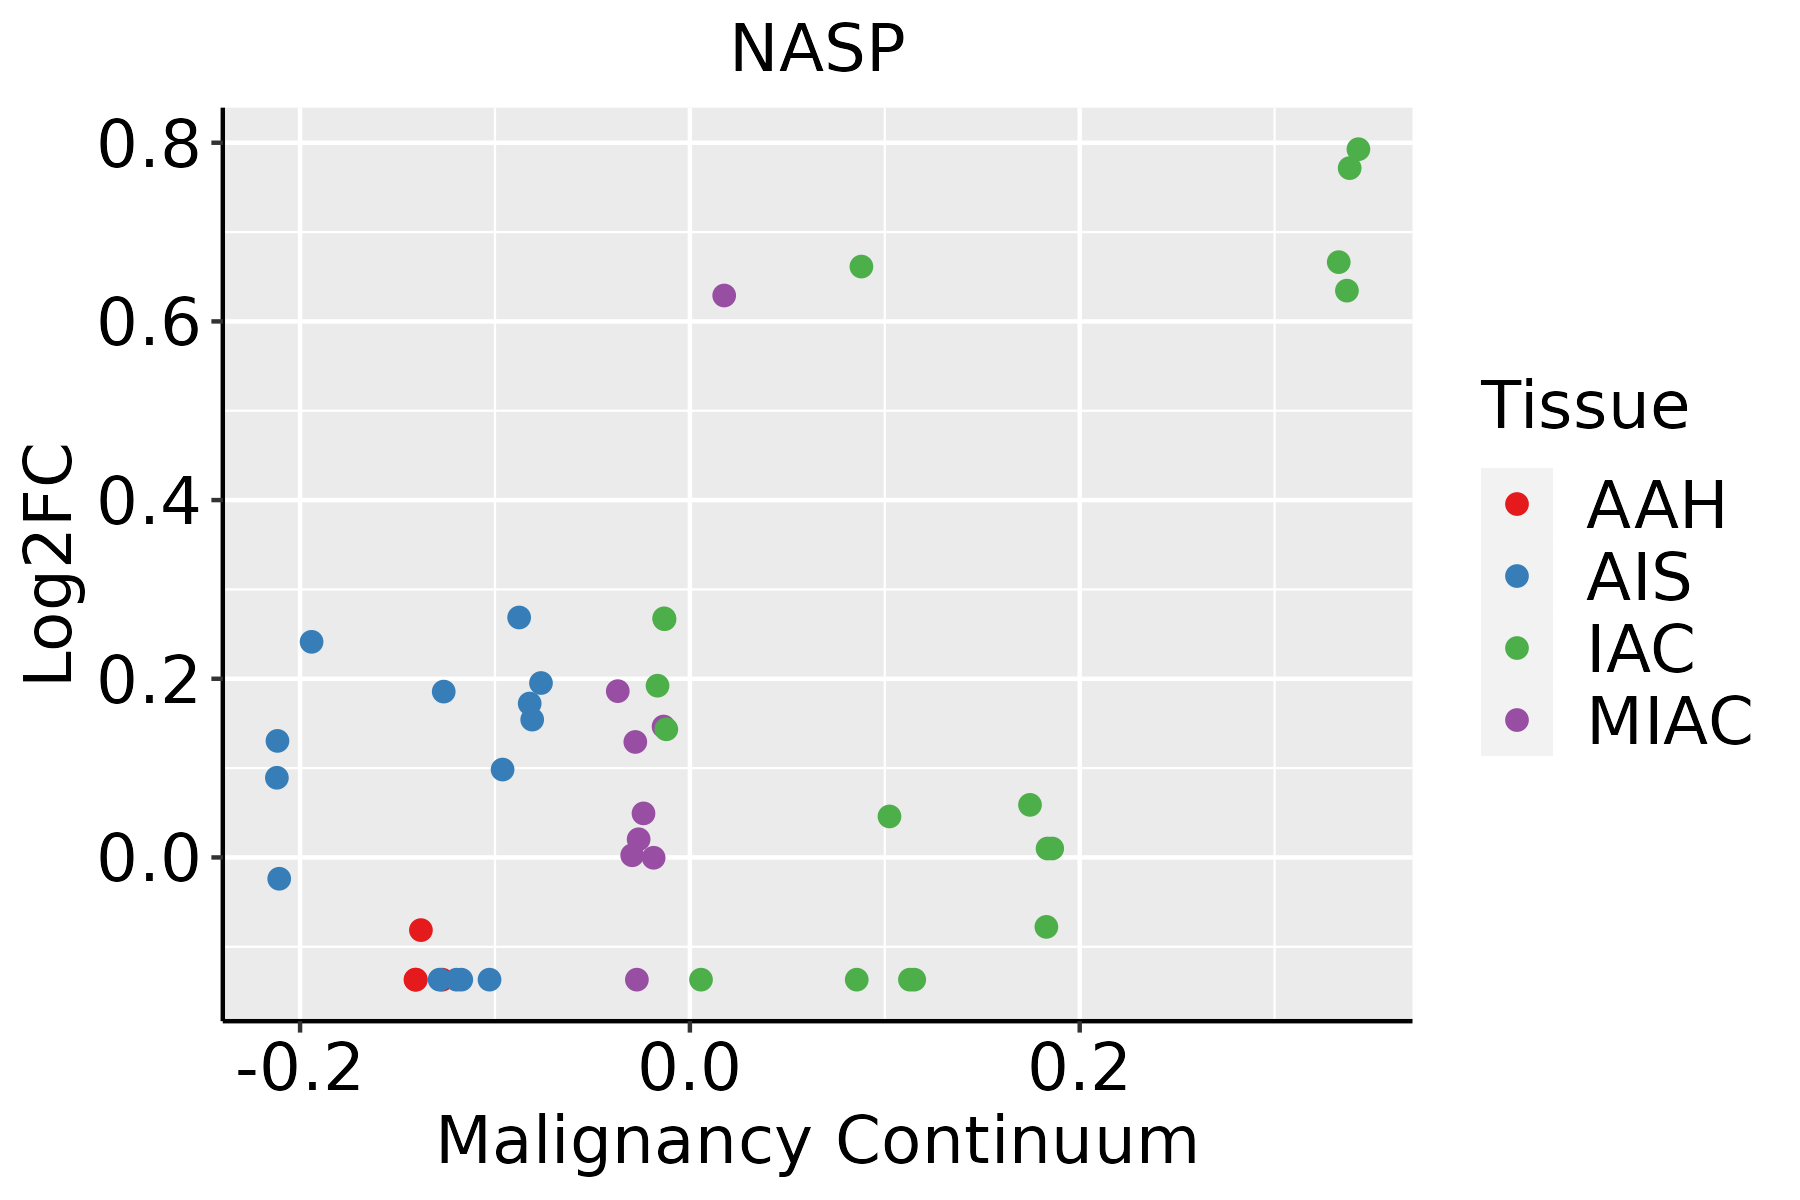
AAH: Atypical adenomatous hyperplasia
AIS: Adenocarcinoma in situ
IAC: Invasive lung adenocarcinoma
MIA: Minimally invasive adenocarcinoma
Oral CavityThe image shows the transcriptomic changes along malignancy continuum.log2FC in expression of this searched gene in stem-like cells from each diseased tissue sample relative to stem-like cells in normal samples in each tissue plotted against the malignancy continuum. Samples are colored based on if they are from different disease stage.
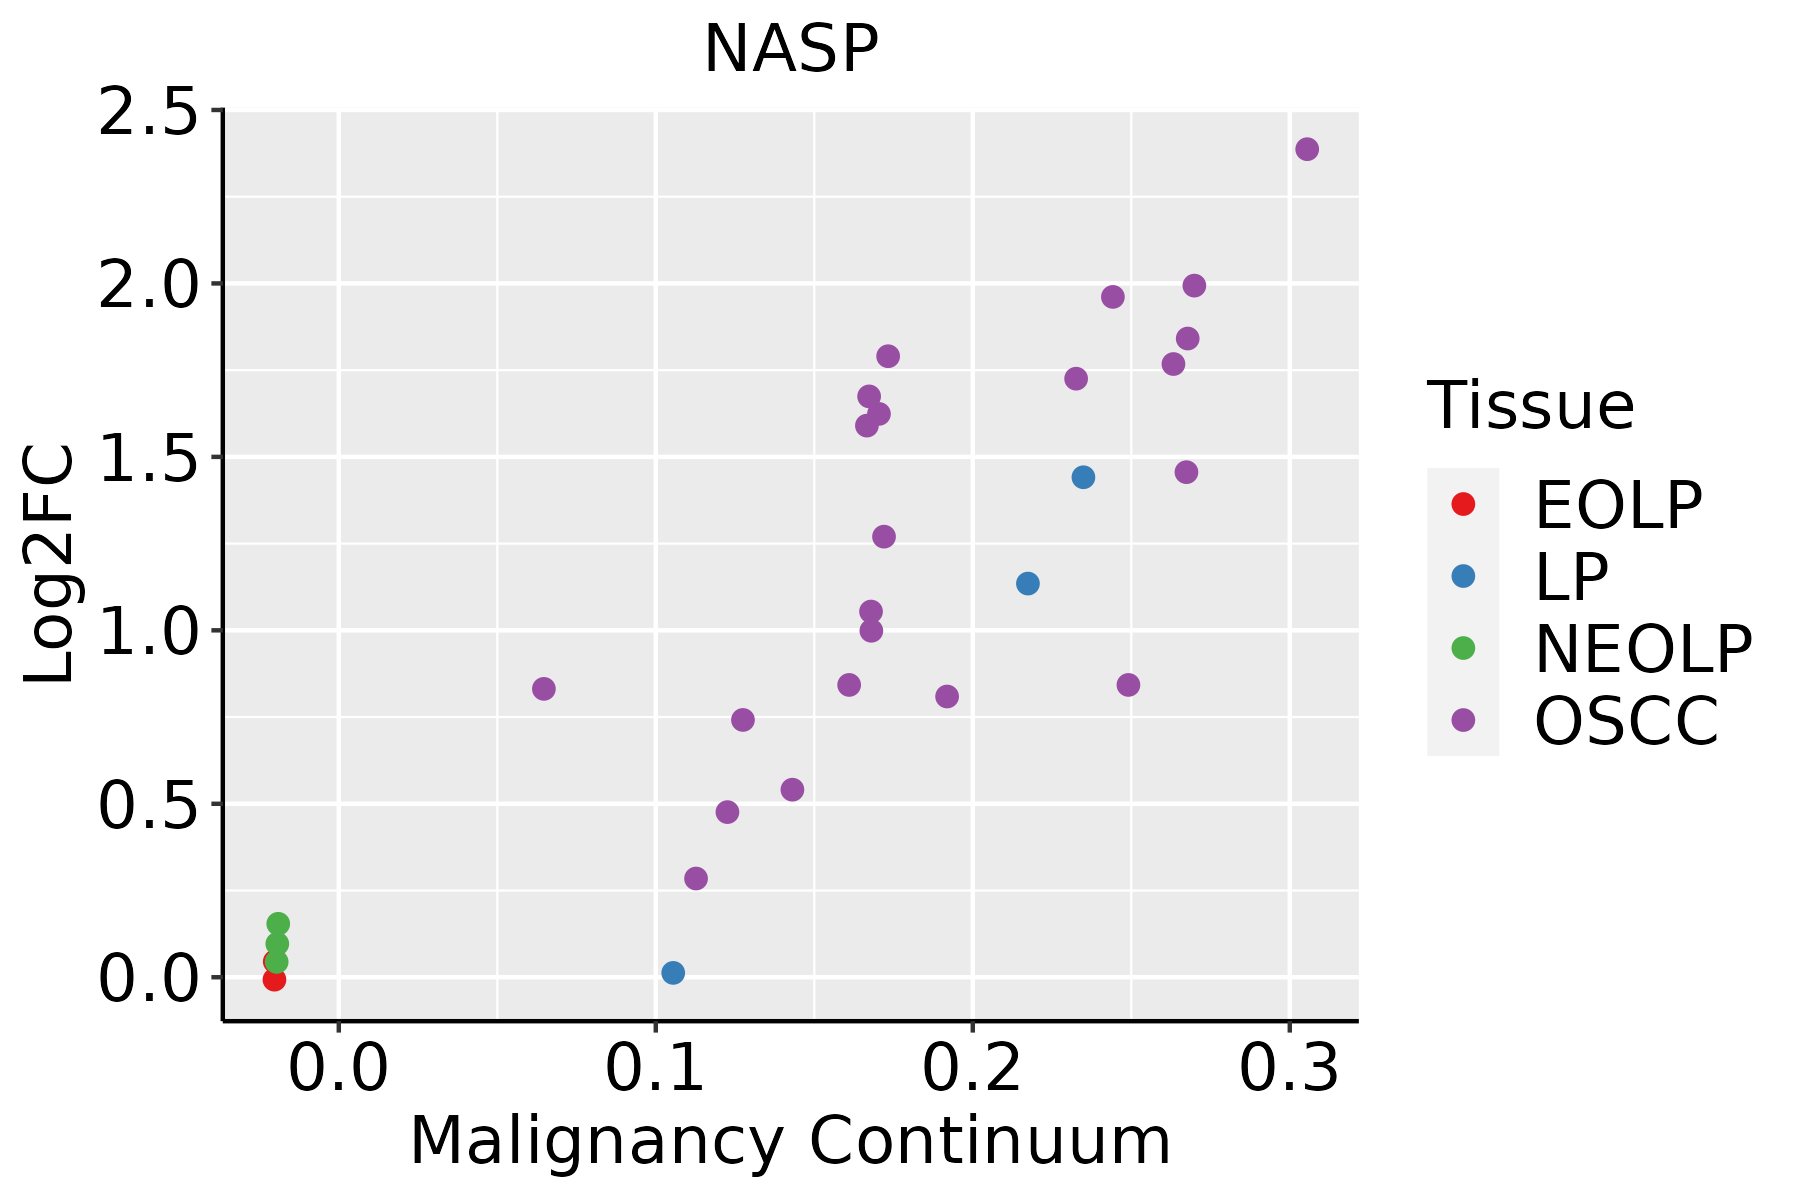
EOLP: Erosive Oral lichen planus
LP: leukoplakia
NEOLP: Non-erosive oral lichen planus
OSCC: Oral squamous cell carcinoma
ProstateThe image shows the transcriptomic changes along malignancy continuum.log2FC in expression of this searched gene in stem-like cells from each diseased tissue sample relative to stem-like cells in normal samples in each tissue plotted against the malignancy continuum. Samples are colored based on if they are from different disease stage.
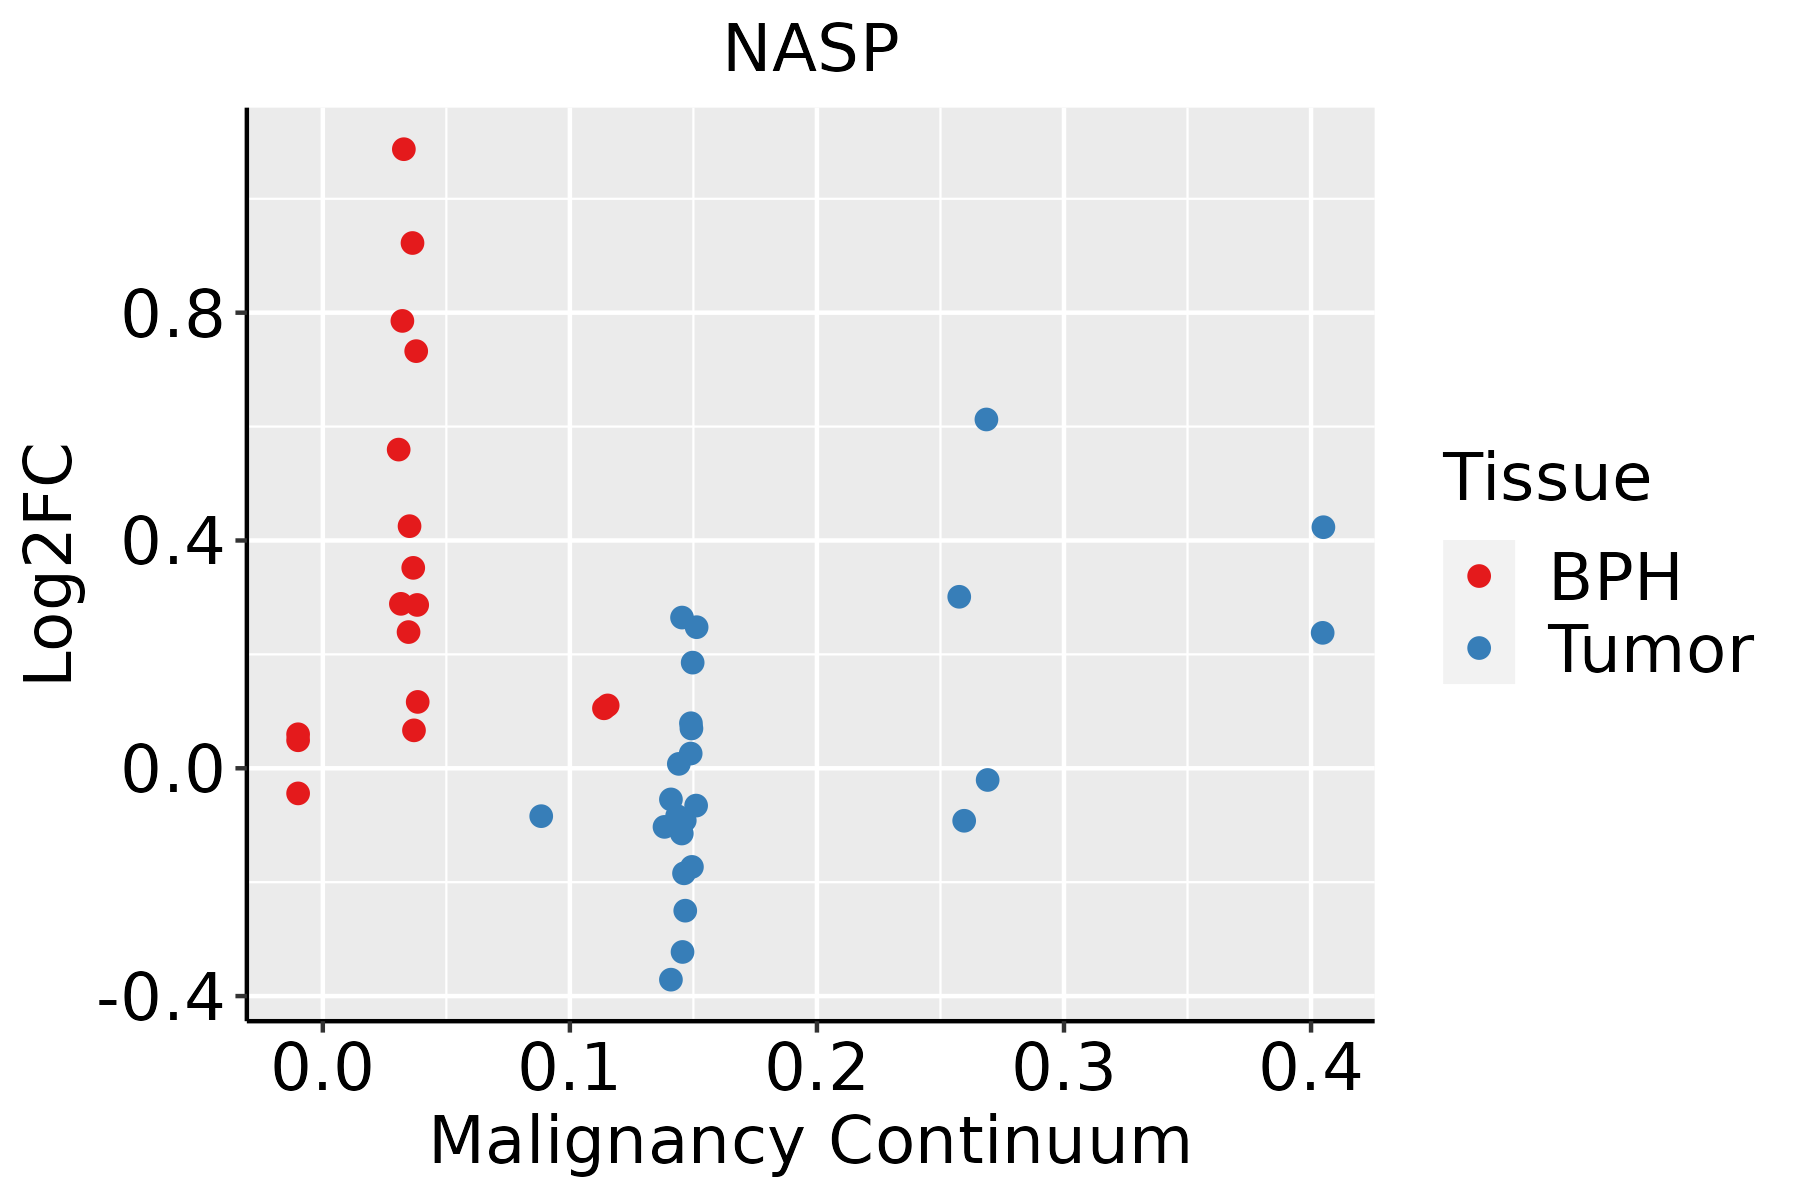
BPH: Benign Prostatic Hyperplasia
SkinThe image shows the transcriptomic changes along malignancy continuum.log2FC in expression of this searched gene in stem-like cells from each diseased tissue sample relative to stem-like cells in normal samples in each tissue plotted against the malignancy continuum. Samples are colored based on if they are from different disease stage.
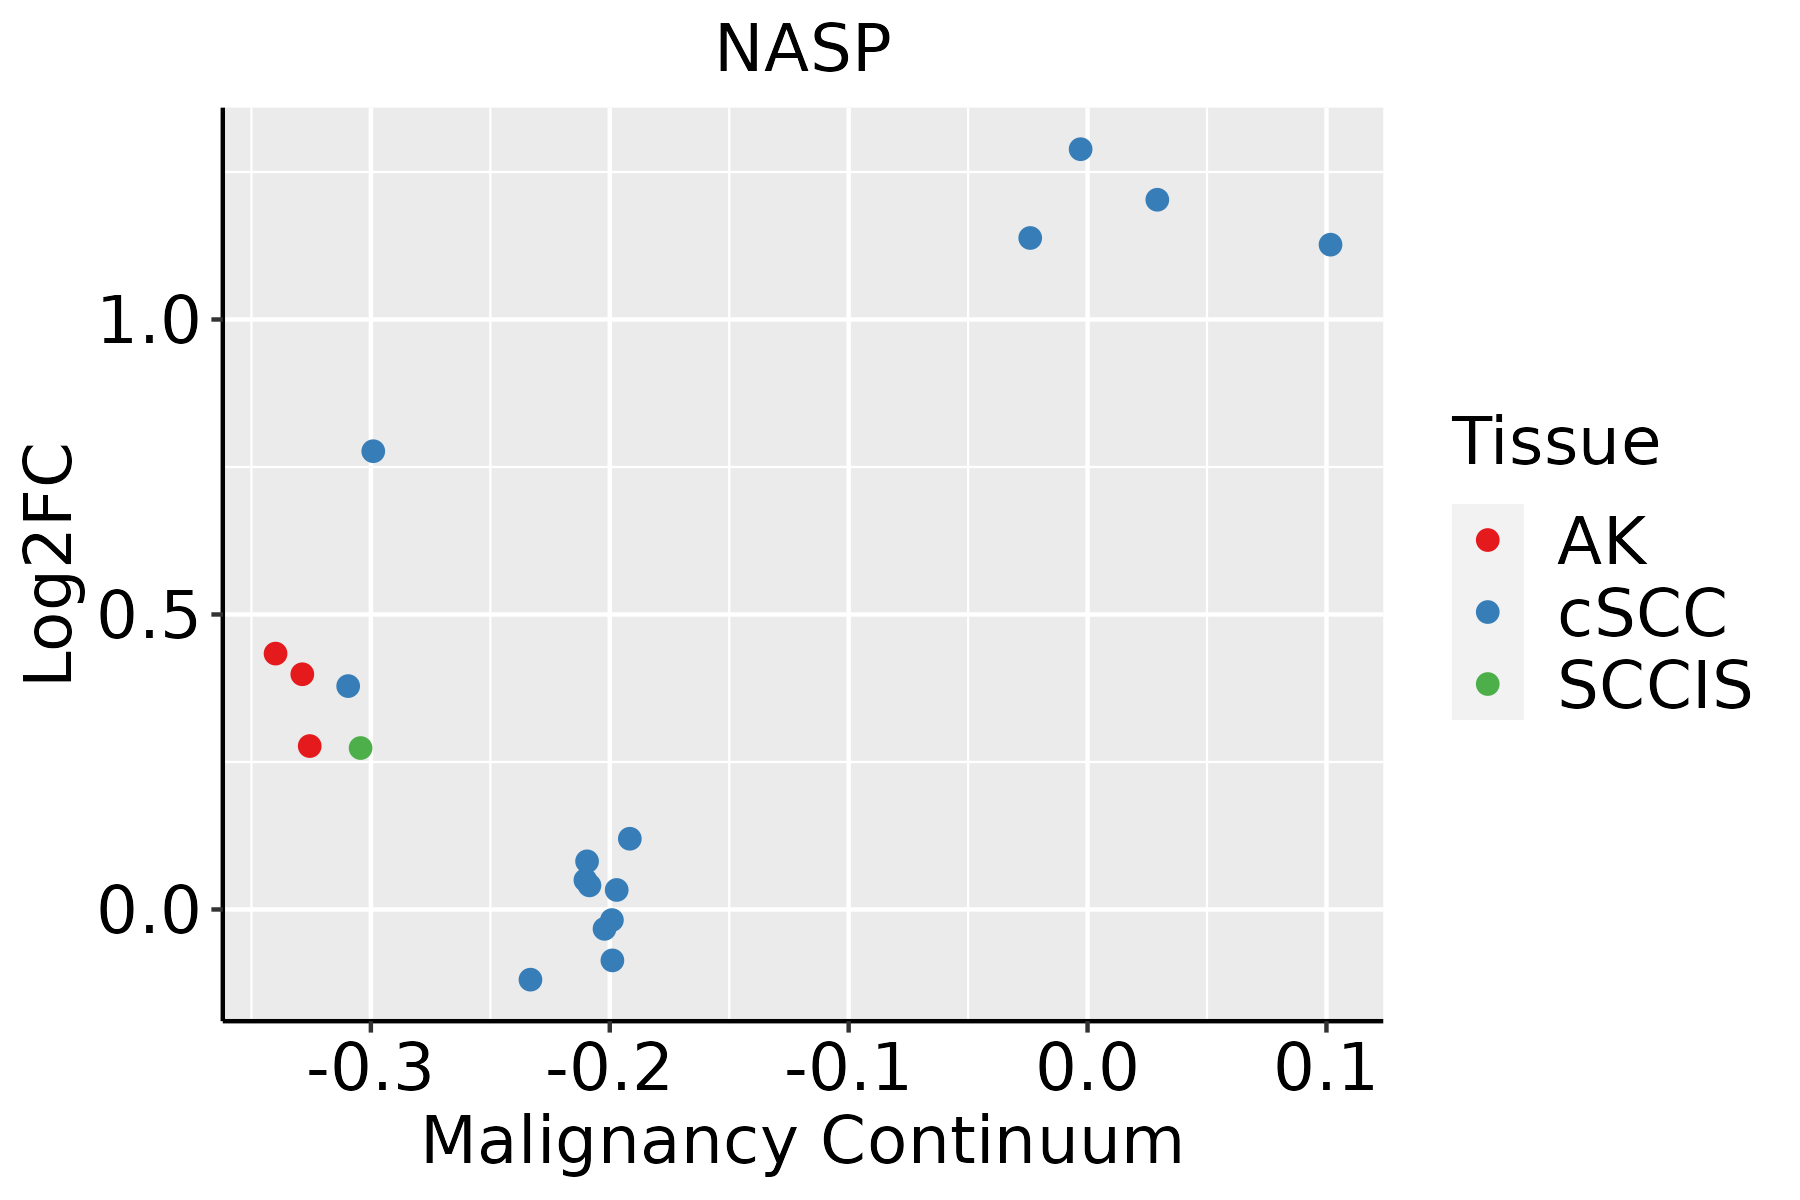
AK: Actinic keratosis
cSCC: Cutaneous squamous cell carcinoma
SCCIS:squamous cell carcinoma in situ
ThyroidThe image shows the transcriptomic changes along malignancy continuum.log2FC in expression of this searched gene in stem-like cells from each diseased tissue sample relative to stem-like cells in normal samples in each tissue plotted against the malignancy continuum. Samples are colored based on if they are from different disease stage.
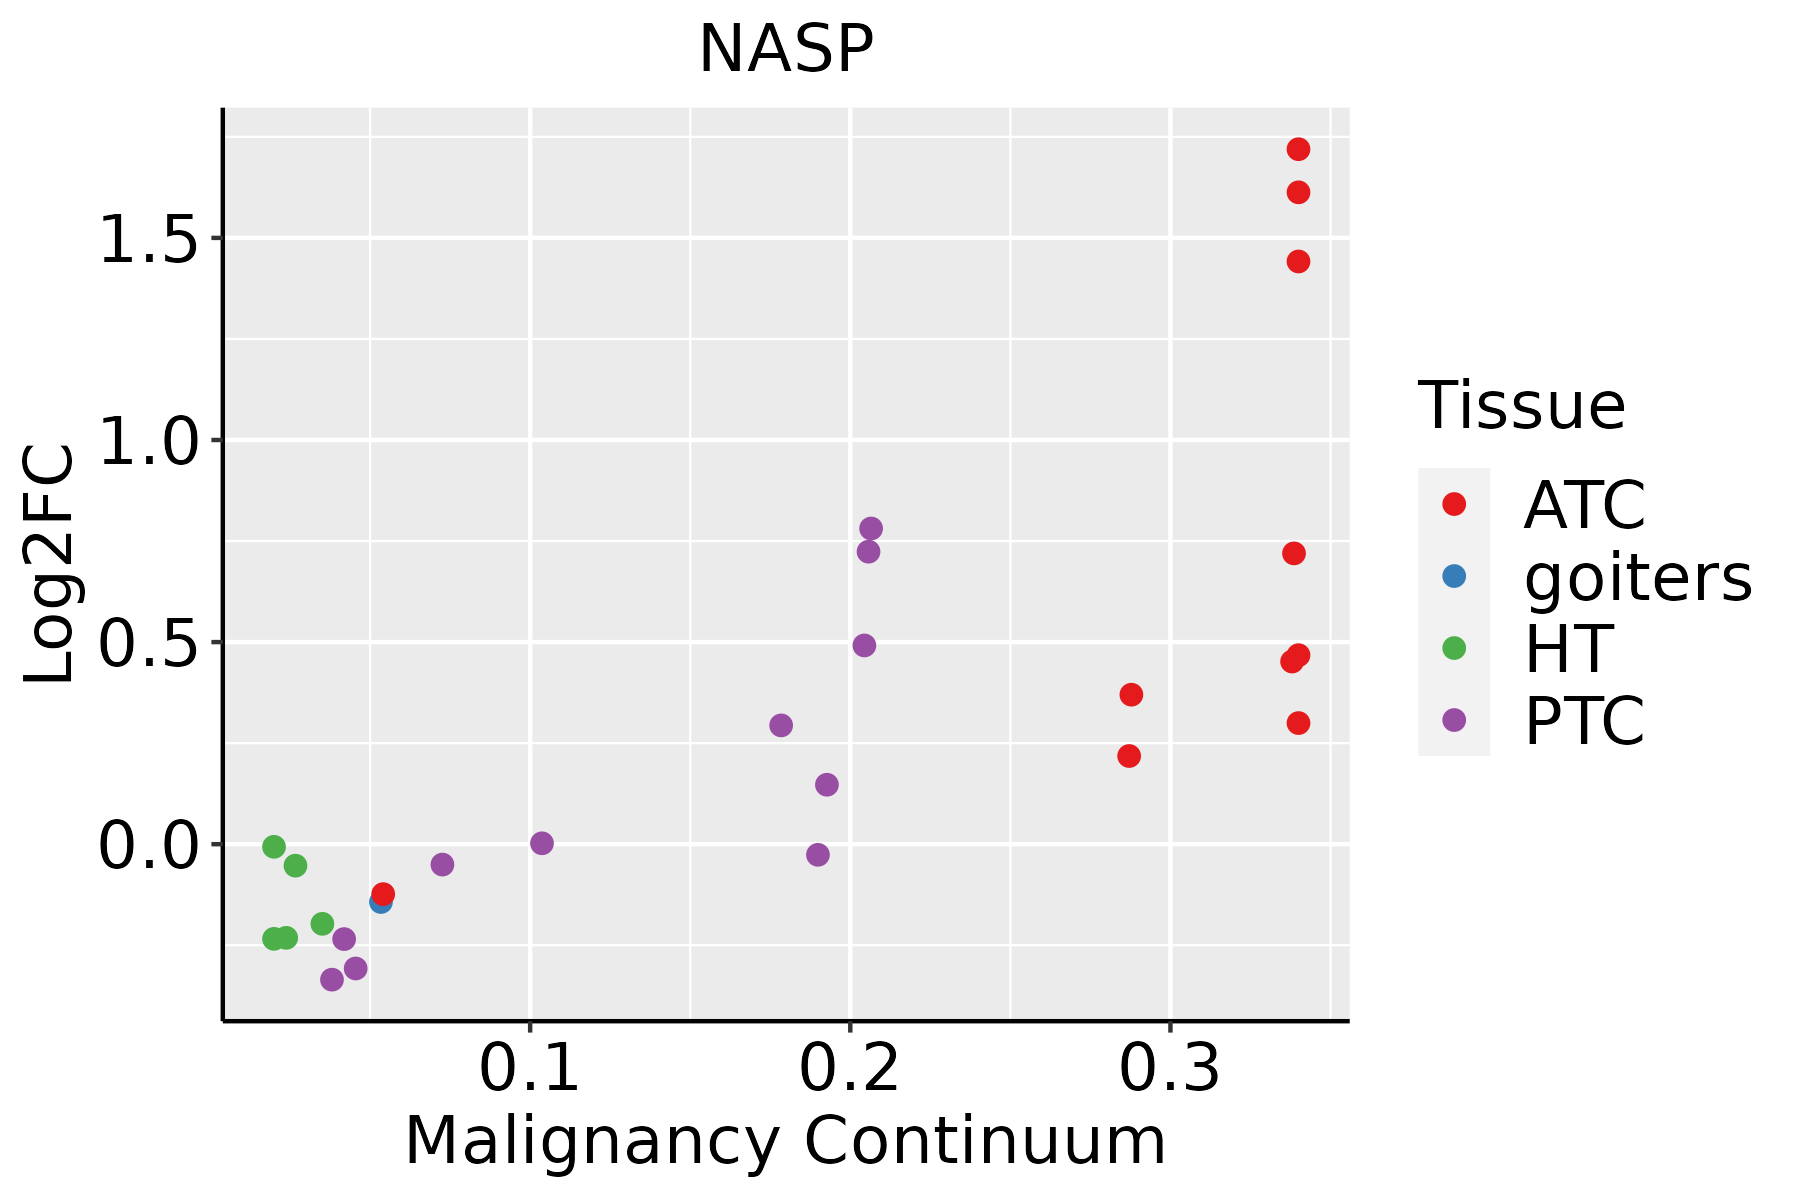
ATC: Anaplastic thyroid cancer
HT: Hashimoto's thyroiditis
PTC: Papillary thyroid cancer
∗log2FC in expression of this searched gene in stem-like cells from each diseased tissue sample relative to stem-like cells in normal samples in each tissue plotted against the malignancy continuum. Samples are colored based on if they are from different disease stage.

Top

Malignant transformation related pathway analysis

check buttonFind out the enriched GO biological processes and KEGG pathways involved in transition from healthy to precancer to cancer
check button Figure of enriched GO biological processes.
TissueDisease StageEnriched GO biological Processes
ColorectumADGO analysis - Figure of enriched GO biological processes: Top 15 enriched GO BP terms are showed in the bar plot of each disease state in each tissue. Each row represents a significant GO biological process which is colored according to the -log10(p.adjust).
ColorectumSERGO analysis - Figure of enriched GO biological processes: Top 15 enriched GO BP terms are showed in the bar plot of each disease state in each tissue. Each row represents a significant GO biological process which is colored according to the -log10(p.adjust).
ColorectumMSSGO analysis - Figure of enriched GO biological processes: Top 15 enriched GO BP terms are showed in the bar plot of each disease state in each tissue. Each row represents a significant GO biological process which is colored according to the -log10(p.adjust).
ColorectumMSI-HGO analysis - Figure of enriched GO biological processes: Top 15 enriched GO BP terms are showed in the bar plot of each disease state in each tissue. Each row represents a significant GO biological process which is colored according to the -log10(p.adjust).
ColorectumFAPGO analysis - Figure of enriched GO biological processes: Top 15 enriched GO BP terms are showed in the bar plot of each disease state in each tissue. Each row represents a significant GO biological process which is colored according to the -log10(p.adjust).
∗Top 15 enriched GO BP terms are showed in the bar plot of each disease state in each tissue. Each row represents a significant GO biological process which is colored according to the -log10(p.adjust).
Page: 1 2 3 4 5 6 7 8 9 

check button Enriched GO biological processes.
GO IDTissueDisease StageDescriptionGene RatioBg Ratiopvaluep.adjustCount
GO:00017016LungIACin utero embryonic development68/2061367/187231.12e-053.45e-0468
GO:00448433LungIACcell cycle G1/S phase transition49/2061241/187231.54e-054.49e-0449
GO:19016548LungIACresponse to ketone39/2061194/187231.40e-042.60e-0339
GO:00063256LungIACchromatin organization69/2061409/187232.01e-043.53e-0369
GO:00335744LungIACresponse to testosterone11/206142/187234.72e-033.68e-0211
GO:00447728Oral cavityOSCCmitotic cell cycle phase transition255/7305424/187235.29e-196.98e-17255
GO:00062603Oral cavityOSCCDNA replication159/7305260/187233.25e-131.59e-11159
GO:000170116Oral cavityOSCCin utero embryonic development207/7305367/187237.92e-122.95e-10207
GO:190165419Oral cavityOSCCresponse to ketone114/7305194/187231.82e-083.60e-07114
GO:00000826Oral cavityOSCCG1/S transition of mitotic cell cycle120/7305214/187232.86e-074.40e-06120
GO:006145817Oral cavityOSCCreproductive system development217/7305427/187233.75e-075.63e-06217
GO:004860816Oral cavityOSCCreproductive structure development214/7305424/187238.58e-071.18e-05214
GO:00448436Oral cavityOSCCcell cycle G1/S phase transition131/7305241/187238.77e-071.20e-05131
GO:00018243Oral cavityOSCCblastocyst development66/7305106/187231.04e-061.40e-0566
GO:0034508Oral cavityOSCCcentromere complex assembly21/730530/187235.75e-043.30e-0321
GO:00335747Oral cavityOSCCresponse to testosterone27/730542/187238.00e-044.29e-0327
GO:000632510Oral cavityOSCCchromatin organization190/7305409/187231.17e-035.97e-03190
GO:000170117Oral cavityLPin utero embryonic development142/4623367/187231.48e-096.75e-08142
GO:004477215Oral cavityLPmitotic cell cycle phase transition150/4623424/187234.38e-071.23e-05150
GO:1901654110Oral cavityLPresponse to ketone78/4623194/187231.24e-063.03e-0578
Page: 1 2 3 4 5 6 7 8 9 10 11 

check button Enriched KEGG pathways.
Pathway IDTissueDisease StageDescriptionGene RatioBg Ratiopvaluep.adjustqvalueCount
Page: 1 

Top

Cell-cell communication analysis

check buttonIdentification of potential cell-cell interactions between two cell types and their ligand-receptor pairs for different disease states
LigandReceptorLRpairPathwayTissueDisease Stage
Page: 1 

Top

Single-cell gene regulatory network inference analysis

check buttonFind out the significant the regulons (TFs) and the target genes of each regulon across cell types for different disease states
TFCell TypeTissueDisease StageTarget GeneRSSRegulon Activity
∗The dot plots of a searched regulon are shown for all cell subpopulations in each disease state of each tissue based on the regulon specific score inferred using pySCENIC and by calculating the average expression.
Page: 1 

Top

Somatic mutation of malignant transformation related genes

check buttonAnnotation of somatic variants for genes involved in malignant transformation
Hugo SymbolVariant ClassVariant ClassificationdbSNP RSHGVScHGVSpHGVSp ShortSWISSPROTBIOTYPESIFTPolyPhenTumor Sample BarcodeTissueHistologySexAgeStageTherapy TypesDrugsOutcome
NASPSNVMissense_Mutationc.1682N>Tp.Ala561Valp.A561VP49321protein_codingdeleterious(0)probably_damaging(0.984)TCGA-B6-A0RM-01Breastbreast invasive carcinomaFemale<65I/IIUnknownUnknownSD
NASPSNVMissense_Mutationc.1439N>Tp.Ser480Leup.S480LP49321protein_codingdeleterious(0)probably_damaging(0.994)TCGA-E2-A15S-01Breastbreast invasive carcinomaFemale<65I/IIChemotherapydoxorubicinSD
NASPSNVMissense_Mutationnovelc.754G>Cp.Glu252Glnp.E252QP49321protein_codingdeleterious_low_confidence(0)benign(0.074)TCGA-PE-A5DE-01Breastbreast invasive carcinomaFemale<65I/IIChemotherapytaxotereCR
NASPdeletionFrame_Shift_Delc.639delNp.Gly215GlufsTer52p.G215Efs*52P49321protein_codingTCGA-BH-A1ES-06Breastbreast invasive carcinomaFemale<65I/IIUnknownUnknownPD
NASPSNVMissense_Mutationc.325G>Ap.Ala109Thrp.A109TP49321protein_codingdeleterious(0.01)probably_damaging(0.996)TCGA-2W-A8YY-01Cervixcervical & endocervical cancerFemale<65I/IIChemotherapycisplatinCR
NASPSNVMissense_Mutationrs201446871c.970N>Ap.Glu324Lysp.E324KP49321protein_codingdeleterious_low_confidence(0)benign(0)TCGA-C5-A1BQ-01Cervixcervical & endocervical cancerFemale>=65III/IVChemotherapycisplatinCR
NASPSNVMissense_Mutationc.943N>Cp.Glu315Glnp.E315QP49321protein_codingdeleterious_low_confidence(0.01)benign(0.024)TCGA-DR-A0ZM-01Cervixcervical & endocervical cancerFemale<65III/IVUnspecificCisplatinSD
NASPSNVMissense_Mutationc.1508C>Gp.Ser503Cysp.S503CP49321protein_codingdeleterious(0)possibly_damaging(0.628)TCGA-EA-A3HR-01Cervixcervical & endocervical cancerFemale<65I/IIUnknownUnknownSD
NASPSNVMissense_Mutationrs759202853c.463N>Cp.Glu155Glnp.E155QP49321protein_codingdeleterious(0.02)possibly_damaging(0.852)TCGA-EK-A2R8-01Cervixcervical & endocervical cancerFemale<65I/IIUnknownUnknownSD
NASPinsertionFrame_Shift_Insnovelc.538_539insCTAAAAATACp.Lys180ThrfsTer14p.K180Tfs*14P49321protein_codingTCGA-DS-A1OB-01Cervixcervical & endocervical cancerFemale<65I/IIChemotherapycarboplatinPD
Page: 1 2 3 4 5 6 

Top

Related drugs of malignant transformation related genes

check buttonIdentification of chemicals and drugs interact with genes involved in malignant transfromation
(DGIdb 4.0)
Entrez IDSymbolCategoryInteraction TypesDrug Claim NameDrug NamePMIDs
Page: 1