
|
|||||
|
 | |
| |
| |
| |
| |
| |
|
Gene: MR1 |
Gene summary for MR1 |
| Gene information | Species | Human | Gene symbol | MR1 | Gene ID | 3140 |
| Gene name | major histocompatibility complex, class I-related | |
| Gene Alias | HLALS | |
| Cytomap | 1q25.3 | |
| Gene Type | protein-coding | GO ID | GO:0001775 | UniProtAcc | Q95460 |
Top |
Malignant transformation analysis |
| Identification of the aberrant gene expression in precancerous and cancerous lesions by comparing the gene expression of stem-like cells in diseased tissues with normal stem cells |
| Entrez ID | Symbol | Replicates | Species | Organ | Tissue | Adj P-value | Log2FC | Malignancy |
| 3140 | MR1 | LZE4T | Human | Esophagus | ESCC | 4.23e-09 | 1.75e-01 | 0.0811 |
| 3140 | MR1 | LZE20T | Human | Esophagus | ESCC | 1.24e-02 | 9.35e-02 | 0.0662 |
| 3140 | MR1 | LZE24T | Human | Esophagus | ESCC | 1.39e-07 | 2.86e-01 | 0.0596 |
| 3140 | MR1 | P2T-E | Human | Esophagus | ESCC | 2.79e-16 | 3.69e-01 | 0.1177 |
| 3140 | MR1 | P4T-E | Human | Esophagus | ESCC | 3.81e-14 | 3.26e-01 | 0.1323 |
| 3140 | MR1 | P5T-E | Human | Esophagus | ESCC | 1.52e-03 | 1.32e-01 | 0.1327 |
| 3140 | MR1 | P8T-E | Human | Esophagus | ESCC | 7.17e-17 | 2.34e-01 | 0.0889 |
| 3140 | MR1 | P9T-E | Human | Esophagus | ESCC | 4.71e-02 | 6.38e-02 | 0.1131 |
| 3140 | MR1 | P10T-E | Human | Esophagus | ESCC | 2.28e-08 | 1.71e-01 | 0.116 |
| 3140 | MR1 | P11T-E | Human | Esophagus | ESCC | 1.45e-05 | 2.00e-01 | 0.1426 |
| 3140 | MR1 | P12T-E | Human | Esophagus | ESCC | 1.15e-10 | 1.61e-01 | 0.1122 |
| 3140 | MR1 | P15T-E | Human | Esophagus | ESCC | 1.48e-09 | 2.04e-01 | 0.1149 |
| 3140 | MR1 | P16T-E | Human | Esophagus | ESCC | 4.90e-06 | 1.38e-01 | 0.1153 |
| 3140 | MR1 | P20T-E | Human | Esophagus | ESCC | 4.36e-14 | 2.76e-01 | 0.1124 |
| 3140 | MR1 | P21T-E | Human | Esophagus | ESCC | 3.11e-17 | 2.21e-01 | 0.1617 |
| 3140 | MR1 | P22T-E | Human | Esophagus | ESCC | 1.78e-11 | 1.69e-01 | 0.1236 |
| 3140 | MR1 | P23T-E | Human | Esophagus | ESCC | 1.55e-09 | 3.38e-01 | 0.108 |
| 3140 | MR1 | P24T-E | Human | Esophagus | ESCC | 1.81e-11 | 1.74e-01 | 0.1287 |
| 3140 | MR1 | P26T-E | Human | Esophagus | ESCC | 1.21e-05 | 7.27e-02 | 0.1276 |
| 3140 | MR1 | P27T-E | Human | Esophagus | ESCC | 2.83e-10 | 1.71e-01 | 0.1055 |
| Page: 1 2 3 4 5 |
| Tissue | Expression Dynamics | Abbreviation |
| Esophagus |  | ESCC: Esophageal squamous cell carcinoma |
| HGIN: High-grade intraepithelial neoplasias | ||
| LGIN: Low-grade intraepithelial neoplasias | ||
| Liver | 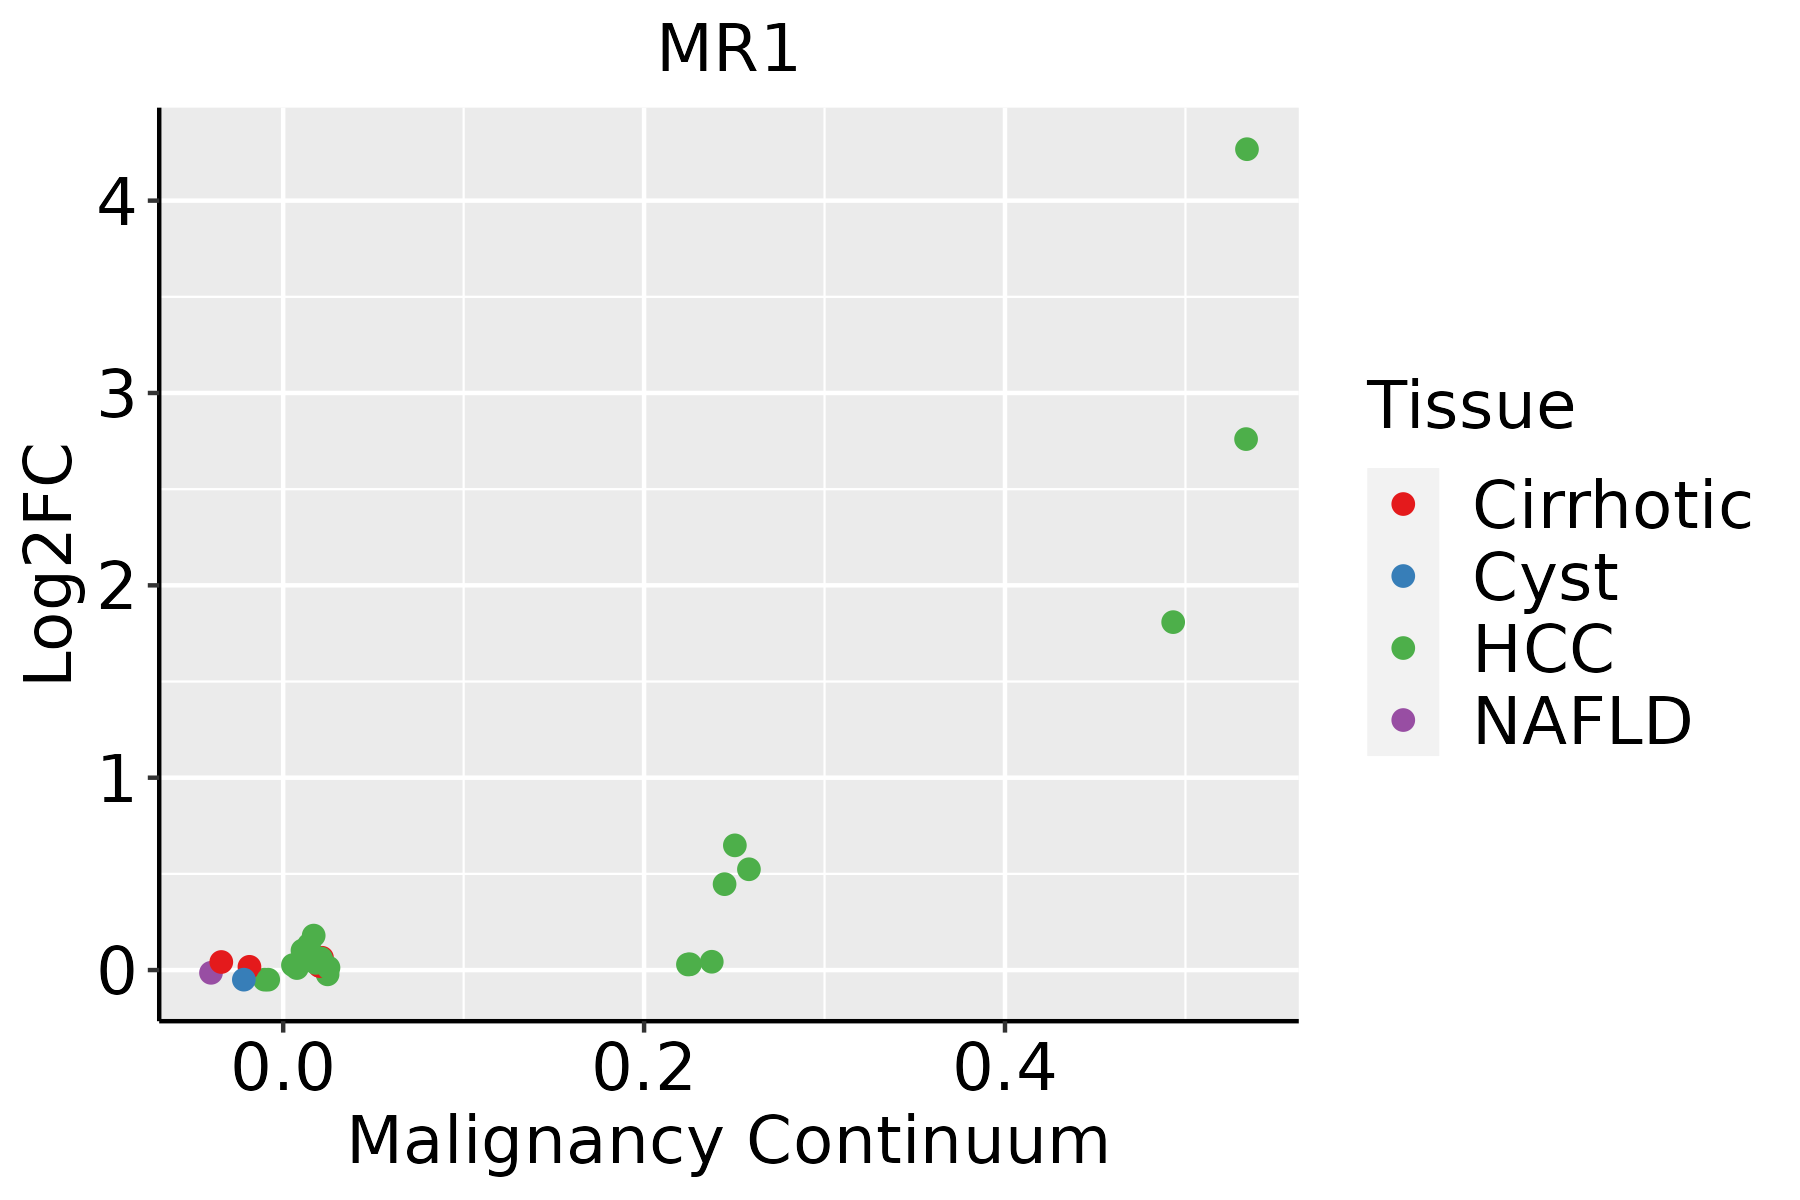 | HCC: Hepatocellular carcinoma |
| NAFLD: Non-alcoholic fatty liver disease | ||
| Oral Cavity | 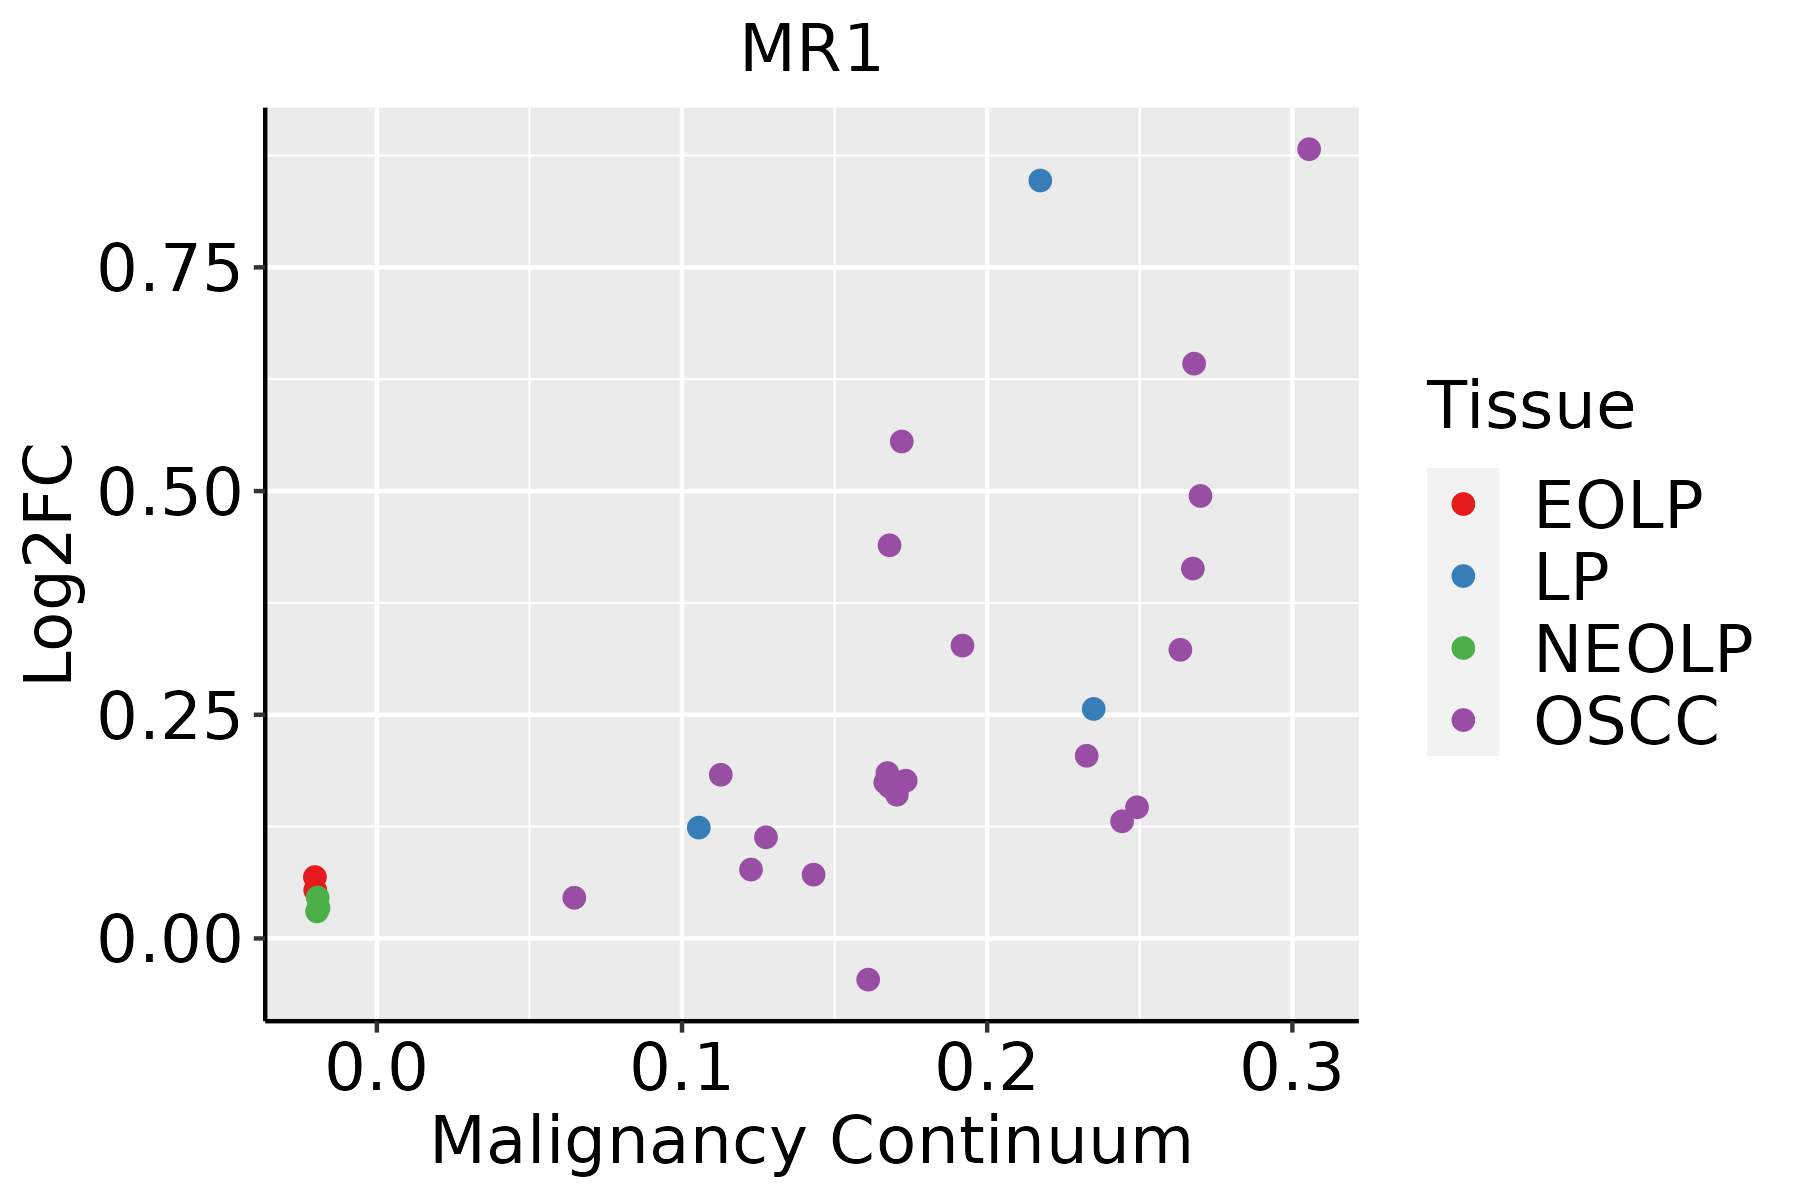 | EOLP: Erosive Oral lichen planus |
| LP: leukoplakia | ||
| NEOLP: Non-erosive oral lichen planus | ||
| OSCC: Oral squamous cell carcinoma | ||
| Prostate | 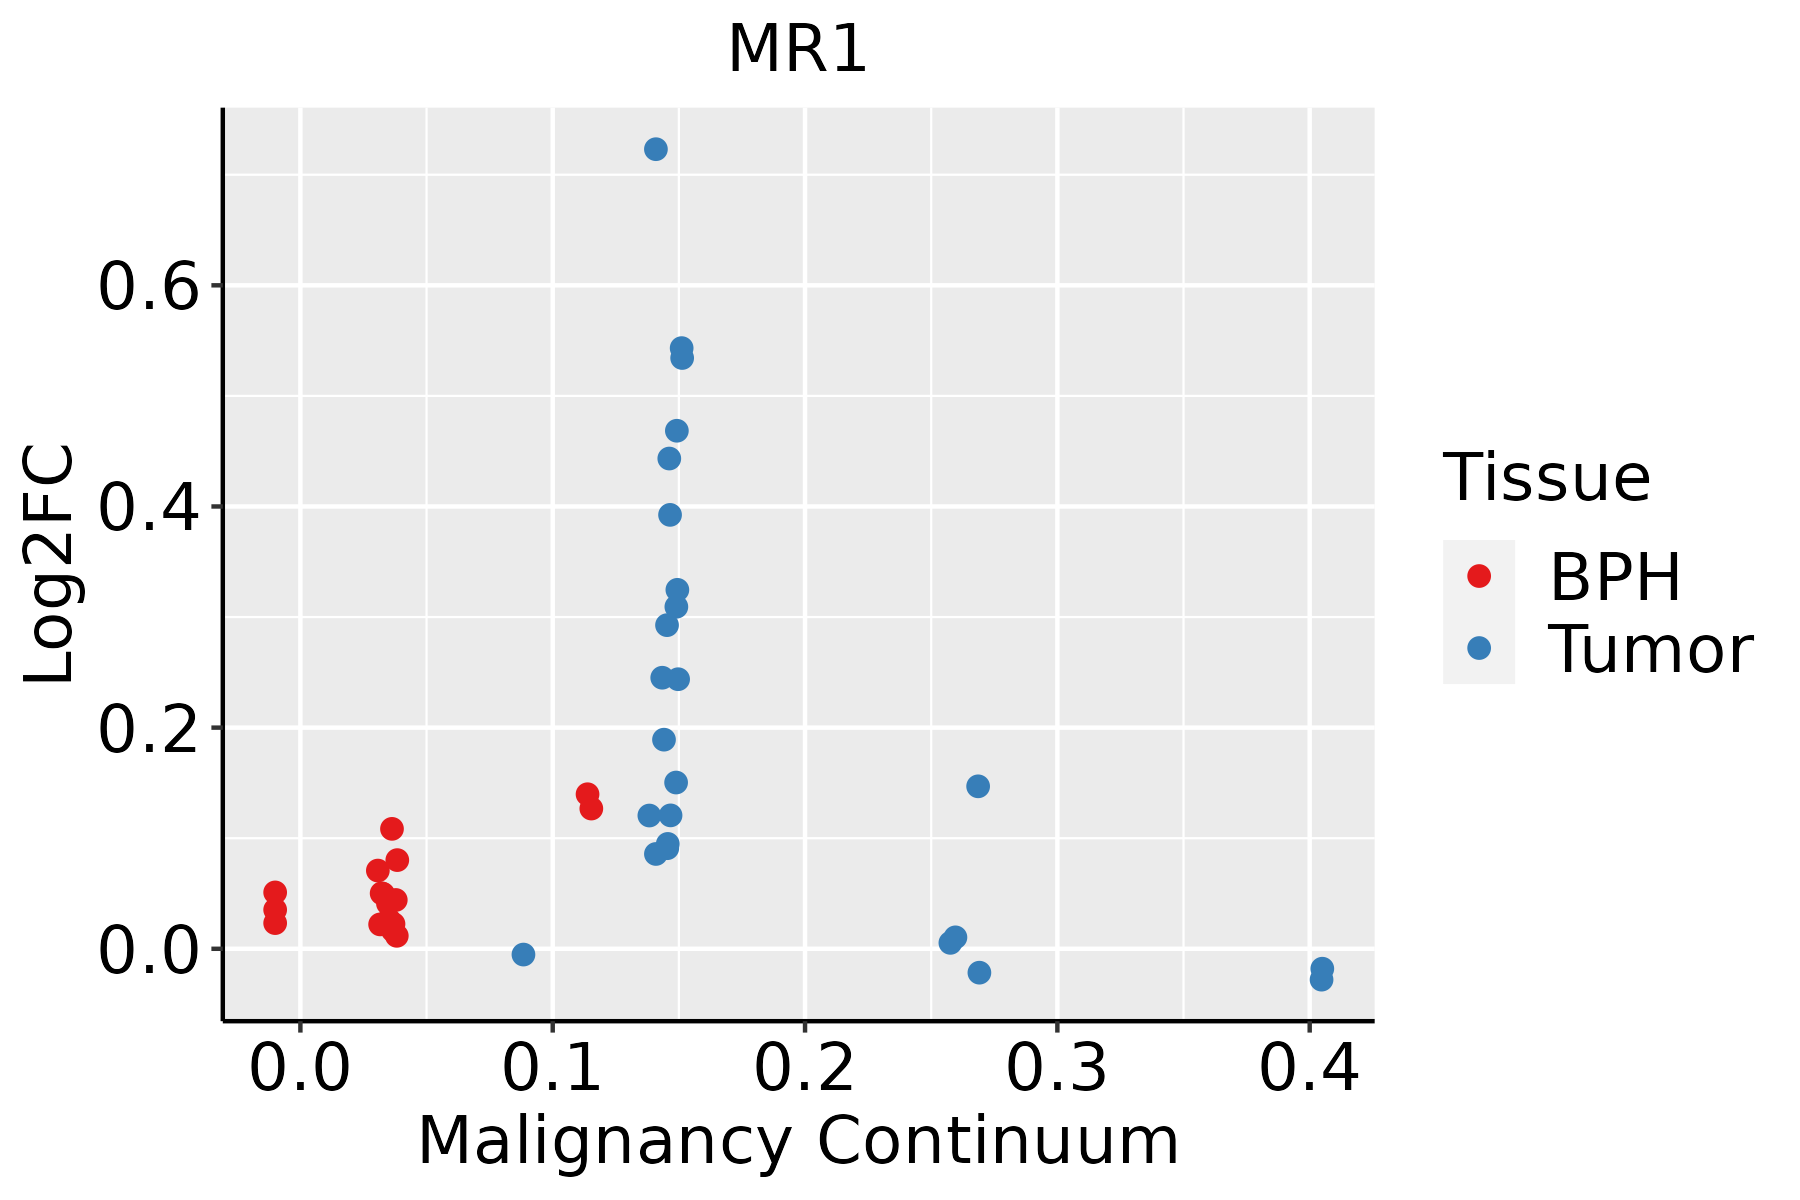 | BPH: Benign Prostatic Hyperplasia |
| Thyroid | 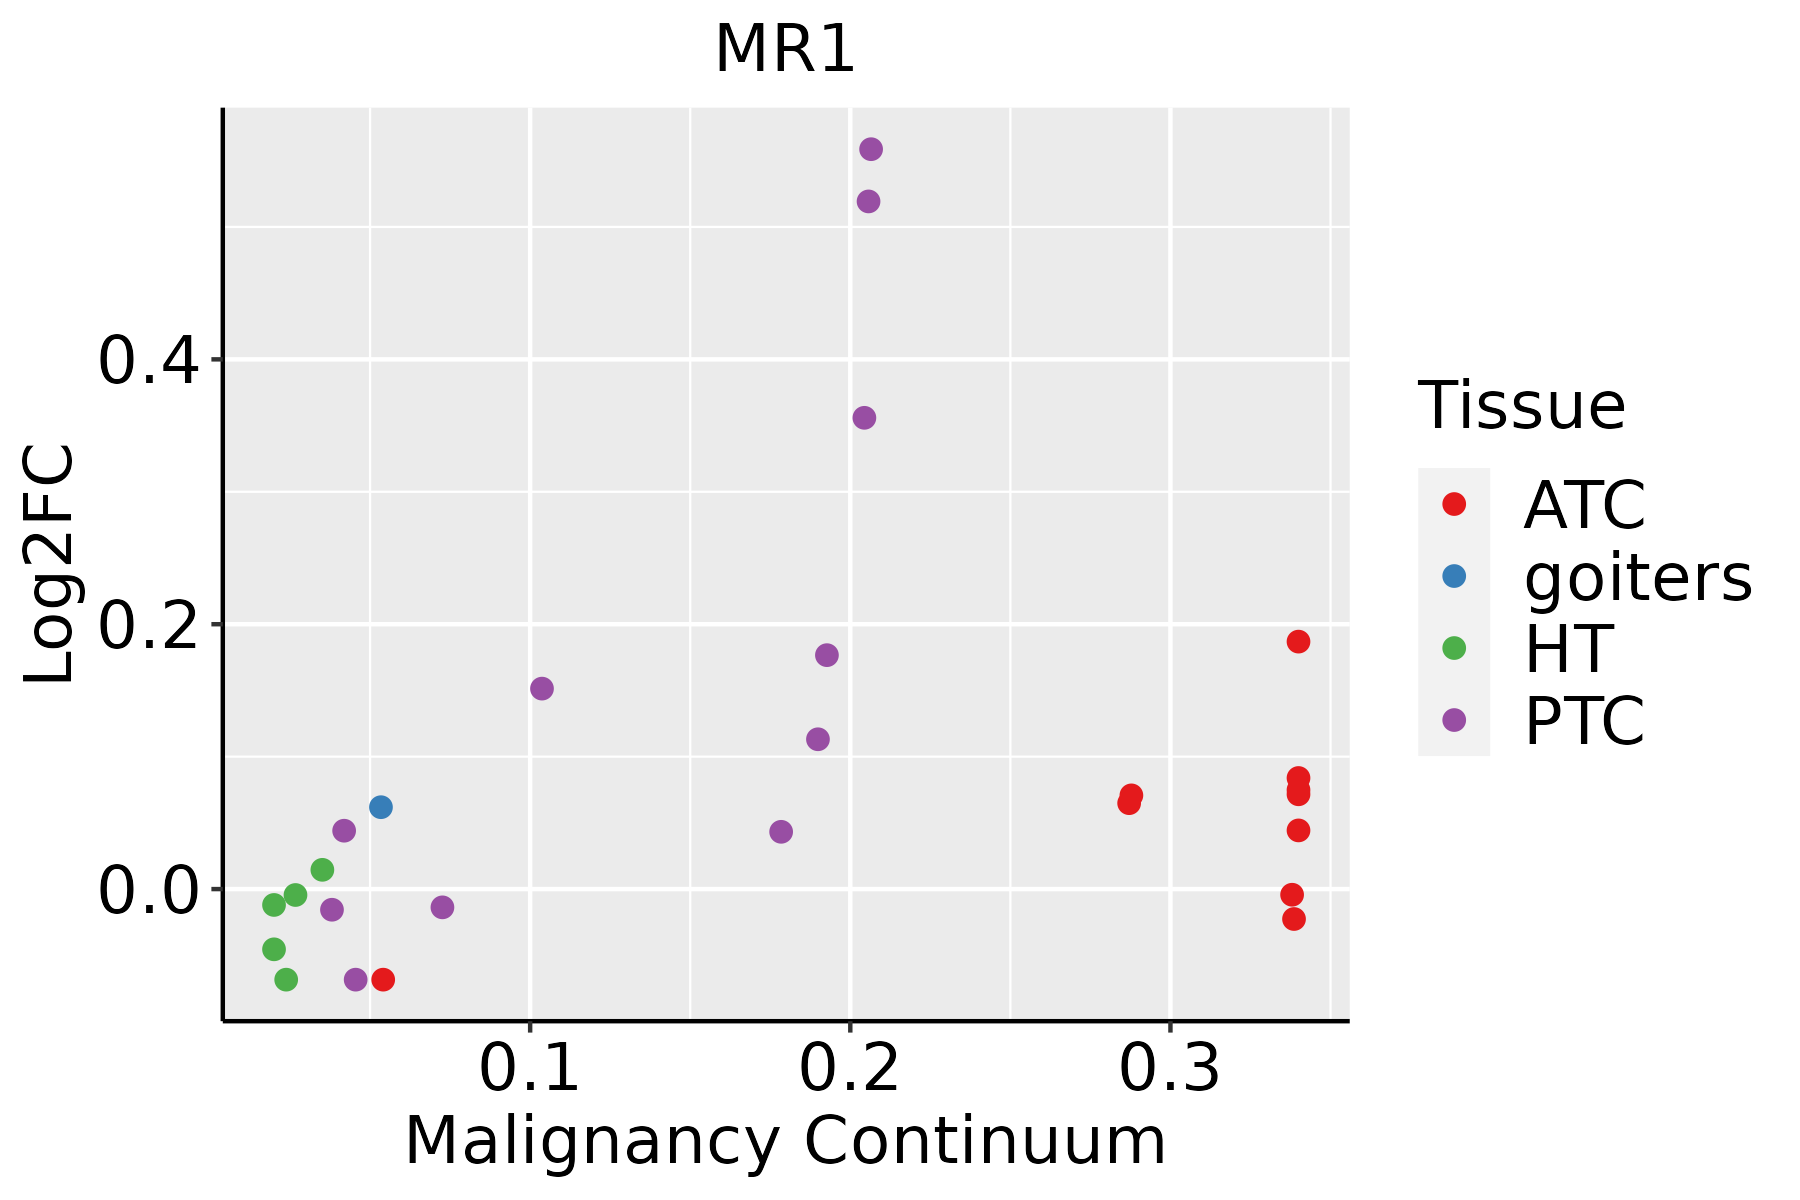 | ATC: Anaplastic thyroid cancer |
| HT: Hashimoto's thyroiditis | ||
| PTC: Papillary thyroid cancer |
| ∗log2FC in expression of this searched gene in stem-like cells from each diseased tissue sample relative to stem-like cells in normal samples in each tissue plotted against the malignancy continuum. Samples are colored based on if they are from different disease stage. |
Top |
Malignant transformation related pathway analysis |
| Find out the enriched GO biological processes and KEGG pathways involved in transition from healthy to precancer to cancer |
| Tissue | Disease Stage | Enriched GO biological Processes |
| Colorectum | AD |  |
| Colorectum | SER |  |
| Colorectum | MSS |  |
| Colorectum | MSI-H |  |
| Colorectum | FAP |  |
| ∗Top 15 enriched GO BP terms are showed in the bar plot of each disease state in each tissue. Each row represents a significant GO biological process which is colored according to the -log10(p.adjust). |
| Page: 1 2 3 4 5 6 7 8 9 |
| GO ID | Tissue | Disease Stage | Description | Gene Ratio | Bg Ratio | pvalue | p.adjust | Count |
| GO:0031330111 | Esophagus | ESCC | negative regulation of cellular catabolic process | 166/8552 | 262/18723 | 5.17e-09 | 1.08e-07 | 166 |
| GO:0048524110 | Esophagus | ESCC | positive regulation of viral process | 52/8552 | 65/18723 | 1.41e-08 | 2.77e-07 | 52 |
| GO:007147816 | Esophagus | ESCC | cellular response to radiation | 122/8552 | 186/18723 | 3.07e-08 | 5.73e-07 | 122 |
| GO:003010018 | Esophagus | ESCC | regulation of endocytosis | 135/8552 | 211/18723 | 5.75e-08 | 1.02e-06 | 135 |
| GO:00464744 | Esophagus | ESCC | glycerophospholipid biosynthetic process | 135/8552 | 211/18723 | 5.75e-08 | 1.02e-06 | 135 |
| GO:00450175 | Esophagus | ESCC | glycerolipid biosynthetic process | 154/8552 | 252/18723 | 5.20e-07 | 6.96e-06 | 154 |
| GO:00310583 | Esophagus | ESCC | positive regulation of histone modification | 65/8552 | 92/18723 | 1.04e-06 | 1.31e-05 | 65 |
| GO:004580718 | Esophagus | ESCC | positive regulation of endocytosis | 69/8552 | 100/18723 | 1.97e-06 | 2.29e-05 | 69 |
| GO:00028318 | Esophagus | ESCC | regulation of response to biotic stimulus | 191/8552 | 327/18723 | 2.12e-06 | 2.45e-05 | 191 |
| GO:000038019 | Esophagus | ESCC | alternative mRNA splicing, via spliceosome | 55/8552 | 77/18723 | 4.07e-06 | 4.38e-05 | 55 |
| GO:00066446 | Esophagus | ESCC | phospholipid metabolic process | 218/8552 | 383/18723 | 5.37e-06 | 5.59e-05 | 218 |
| GO:004311218 | Esophagus | ESCC | receptor metabolic process | 104/8552 | 166/18723 | 7.44e-06 | 7.37e-05 | 104 |
| GO:003134616 | Esophagus | ESCC | positive regulation of cell projection organization | 201/8552 | 353/18723 | 1.19e-05 | 1.11e-04 | 201 |
| GO:000941611 | Esophagus | ESCC | response to light stimulus | 183/8552 | 320/18723 | 2.03e-05 | 1.76e-04 | 183 |
| GO:1903312111 | Esophagus | ESCC | negative regulation of mRNA metabolic process | 62/8552 | 92/18723 | 2.08e-05 | 1.80e-04 | 62 |
| GO:20010228 | Esophagus | ESCC | positive regulation of response to DNA damage stimulus | 69/8552 | 105/18723 | 2.66e-05 | 2.22e-04 | 69 |
| GO:005185115 | Esophagus | ESCC | modulation by host of symbiont process | 43/8552 | 60/18723 | 4.00e-05 | 3.22e-04 | 43 |
| GO:190390217 | Esophagus | ESCC | positive regulation of viral life cycle | 24/8552 | 29/18723 | 4.50e-05 | 3.55e-04 | 24 |
| GO:004800220 | Esophagus | ESCC | antigen processing and presentation of peptide antigen | 44/8552 | 62/18723 | 4.81e-05 | 3.78e-04 | 44 |
| GO:00066505 | Esophagus | ESCC | glycerophospholipid metabolic process | 174/8552 | 306/18723 | 4.92e-05 | 3.85e-04 | 174 |
| Page: 1 2 3 4 5 6 7 8 9 10 11 12 13 14 15 16 17 18 19 20 21 22 23 24 25 26 27 28 29 30 31 32 33 34 35 36 37 38 |
| Pathway ID | Tissue | Disease Stage | Description | Gene Ratio | Bg Ratio | pvalue | p.adjust | qvalue | Count |
| Page: 1 |
Top |
Cell-cell communication analysis |
| Identification of potential cell-cell interactions between two cell types and their ligand-receptor pairs for different disease states |
| Ligand | Receptor | LRpair | Pathway | Tissue | Disease Stage |
| Page: 1 |
Top |
Single-cell gene regulatory network inference analysis |
| Find out the significant the regulons (TFs) and the target genes of each regulon across cell types for different disease states |
| TF | Cell Type | Tissue | Disease Stage | Target Gene | RSS | Regulon Activity |
| ∗The dot plots of a searched regulon are shown for all cell subpopulations in each disease state of each tissue based on the regulon specific score inferred using pySCENIC and by calculating the average expression. |
| Page: 1 |
Top |
Somatic mutation of malignant transformation related genes |
| Annotation of somatic variants for genes involved in malignant transformation |
| Hugo Symbol | Variant Class | Variant Classification | dbSNP RS | HGVSc | HGVSp | HGVSp Short | SWISSPROT | BIOTYPE | SIFT | PolyPhen | Tumor Sample Barcode | Tissue | Histology | Sex | Age | Stage | Therapy Types | Drugs | Outcome |
| MR1 | SNV | Missense_Mutation | c.1022G>A | p.Arg341Gln | p.R341Q | Q95460 | protein_coding | tolerated_low_confidence(1) | benign(0) | TCGA-A8-A095-01 | Breast | breast invasive carcinoma | Female | <65 | I/II | Chemotherapy | 5-fluorouracil | CR | |
| MR1 | SNV | Missense_Mutation | c.334C>G | p.His112Asp | p.H112D | Q95460 | protein_coding | deleterious(0) | benign(0.393) | TCGA-AC-A23H-01 | Breast | breast invasive carcinoma | Female | >=65 | I/II | Unknown | Unknown | PD | |
| MR1 | SNV | Missense_Mutation | c.176A>G | p.Asp59Gly | p.D59G | Q95460 | protein_coding | deleterious(0) | benign(0.371) | TCGA-BH-A18G-01 | Breast | breast invasive carcinoma | Female | >=65 | I/II | Unknown | Unknown | SD | |
| MR1 | SNV | Missense_Mutation | c.65N>T | p.Ser22Phe | p.S22F | Q95460 | protein_coding | deleterious(0.01) | benign(0.06) | TCGA-D8-A1JA-01 | Breast | breast invasive carcinoma | Female | <65 | III/IV | Chemotherapy | adriamycin | PD | |
| MR1 | SNV | Missense_Mutation | novel | c.382A>G | p.Thr128Ala | p.T128A | Q95460 | protein_coding | tolerated(0.08) | possibly_damaging(0.682) | TCGA-OL-A6VR-01 | Breast | breast invasive carcinoma | Female | <65 | I/II | Unknown | Unknown | SD |
| MR1 | SNV | Missense_Mutation | novel | c.148G>A | p.Val50Met | p.V50M | Q95460 | protein_coding | deleterious(0.01) | probably_damaging(0.999) | TCGA-DS-A1OB-01 | Cervix | cervical & endocervical cancer | Female | <65 | I/II | Chemotherapy | carboplatin | PD |
| MR1 | SNV | Missense_Mutation | novel | c.823N>G | p.Leu275Val | p.L275V | Q95460 | protein_coding | tolerated(0.62) | benign(0.005) | TCGA-VS-A8EK-01 | Cervix | cervical & endocervical cancer | Female | >=65 | I/II | Chemotherapy | cisplatin | PD |
| MR1 | SNV | Missense_Mutation | rs377066166 | c.816N>A | p.Ser272Arg | p.S272R | Q95460 | protein_coding | deleterious(0.04) | possibly_damaging(0.452) | TCGA-A6-6782-01 | Colorectum | colon adenocarcinoma | Male | >=65 | I/II | Unknown | Unknown | SD |
| MR1 | SNV | Missense_Mutation | rs775161220 | c.137C>T | p.Ser46Leu | p.S46L | Q95460 | protein_coding | tolerated(0.1) | probably_damaging(0.998) | TCGA-AA-3510-01 | Colorectum | colon adenocarcinoma | Male | >=65 | I/II | Unknown | Unknown | SD |
| MR1 | SNV | Missense_Mutation | rs775161220 | c.137C>T | p.Ser46Leu | p.S46L | Q95460 | protein_coding | tolerated(0.1) | probably_damaging(0.998) | TCGA-AA-3977-01 | Colorectum | colon adenocarcinoma | Male | >=65 | I/II | Unknown | Unknown | SD |
| Page: 1 2 3 4 5 |
Top |
Related drugs of malignant transformation related genes |
| Identification of chemicals and drugs interact with genes involved in malignant transfromation |
| (DGIdb 4.0) |
| Entrez ID | Symbol | Category | Interaction Types | Drug Claim Name | Drug Name | PMIDs |
| 3140 | MR1 | DRUGGABLE GENOME, EXTERNAL SIDE OF PLASMA MEMBRANE | ANTITHYMOCYTE GLOBULIN |
| Page: 1 |

Copyright 2023-Present -The University of Texas Health Science Center at Houston |