
|
|||||
|
 | |
| |
| |
| |
| |
| |
|
Gene: MMD |
Gene summary for MMD |
| Gene information | Species | Human | Gene symbol | MMD | Gene ID | 23531 |
| Gene name | monocyte to macrophage differentiation associated | |
| Gene Alias | MMA | |
| Cytomap | 17q22 | |
| Gene Type | protein-coding | GO ID | GO:0001932 | UniProtAcc | Q15546 |
Top |
Malignant transformation analysis |
| Identification of the aberrant gene expression in precancerous and cancerous lesions by comparing the gene expression of stem-like cells in diseased tissues with normal stem cells |
| Entrez ID | Symbol | Replicates | Species | Organ | Tissue | Adj P-value | Log2FC | Malignancy |
| 23531 | MMD | P2T-E | Human | Esophagus | ESCC | 2.65e-18 | 3.53e-01 | 0.1177 |
| 23531 | MMD | P4T-E | Human | Esophagus | ESCC | 8.53e-15 | 4.80e-01 | 0.1323 |
| 23531 | MMD | P8T-E | Human | Esophagus | ESCC | 1.97e-10 | 1.79e-01 | 0.0889 |
| 23531 | MMD | P9T-E | Human | Esophagus | ESCC | 2.19e-10 | 3.28e-01 | 0.1131 |
| 23531 | MMD | P10T-E | Human | Esophagus | ESCC | 4.71e-53 | 8.48e-01 | 0.116 |
| 23531 | MMD | P11T-E | Human | Esophagus | ESCC | 1.92e-04 | 2.66e-01 | 0.1426 |
| 23531 | MMD | P12T-E | Human | Esophagus | ESCC | 1.75e-25 | 4.92e-01 | 0.1122 |
| 23531 | MMD | P15T-E | Human | Esophagus | ESCC | 3.42e-03 | 2.56e-01 | 0.1149 |
| 23531 | MMD | P16T-E | Human | Esophagus | ESCC | 1.96e-11 | 2.45e-01 | 0.1153 |
| 23531 | MMD | P21T-E | Human | Esophagus | ESCC | 8.08e-19 | 3.85e-01 | 0.1617 |
| 23531 | MMD | P22T-E | Human | Esophagus | ESCC | 4.24e-18 | 3.19e-01 | 0.1236 |
| 23531 | MMD | P24T-E | Human | Esophagus | ESCC | 1.26e-02 | 9.15e-02 | 0.1287 |
| 23531 | MMD | P26T-E | Human | Esophagus | ESCC | 3.19e-23 | 4.29e-01 | 0.1276 |
| 23531 | MMD | P27T-E | Human | Esophagus | ESCC | 1.60e-10 | 2.40e-01 | 0.1055 |
| 23531 | MMD | P28T-E | Human | Esophagus | ESCC | 9.53e-09 | 1.51e-01 | 0.1149 |
| 23531 | MMD | P30T-E | Human | Esophagus | ESCC | 2.02e-07 | 4.88e-01 | 0.137 |
| 23531 | MMD | P31T-E | Human | Esophagus | ESCC | 7.31e-14 | 2.37e-01 | 0.1251 |
| 23531 | MMD | P32T-E | Human | Esophagus | ESCC | 1.88e-11 | 2.86e-01 | 0.1666 |
| 23531 | MMD | P37T-E | Human | Esophagus | ESCC | 5.88e-05 | 2.66e-01 | 0.1371 |
| 23531 | MMD | P39T-E | Human | Esophagus | ESCC | 2.09e-05 | 6.41e-02 | 0.0894 |
| Page: 1 2 3 |
| Tissue | Expression Dynamics | Abbreviation |
| Esophagus | 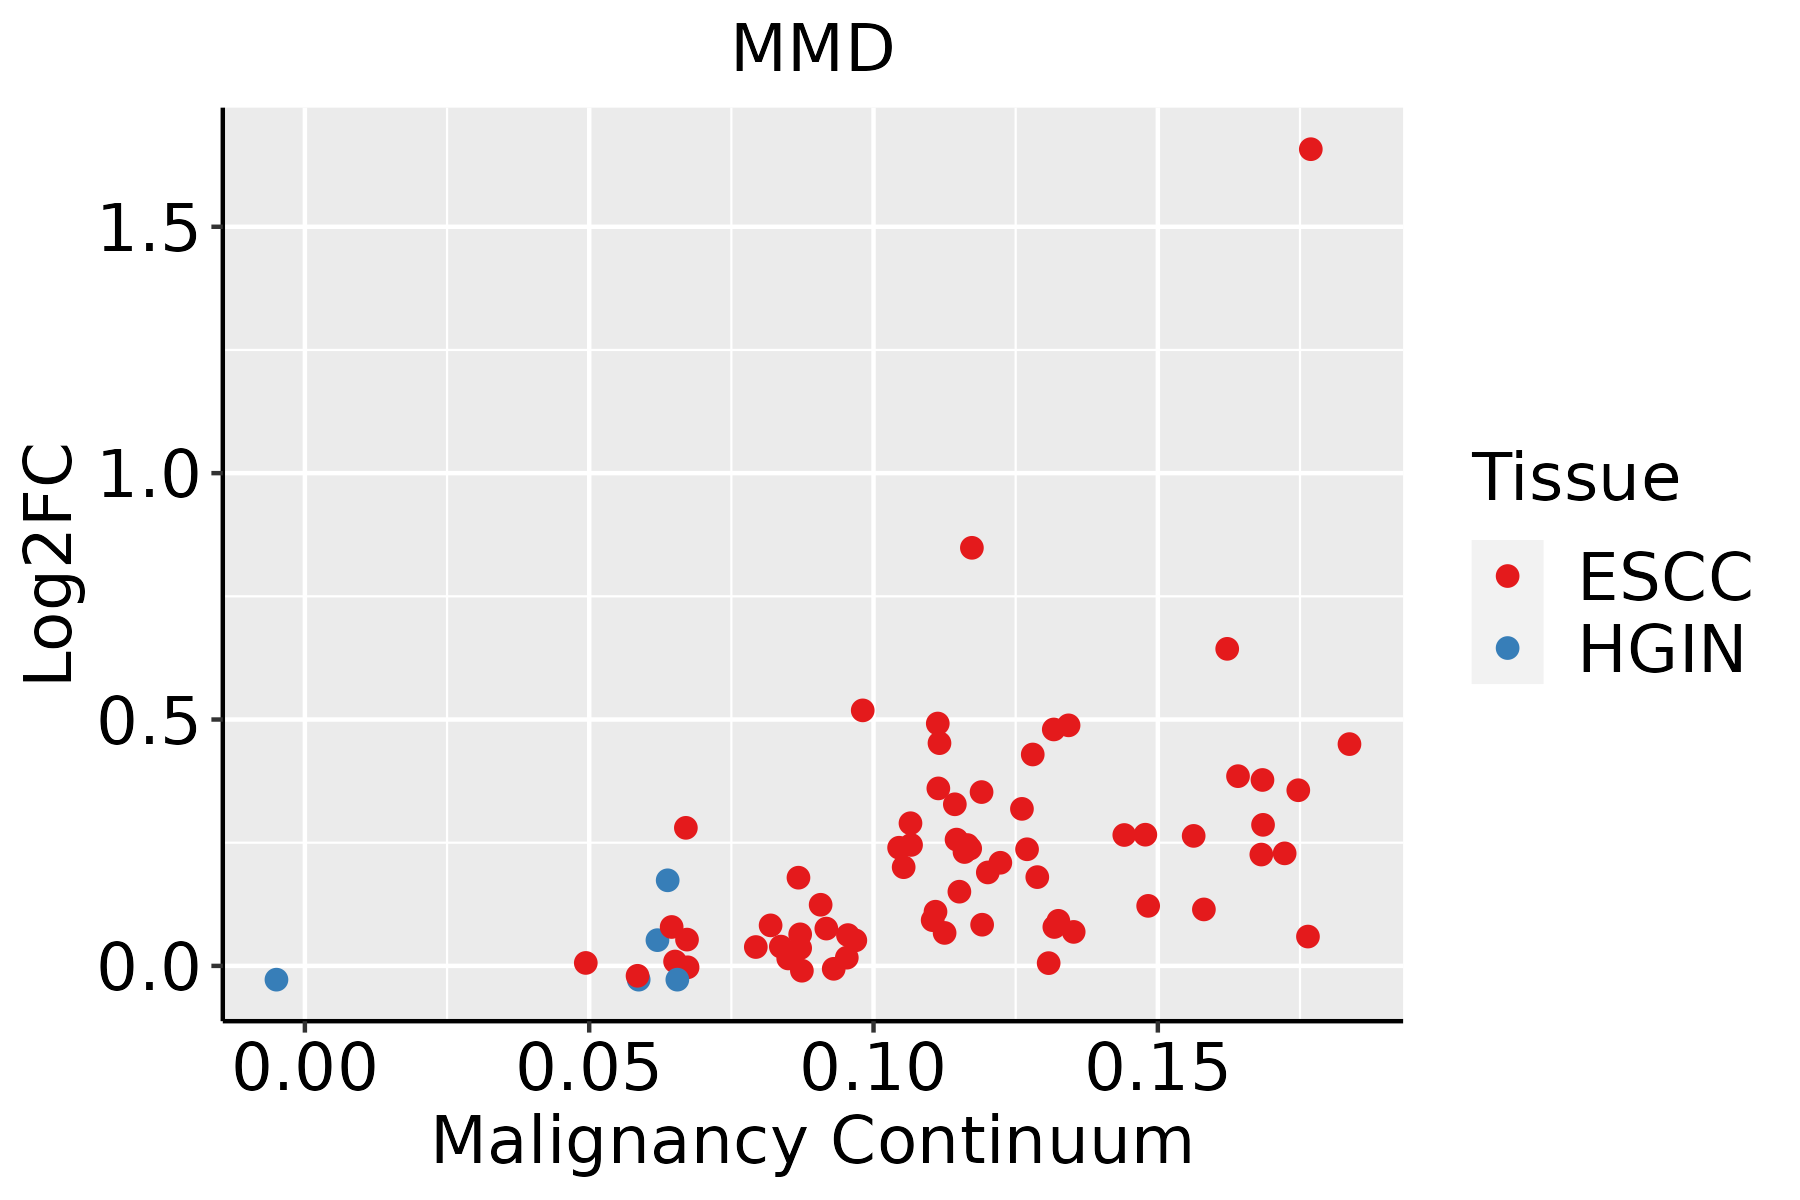 | ESCC: Esophageal squamous cell carcinoma |
| HGIN: High-grade intraepithelial neoplasias | ||
| LGIN: Low-grade intraepithelial neoplasias | ||
| Liver | 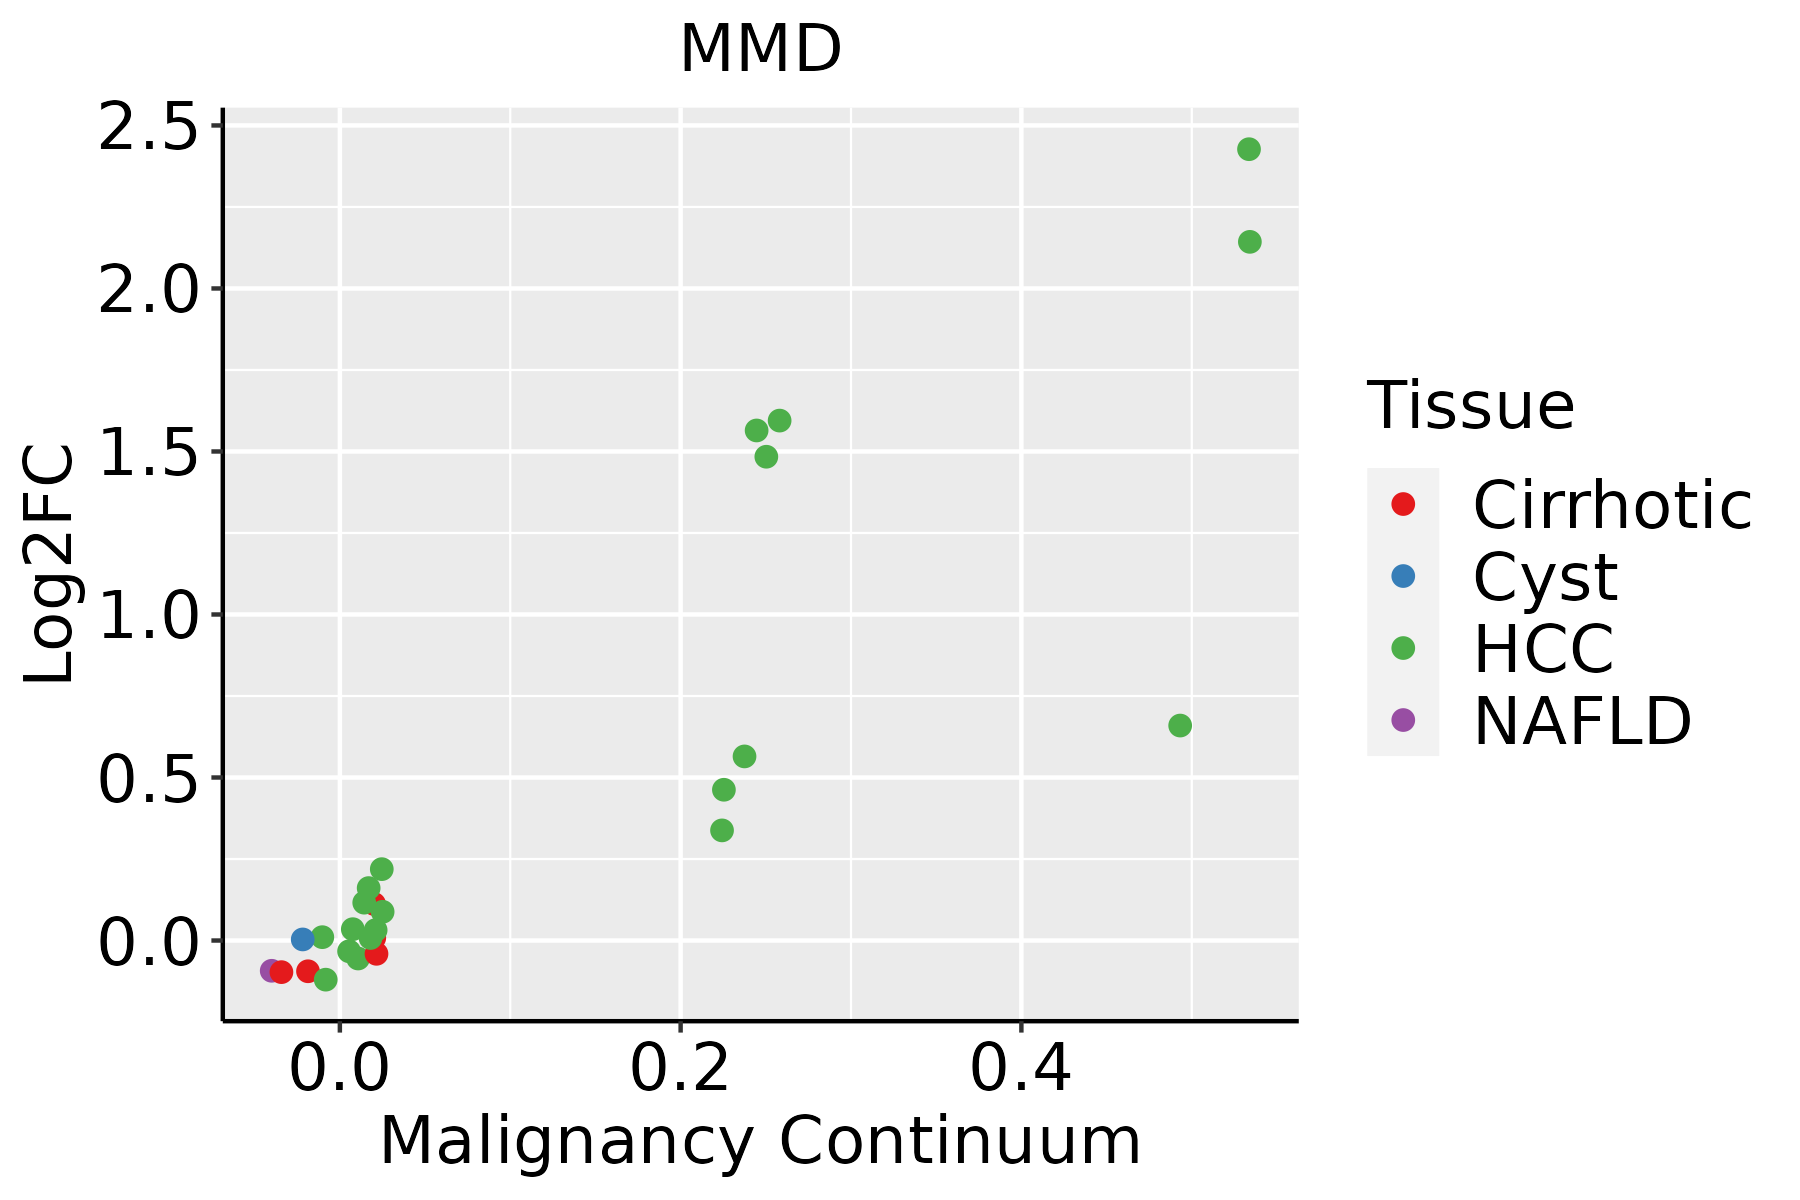 | HCC: Hepatocellular carcinoma |
| NAFLD: Non-alcoholic fatty liver disease |
| ∗log2FC in expression of this searched gene in stem-like cells from each diseased tissue sample relative to stem-like cells in normal samples in each tissue plotted against the malignancy continuum. Samples are colored based on if they are from different disease stage. |
Top |
Malignant transformation related pathway analysis |
| Find out the enriched GO biological processes and KEGG pathways involved in transition from healthy to precancer to cancer |
| Tissue | Disease Stage | Enriched GO biological Processes |
| Colorectum | AD |  |
| Colorectum | SER |  |
| Colorectum | MSS |  |
| Colorectum | MSI-H |  |
| Colorectum | FAP |  |
| ∗Top 15 enriched GO BP terms are showed in the bar plot of each disease state in each tissue. Each row represents a significant GO biological process which is colored according to the -log10(p.adjust). |
| Page: 1 2 3 4 5 6 7 8 9 |
| GO ID | Tissue | Disease Stage | Description | Gene Ratio | Bg Ratio | pvalue | p.adjust | Count |
| GO:00068141 | Colorectum | CRC | sodium ion transport | 49/2078 | 245/18723 | 3.01e-05 | 7.86e-04 | 49 |
| GO:19030505 | Colorectum | CRC | regulation of proteolysis involved in cellular protein catabolic process | 45/2078 | 221/18723 | 3.96e-05 | 9.60e-04 | 45 |
| GO:00313965 | Colorectum | CRC | regulation of protein ubiquitination | 42/2078 | 210/18723 | 1.08e-04 | 2.13e-03 | 42 |
| GO:00109591 | Colorectum | CRC | regulation of metal ion transport | 69/2078 | 406/18723 | 2.05e-04 | 3.48e-03 | 69 |
| GO:00431615 | Colorectum | CRC | proteasome-mediated ubiquitin-dependent protein catabolic process | 69/2078 | 412/18723 | 3.16e-04 | 4.90e-03 | 69 |
| GO:00324345 | Colorectum | CRC | regulation of proteasomal ubiquitin-dependent protein catabolic process | 28/2078 | 134/18723 | 6.94e-04 | 9.05e-03 | 28 |
| GO:00104985 | Colorectum | CRC | proteasomal protein catabolic process | 77/2078 | 490/18723 | 1.03e-03 | 1.21e-02 | 77 |
| GO:19040621 | Colorectum | CRC | regulation of cation transmembrane transport | 58/2078 | 357/18723 | 1.89e-03 | 1.93e-02 | 58 |
| GO:00510513 | Colorectum | CRC | negative regulation of transport | 71/2078 | 470/18723 | 4.33e-03 | 3.47e-02 | 71 |
| GO:19038283 | Colorectum | CRC | negative regulation of cellular protein localization | 23/2078 | 117/18723 | 4.49e-03 | 3.51e-02 | 23 |
| GO:00107661 | Colorectum | CRC | negative regulation of sodium ion transport | 7/2078 | 21/18723 | 5.85e-03 | 4.32e-02 | 7 |
| GO:00510905 | Endometrium | AEH | regulation of DNA-binding transcription factor activity | 69/2100 | 440/18723 | 2.51e-03 | 1.87e-02 | 69 |
| GO:005109013 | Endometrium | EEC | regulation of DNA-binding transcription factor activity | 75/2168 | 440/18723 | 3.71e-04 | 3.97e-03 | 75 |
| GO:004217627 | Esophagus | HGIN | regulation of protein catabolic process | 119/2587 | 391/18723 | 8.09e-18 | 2.43e-15 | 119 |
| GO:001049826 | Esophagus | HGIN | proteasomal protein catabolic process | 139/2587 | 490/18723 | 1.20e-17 | 3.41e-15 | 139 |
| GO:004316126 | Esophagus | HGIN | proteasome-mediated ubiquitin-dependent protein catabolic process | 114/2587 | 412/18723 | 7.00e-14 | 1.20e-11 | 114 |
| GO:190336227 | Esophagus | HGIN | regulation of cellular protein catabolic process | 81/2587 | 255/18723 | 1.16e-13 | 1.93e-11 | 81 |
| GO:190332027 | Esophagus | HGIN | regulation of protein modification by small protein conjugation or removal | 78/2587 | 242/18723 | 1.40e-13 | 2.26e-11 | 78 |
| GO:190305027 | Esophagus | HGIN | regulation of proteolysis involved in cellular protein catabolic process | 70/2587 | 221/18723 | 6.21e-12 | 7.76e-10 | 70 |
| GO:004819317 | Esophagus | HGIN | Golgi vesicle transport | 83/2587 | 296/18723 | 8.59e-11 | 8.89e-09 | 83 |
| Page: 1 2 3 4 5 6 7 8 9 10 11 12 13 14 15 16 17 18 19 20 |
| Pathway ID | Tissue | Disease Stage | Description | Gene Ratio | Bg Ratio | pvalue | p.adjust | qvalue | Count |
| Page: 1 |
Top |
Cell-cell communication analysis |
| Identification of potential cell-cell interactions between two cell types and their ligand-receptor pairs for different disease states |
| Ligand | Receptor | LRpair | Pathway | Tissue | Disease Stage |
| Page: 1 |
Top |
Single-cell gene regulatory network inference analysis |
| Find out the significant the regulons (TFs) and the target genes of each regulon across cell types for different disease states |
| TF | Cell Type | Tissue | Disease Stage | Target Gene | RSS | Regulon Activity |
| ∗The dot plots of a searched regulon are shown for all cell subpopulations in each disease state of each tissue based on the regulon specific score inferred using pySCENIC and by calculating the average expression. |
| Page: 1 |
Top |
Somatic mutation of malignant transformation related genes |
| Annotation of somatic variants for genes involved in malignant transformation |
| Hugo Symbol | Variant Class | Variant Classification | dbSNP RS | HGVSc | HGVSp | HGVSp Short | SWISSPROT | BIOTYPE | SIFT | PolyPhen | Tumor Sample Barcode | Tissue | Histology | Sex | Age | Stage | Therapy Types | Drugs | Outcome |
| MMD | SNV | Missense_Mutation | c.121C>T | p.Pro41Ser | p.P41S | Q15546 | protein_coding | deleterious(0) | probably_damaging(1) | TCGA-A7-A0D9-01 | Breast | breast invasive carcinoma | Female | <65 | I/II | Chemotherapy | taxotere | SD | |
| MMD | SNV | Missense_Mutation | novel | c.605N>T | p.Pro202Leu | p.P202L | Q15546 | protein_coding | deleterious(0.02) | possibly_damaging(0.766) | TCGA-2W-A8YY-01 | Cervix | cervical & endocervical cancer | Female | <65 | I/II | Chemotherapy | cisplatin | CR |
| MMD | SNV | Missense_Mutation | c.649G>A | p.Ala217Thr | p.A217T | Q15546 | protein_coding | tolerated(0.09) | possibly_damaging(0.543) | TCGA-F4-6570-01 | Colorectum | colon adenocarcinoma | Female | >=65 | I/II | Unknown | Unknown | SD | |
| MMD | insertion | Frame_Shift_Ins | novel | c.713_714insT | p.Leu238PhefsTer7 | p.L238Ffs*7 | Q15546 | protein_coding | TCGA-AD-6889-01 | Colorectum | colon adenocarcinoma | Male | >=65 | I/II | Chemotherapy | xeloda | PD | ||
| MMD | SNV | Missense_Mutation | novel | c.134N>A | p.Gly45Asp | p.G45D | Q15546 | protein_coding | deleterious(0) | probably_damaging(0.999) | TCGA-A5-A0G1-01 | Endometrium | uterine corpus endometrioid carcinoma | Female | >=65 | I/II | Unknown | Unknown | SD |
| MMD | SNV | Missense_Mutation | rs772130160 | c.632N>C | p.Phe211Ser | p.F211S | Q15546 | protein_coding | deleterious(0) | probably_damaging(0.998) | TCGA-A5-A1OF-01 | Endometrium | uterine corpus endometrioid carcinoma | Female | <65 | I/II | Unknown | Unknown | SD |
| MMD | SNV | Missense_Mutation | novel | c.559N>C | p.Ile187Leu | p.I187L | Q15546 | protein_coding | tolerated(0.54) | benign(0) | TCGA-AP-A059-01 | Endometrium | uterine corpus endometrioid carcinoma | Female | >=65 | I/II | Unknown | Unknown | SD |
| MMD | SNV | Missense_Mutation | c.355C>T | p.Arg119Cys | p.R119C | Q15546 | protein_coding | deleterious(0) | probably_damaging(0.996) | TCGA-AP-A0LM-01 | Endometrium | uterine corpus endometrioid carcinoma | Female | <65 | III/IV | Chemotherapy | cisplatin | SD | |
| MMD | SNV | Missense_Mutation | rs374125073 | c.223G>A | p.Val75Ile | p.V75I | Q15546 | protein_coding | tolerated(0.07) | benign(0.044) | TCGA-AP-A0LM-01 | Endometrium | uterine corpus endometrioid carcinoma | Female | <65 | III/IV | Chemotherapy | cisplatin | SD |
| MMD | SNV | Missense_Mutation | c.12N>T | p.Lys4Asn | p.K4N | Q15546 | protein_coding | tolerated(0.13) | benign(0) | TCGA-AP-A1DV-01 | Endometrium | uterine corpus endometrioid carcinoma | Female | <65 | I/II | Unknown | Unknown | SD |
| Page: 1 2 3 |
Top |
Related drugs of malignant transformation related genes |
| Identification of chemicals and drugs interact with genes involved in malignant transfromation |
| (DGIdb 4.0) |
| Entrez ID | Symbol | Category | Interaction Types | Drug Claim Name | Drug Name | PMIDs |
| Page: 1 |

Copyright 2023-Present -The University of Texas Health Science Center at Houston |