
|
|||||
|
 | |
| |
| |
| |
| |
| |
|
Gene: MFN1 |
Gene summary for MFN1 |
| Gene information | Species | Human | Gene symbol | MFN1 | Gene ID | 55669 |
| Gene name | mitofusin 1 | |
| Gene Alias | hfzo1 | |
| Cytomap | 3q26.33 | |
| Gene Type | protein-coding | GO ID | GO:0006139 | UniProtAcc | A0A0C4DFN1 |
Top |
Malignant transformation analysis |
| Identification of the aberrant gene expression in precancerous and cancerous lesions by comparing the gene expression of stem-like cells in diseased tissues with normal stem cells |
| Entrez ID | Symbol | Replicates | Species | Organ | Tissue | Adj P-value | Log2FC | Malignancy |
| 55669 | MFN1 | CA_HPV_2 | Human | Cervix | CC | 2.35e-08 | 3.93e-01 | 0.0391 |
| 55669 | MFN1 | CCI_1 | Human | Cervix | CC | 2.43e-02 | 4.84e-01 | 0.528 |
| 55669 | MFN1 | CCI_2 | Human | Cervix | CC | 3.59e-09 | 9.62e-01 | 0.5249 |
| 55669 | MFN1 | CCI_3 | Human | Cervix | CC | 1.28e-03 | 5.47e-01 | 0.516 |
| 55669 | MFN1 | LZE4T | Human | Esophagus | ESCC | 2.44e-11 | 3.50e-01 | 0.0811 |
| 55669 | MFN1 | LZE5T | Human | Esophagus | ESCC | 2.88e-05 | 5.29e-01 | 0.0514 |
| 55669 | MFN1 | LZE7T | Human | Esophagus | ESCC | 2.13e-03 | 2.78e-01 | 0.0667 |
| 55669 | MFN1 | LZE8T | Human | Esophagus | ESCC | 5.24e-07 | 2.81e-01 | 0.067 |
| 55669 | MFN1 | LZE20T | Human | Esophagus | ESCC | 6.00e-06 | 1.30e-01 | 0.0662 |
| 55669 | MFN1 | LZE24T | Human | Esophagus | ESCC | 5.74e-16 | 4.89e-01 | 0.0596 |
| 55669 | MFN1 | LZE6T | Human | Esophagus | ESCC | 6.87e-05 | 2.84e-01 | 0.0845 |
| 55669 | MFN1 | P1T-E | Human | Esophagus | ESCC | 2.81e-07 | 4.07e-01 | 0.0875 |
| 55669 | MFN1 | P2T-E | Human | Esophagus | ESCC | 1.46e-37 | 7.74e-01 | 0.1177 |
| 55669 | MFN1 | P4T-E | Human | Esophagus | ESCC | 9.21e-20 | 4.98e-01 | 0.1323 |
| 55669 | MFN1 | P5T-E | Human | Esophagus | ESCC | 1.15e-27 | 6.04e-01 | 0.1327 |
| 55669 | MFN1 | P8T-E | Human | Esophagus | ESCC | 1.50e-16 | 3.20e-01 | 0.0889 |
| 55669 | MFN1 | P9T-E | Human | Esophagus | ESCC | 1.13e-05 | 2.34e-01 | 0.1131 |
| 55669 | MFN1 | P10T-E | Human | Esophagus | ESCC | 5.65e-23 | 4.84e-01 | 0.116 |
| 55669 | MFN1 | P11T-E | Human | Esophagus | ESCC | 4.17e-04 | 3.46e-01 | 0.1426 |
| 55669 | MFN1 | P12T-E | Human | Esophagus | ESCC | 1.42e-25 | 5.91e-01 | 0.1122 |
| Page: 1 2 3 4 5 |
| Tissue | Expression Dynamics | Abbreviation |
| Cervix |  | CC: Cervix cancer |
| HSIL_HPV: HPV-infected high-grade squamous intraepithelial lesions | ||
| N_HPV: HPV-infected normal cervix | ||
| Esophagus | 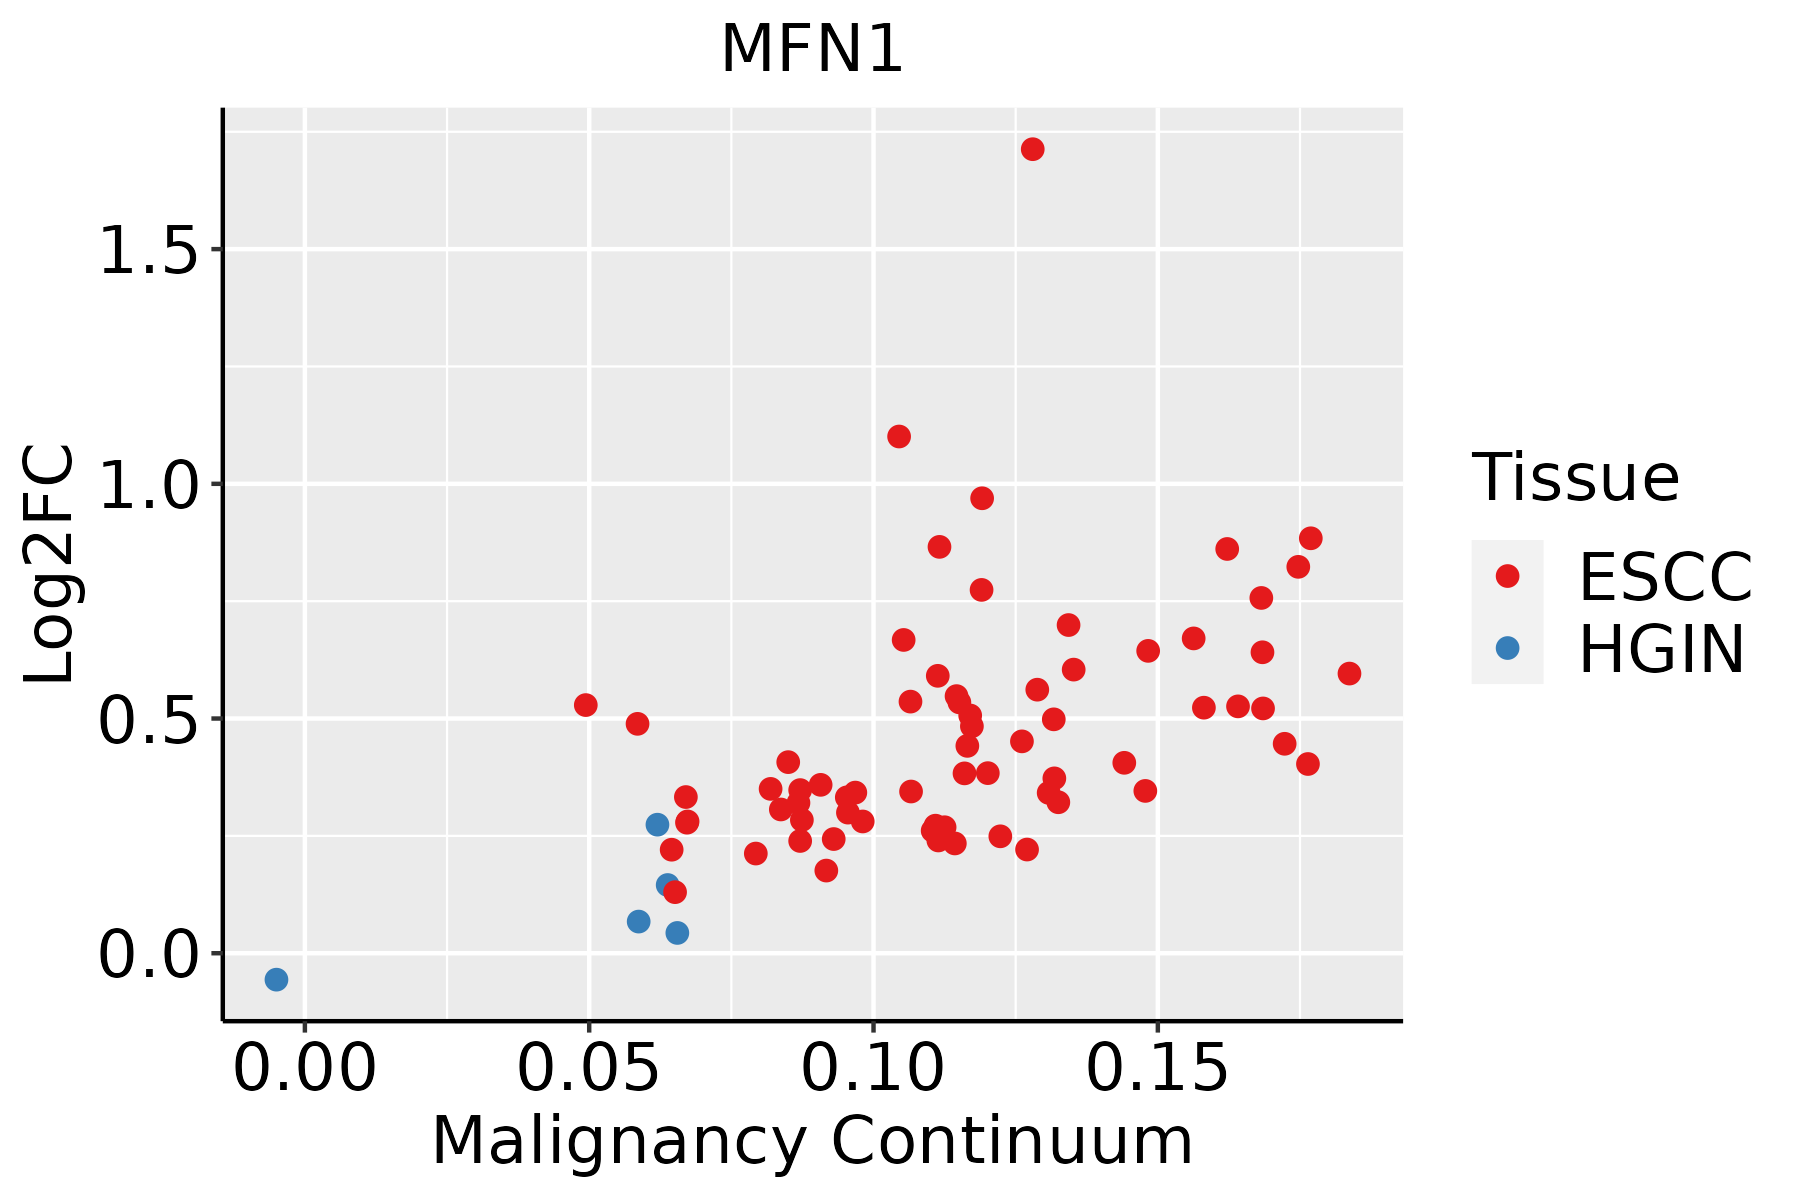 | ESCC: Esophageal squamous cell carcinoma |
| HGIN: High-grade intraepithelial neoplasias | ||
| LGIN: Low-grade intraepithelial neoplasias | ||
| Oral Cavity | 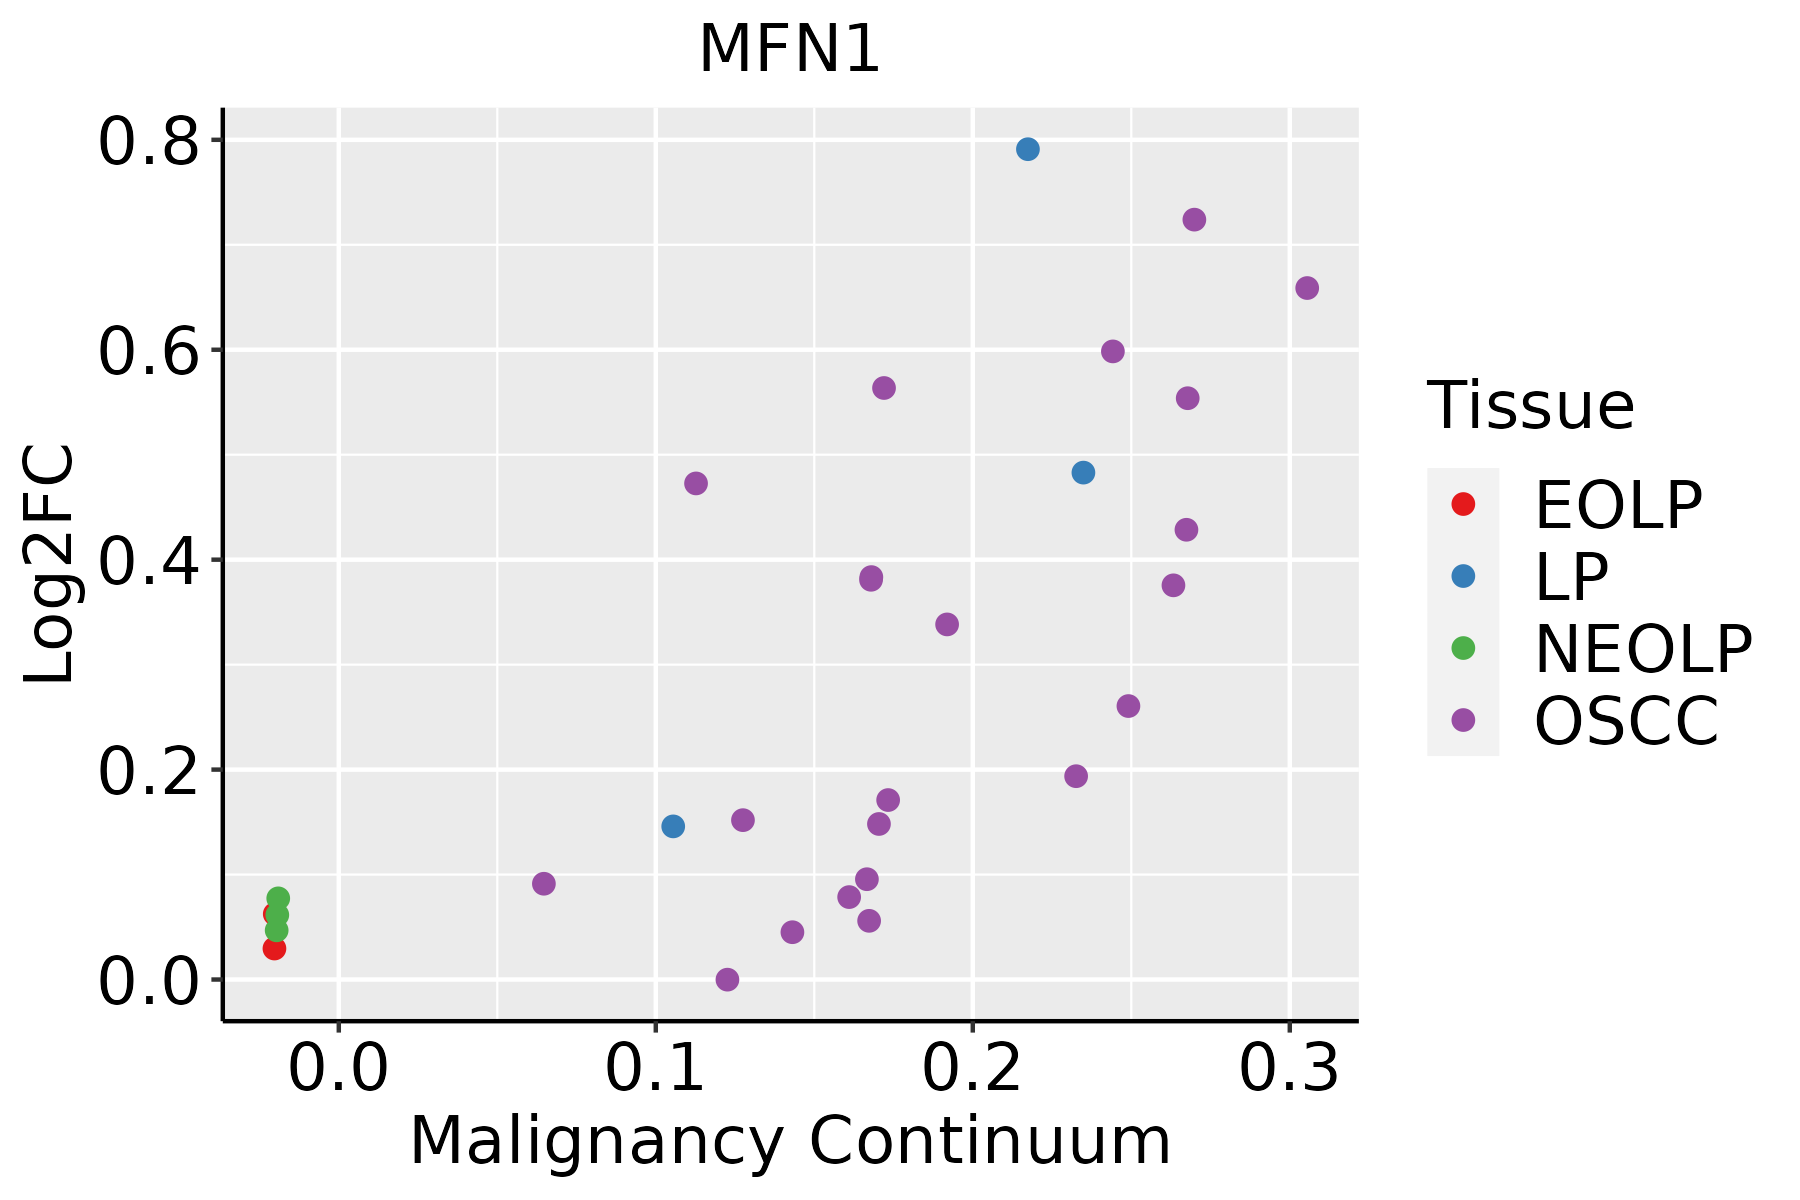 | EOLP: Erosive Oral lichen planus |
| LP: leukoplakia | ||
| NEOLP: Non-erosive oral lichen planus | ||
| OSCC: Oral squamous cell carcinoma | ||
| Skin | 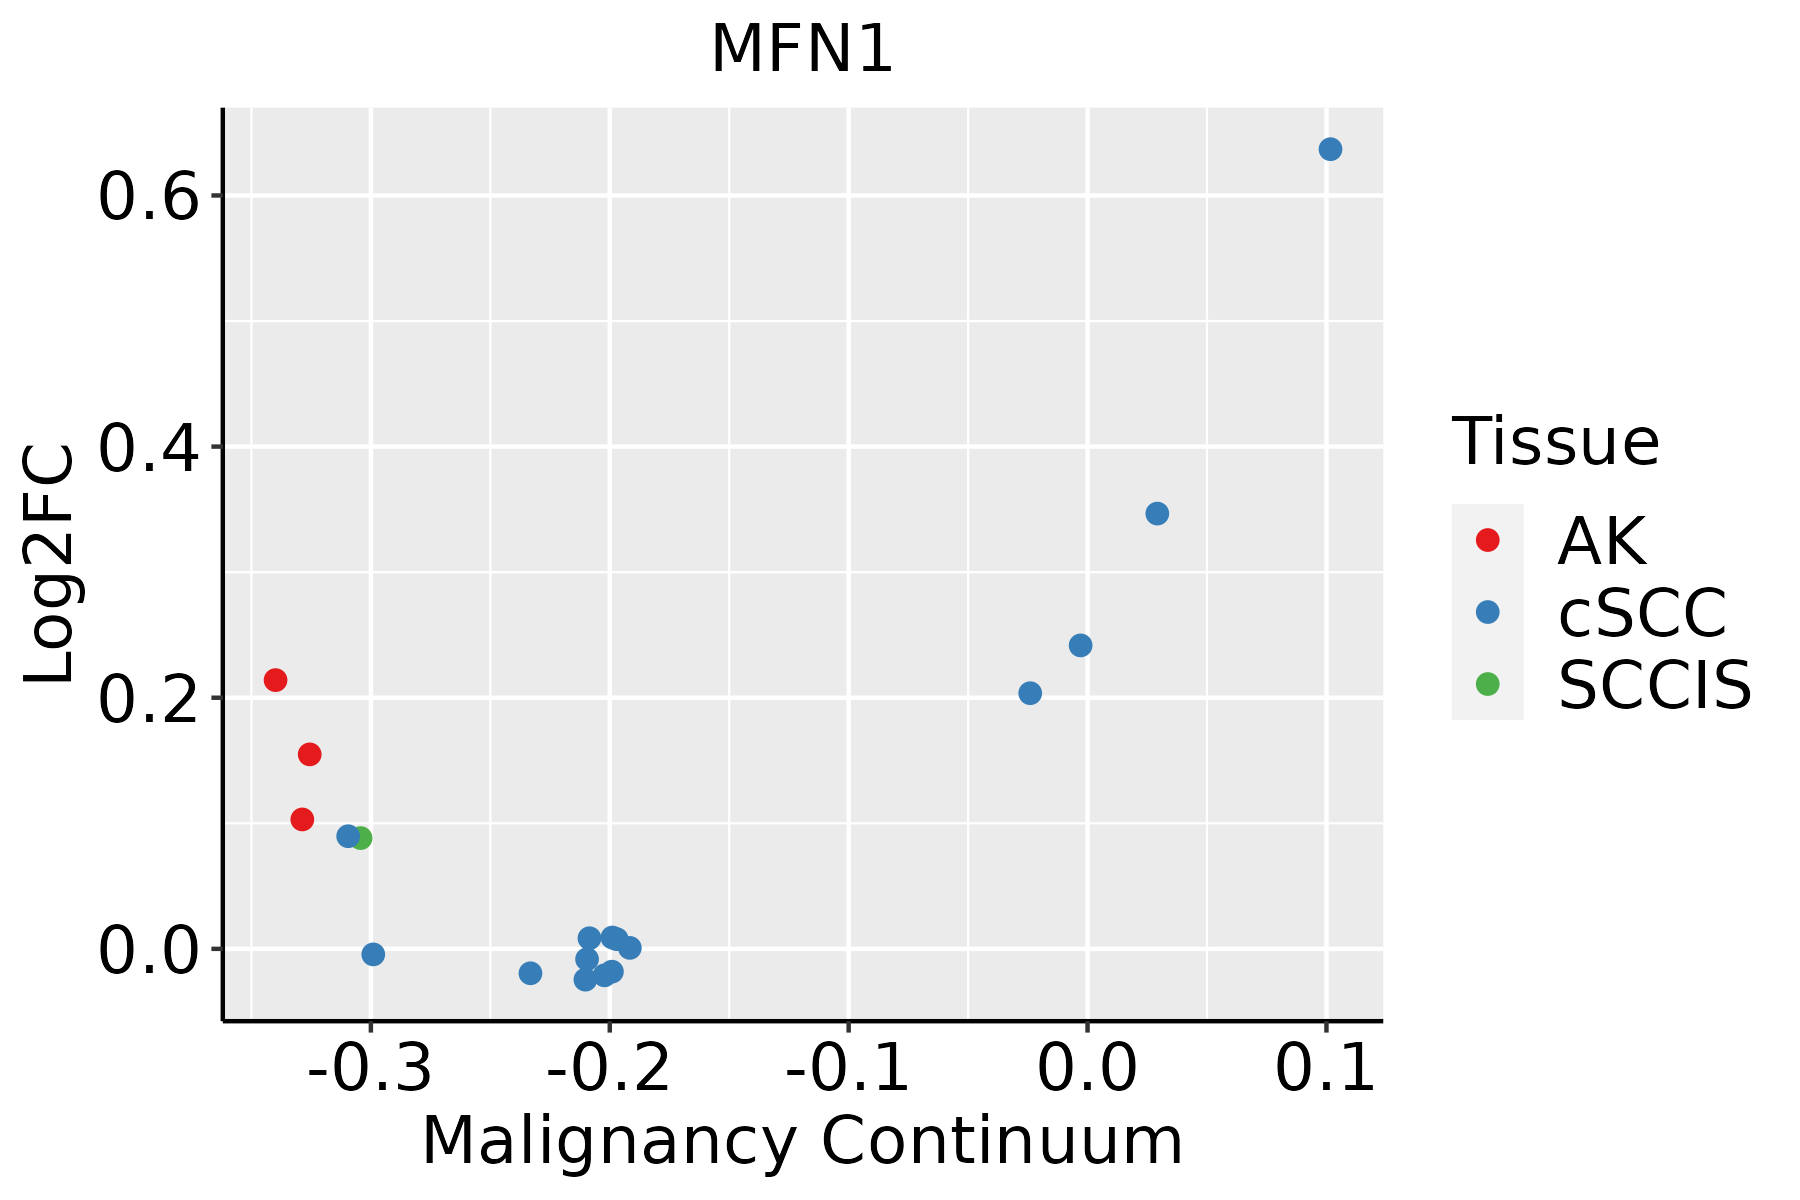 | AK: Actinic keratosis |
| cSCC: Cutaneous squamous cell carcinoma | ||
| SCCIS:squamous cell carcinoma in situ |
| ∗log2FC in expression of this searched gene in stem-like cells from each diseased tissue sample relative to stem-like cells in normal samples in each tissue plotted against the malignancy continuum. Samples are colored based on if they are from different disease stage. |
Top |
Malignant transformation related pathway analysis |
| Find out the enriched GO biological processes and KEGG pathways involved in transition from healthy to precancer to cancer |
| Tissue | Disease Stage | Enriched GO biological Processes |
| Colorectum | AD |  |
| Colorectum | SER |  |
| Colorectum | MSS |  |
| Colorectum | MSI-H |  |
| Colorectum | FAP |  |
| ∗Top 15 enriched GO BP terms are showed in the bar plot of each disease state in each tissue. Each row represents a significant GO biological process which is colored according to the -log10(p.adjust). |
| Page: 1 2 3 4 5 6 7 8 9 |
| GO ID | Tissue | Disease Stage | Description | Gene Ratio | Bg Ratio | pvalue | p.adjust | Count |
| GO:000919925 | Skin | cSCC | ribonucleoside triphosphate metabolic process | 42/4864 | 89/18723 | 1.30e-05 | 1.64e-04 | 42 |
| GO:00482845 | Skin | cSCC | organelle fusion | 60/4864 | 141/18723 | 1.32e-05 | 1.67e-04 | 60 |
| GO:0006163112 | Skin | cSCC | purine nucleotide metabolic process | 140/4864 | 396/18723 | 1.93e-05 | 2.27e-04 | 140 |
| GO:000920525 | Skin | cSCC | purine ribonucleoside triphosphate metabolic process | 39/4864 | 82/18723 | 2.08e-05 | 2.43e-04 | 39 |
| GO:0009150112 | Skin | cSCC | purine ribonucleotide metabolic process | 131/4864 | 368/18723 | 2.42e-05 | 2.76e-04 | 131 |
| GO:00610255 | Skin | cSCC | membrane fusion | 63/4864 | 163/18723 | 2.49e-04 | 2.03e-03 | 63 |
| GO:00080533 | Skin | cSCC | mitochondrial fusion | 16/4864 | 27/18723 | 2.60e-04 | 2.10e-03 | 16 |
| GO:00901744 | Skin | cSCC | organelle membrane fusion | 44/4864 | 110/18723 | 8.82e-04 | 6.07e-03 | 44 |
| GO:00460394 | Skin | cSCC | GTP metabolic process | 14/4864 | 25/18723 | 1.37e-03 | 8.68e-03 | 14 |
| GO:005164611 | Skin | cSCC | mitochondrion localization | 22/4864 | 50/18723 | 4.31e-03 | 2.27e-02 | 22 |
| Page: 1 2 3 4 5 |
| Pathway ID | Tissue | Disease Stage | Description | Gene Ratio | Bg Ratio | pvalue | p.adjust | qvalue | Count |
| hsa0501220 | Cervix | CC | Parkinson disease | 102/1267 | 266/8465 | 1.81e-21 | 1.47e-19 | 8.66e-20 | 102 |
| hsa0502218 | Cervix | CC | Pathways of neurodegeneration - multiple diseases | 128/1267 | 476/8465 | 2.87e-12 | 9.29e-11 | 5.50e-11 | 128 |
| hsa0413718 | Cervix | CC | Mitophagy - animal | 22/1267 | 72/8465 | 5.77e-04 | 2.75e-03 | 1.63e-03 | 22 |
| hsa046213 | Cervix | CC | NOD-like receptor signaling pathway | 41/1267 | 186/8465 | 5.90e-03 | 1.95e-02 | 1.15e-02 | 41 |
| hsa05012110 | Cervix | CC | Parkinson disease | 102/1267 | 266/8465 | 1.81e-21 | 1.47e-19 | 8.66e-20 | 102 |
| hsa0502219 | Cervix | CC | Pathways of neurodegeneration - multiple diseases | 128/1267 | 476/8465 | 2.87e-12 | 9.29e-11 | 5.50e-11 | 128 |
| hsa0413719 | Cervix | CC | Mitophagy - animal | 22/1267 | 72/8465 | 5.77e-04 | 2.75e-03 | 1.63e-03 | 22 |
| hsa0462112 | Cervix | CC | NOD-like receptor signaling pathway | 41/1267 | 186/8465 | 5.90e-03 | 1.95e-02 | 1.15e-02 | 41 |
| hsa05012211 | Esophagus | ESCC | Parkinson disease | 201/4205 | 266/8465 | 1.56e-18 | 8.72e-17 | 4.46e-17 | 201 |
| hsa05022210 | Esophagus | ESCC | Pathways of neurodegeneration - multiple diseases | 318/4205 | 476/8465 | 6.10e-15 | 2.04e-13 | 1.05e-13 | 318 |
| hsa04137210 | Esophagus | ESCC | Mitophagy - animal | 54/4205 | 72/8465 | 9.33e-06 | 4.96e-05 | 2.54e-05 | 54 |
| hsa0462122 | Esophagus | ESCC | NOD-like receptor signaling pathway | 116/4205 | 186/8465 | 2.90e-04 | 1.03e-03 | 5.30e-04 | 116 |
| hsa05012310 | Esophagus | ESCC | Parkinson disease | 201/4205 | 266/8465 | 1.56e-18 | 8.72e-17 | 4.46e-17 | 201 |
| hsa0502238 | Esophagus | ESCC | Pathways of neurodegeneration - multiple diseases | 318/4205 | 476/8465 | 6.10e-15 | 2.04e-13 | 1.05e-13 | 318 |
| hsa0413738 | Esophagus | ESCC | Mitophagy - animal | 54/4205 | 72/8465 | 9.33e-06 | 4.96e-05 | 2.54e-05 | 54 |
| hsa0462132 | Esophagus | ESCC | NOD-like receptor signaling pathway | 116/4205 | 186/8465 | 2.90e-04 | 1.03e-03 | 5.30e-04 | 116 |
| hsa0501230 | Oral cavity | OSCC | Parkinson disease | 188/3704 | 266/8465 | 1.82e-19 | 1.52e-17 | 7.75e-18 | 188 |
| hsa0502228 | Oral cavity | OSCC | Pathways of neurodegeneration - multiple diseases | 292/3704 | 476/8465 | 1.60e-15 | 4.47e-14 | 2.28e-14 | 292 |
| hsa0413728 | Oral cavity | OSCC | Mitophagy - animal | 58/3704 | 72/8465 | 1.48e-10 | 2.07e-09 | 1.05e-09 | 58 |
| hsa046218 | Oral cavity | OSCC | NOD-like receptor signaling pathway | 108/3704 | 186/8465 | 5.13e-05 | 2.07e-04 | 1.05e-04 | 108 |
| Page: 1 2 |
Top |
Cell-cell communication analysis |
| Identification of potential cell-cell interactions between two cell types and their ligand-receptor pairs for different disease states |
| Ligand | Receptor | LRpair | Pathway | Tissue | Disease Stage |
| Page: 1 |
Top |
Single-cell gene regulatory network inference analysis |
| Find out the significant the regulons (TFs) and the target genes of each regulon across cell types for different disease states |
| TF | Cell Type | Tissue | Disease Stage | Target Gene | RSS | Regulon Activity |
| ∗The dot plots of a searched regulon are shown for all cell subpopulations in each disease state of each tissue based on the regulon specific score inferred using pySCENIC and by calculating the average expression. |
| Page: 1 |
Top |
Somatic mutation of malignant transformation related genes |
| Annotation of somatic variants for genes involved in malignant transformation |
| Hugo Symbol | Variant Class | Variant Classification | dbSNP RS | HGVSc | HGVSp | HGVSp Short | SWISSPROT | BIOTYPE | SIFT | PolyPhen | Tumor Sample Barcode | Tissue | Histology | Sex | Age | Stage | Therapy Types | Drugs | Outcome |
| MFN1 | SNV | Missense_Mutation | c.17N>G | p.Ser6Cys | p.S6C | protein_coding | deleterious(0) | probably_damaging(1) | TCGA-A8-A08L-01 | Breast | breast invasive carcinoma | Female | >=65 | III/IV | Unknown | Unknown | SD | ||
| MFN1 | SNV | Missense_Mutation | rs748861127 | c.128N>T | p.Pro43Leu | p.P43L | protein_coding | tolerated(0.08) | benign(0.039) | TCGA-AN-A046-01 | Breast | breast invasive carcinoma | Female | >=65 | I/II | Unknown | Unknown | SD | |
| MFN1 | SNV | Missense_Mutation | c.1132N>C | p.Asp378His | p.D378H | protein_coding | deleterious(0) | probably_damaging(0.985) | TCGA-AO-A0J4-01 | Breast | breast invasive carcinoma | Female | <65 | I/II | Chemotherapy | doxorubicin | SD | ||
| MFN1 | SNV | Missense_Mutation | rs774808113 | c.644N>T | p.Thr215Met | p.T215M | protein_coding | deleterious(0) | benign(0.392) | TCGA-UU-A93S-01 | Breast | breast invasive carcinoma | Female | <65 | III/IV | Unknown | Unknown | PD | |
| MFN1 | insertion | Frame_Shift_Ins | novel | c.899_900insGACTGGGTTTCACCATATTGCCCAGGCTGGTCTTG | p.Glu301ThrfsTer45 | p.E301Tfs*45 | protein_coding | TCGA-AN-A0FS-01 | Breast | breast invasive carcinoma | Female | <65 | I/II | Unknown | Unknown | SD | |||
| MFN1 | deletion | Frame_Shift_Del | novel | c.1955delN | p.Lys653AsnfsTer2 | p.K653Nfs*2 | protein_coding | TCGA-D8-A27V-01 | Breast | breast invasive carcinoma | Female | <65 | I/II | Hormone Therapy | tamoxiphen | SD | |||
| MFN1 | SNV | Missense_Mutation | novel | c.1863N>T | p.Met621Ile | p.M621I | protein_coding | tolerated(0.37) | benign(0.005) | TCGA-VS-A8QH-01 | Cervix | cervical & endocervical cancer | Female | >=65 | I/II | Chemotherapy | gemcitabine | PD | |
| MFN1 | SNV | Missense_Mutation | novel | c.639G>C | p.Met213Ile | p.M213I | protein_coding | deleterious(0.02) | benign(0.043) | TCGA-VS-A9UL-01 | Cervix | cervical & endocervical cancer | Female | >=65 | III/IV | Unknown | Unknown | PD | |
| MFN1 | SNV | Missense_Mutation | c.845N>C | p.Phe282Ser | p.F282S | protein_coding | deleterious(0) | probably_damaging(0.999) | TCGA-A6-6780-01 | Colorectum | colon adenocarcinoma | Male | >=65 | I/II | Unknown | Unknown | SD | ||
| MFN1 | SNV | Missense_Mutation | c.82N>C | p.Phe28Leu | p.F28L | protein_coding | deleterious(0) | benign(0.197) | TCGA-AA-3864-01 | Colorectum | colon adenocarcinoma | Male | >=65 | I/II | Unknown | Unknown | SD |
| Page: 1 2 3 4 5 6 7 8 |
Top |
Related drugs of malignant transformation related genes |
| Identification of chemicals and drugs interact with genes involved in malignant transfromation |
| (DGIdb 4.0) |
| Entrez ID | Symbol | Category | Interaction Types | Drug Claim Name | Drug Name | PMIDs |
| Page: 1 |

Copyright 2023-Present -The University of Texas Health Science Center at Houston |