
|
|||||
|
 | |
| |
| |
| |
| |
| |
|
Gene: MFF |
Gene summary for MFF |
| Gene information | Species | Human | Gene symbol | MFF | Gene ID | 56947 |
| Gene name | mitochondrial fission factor | |
| Gene Alias | C2orf33 | |
| Cytomap | 2q36.3 | |
| Gene Type | protein-coding | GO ID | GO:0000266 | UniProtAcc | A0A024R491 |
Top |
Malignant transformation analysis |
| Identification of the aberrant gene expression in precancerous and cancerous lesions by comparing the gene expression of stem-like cells in diseased tissues with normal stem cells |
| Entrez ID | Symbol | Replicates | Species | Organ | Tissue | Adj P-value | Log2FC | Malignancy |
| 56947 | MFF | LZE4T | Human | Esophagus | ESCC | 3.37e-17 | 7.96e-01 | 0.0811 |
| 56947 | MFF | LZE5T | Human | Esophagus | ESCC | 2.87e-05 | 2.05e-01 | 0.0514 |
| 56947 | MFF | LZE7T | Human | Esophagus | ESCC | 2.19e-02 | 5.50e-01 | 0.0667 |
| 56947 | MFF | LZE8T | Human | Esophagus | ESCC | 7.11e-10 | 5.43e-01 | 0.067 |
| 56947 | MFF | LZE20T | Human | Esophagus | ESCC | 3.20e-06 | 1.95e-01 | 0.0662 |
| 56947 | MFF | LZE22D1 | Human | Esophagus | HGIN | 2.18e-06 | 1.97e-01 | 0.0595 |
| 56947 | MFF | LZE24T | Human | Esophagus | ESCC | 4.13e-30 | 1.20e+00 | 0.0596 |
| 56947 | MFF | LZE6T | Human | Esophagus | ESCC | 5.47e-15 | 1.16e+00 | 0.0845 |
| 56947 | MFF | P1T-E | Human | Esophagus | ESCC | 1.08e-15 | 7.83e-01 | 0.0875 |
| 56947 | MFF | P2T-E | Human | Esophagus | ESCC | 1.92e-39 | 8.13e-01 | 0.1177 |
| 56947 | MFF | P4T-E | Human | Esophagus | ESCC | 1.10e-25 | 7.02e-01 | 0.1323 |
| 56947 | MFF | P5T-E | Human | Esophagus | ESCC | 3.07e-28 | 5.69e-01 | 0.1327 |
| 56947 | MFF | P8T-E | Human | Esophagus | ESCC | 5.85e-35 | 5.75e-01 | 0.0889 |
| 56947 | MFF | P9T-E | Human | Esophagus | ESCC | 2.14e-26 | 8.37e-01 | 0.1131 |
| 56947 | MFF | P10T-E | Human | Esophagus | ESCC | 2.68e-54 | 8.71e-01 | 0.116 |
| 56947 | MFF | P11T-E | Human | Esophagus | ESCC | 5.77e-18 | 1.10e+00 | 0.1426 |
| 56947 | MFF | P12T-E | Human | Esophagus | ESCC | 1.52e-28 | 5.85e-01 | 0.1122 |
| 56947 | MFF | P15T-E | Human | Esophagus | ESCC | 4.38e-44 | 1.13e+00 | 0.1149 |
| 56947 | MFF | P16T-E | Human | Esophagus | ESCC | 5.80e-44 | 8.03e-01 | 0.1153 |
| 56947 | MFF | P17T-E | Human | Esophagus | ESCC | 4.87e-11 | 6.64e-01 | 0.1278 |
| Page: 1 2 3 4 5 6 7 |
| Tissue | Expression Dynamics | Abbreviation |
| Esophagus | 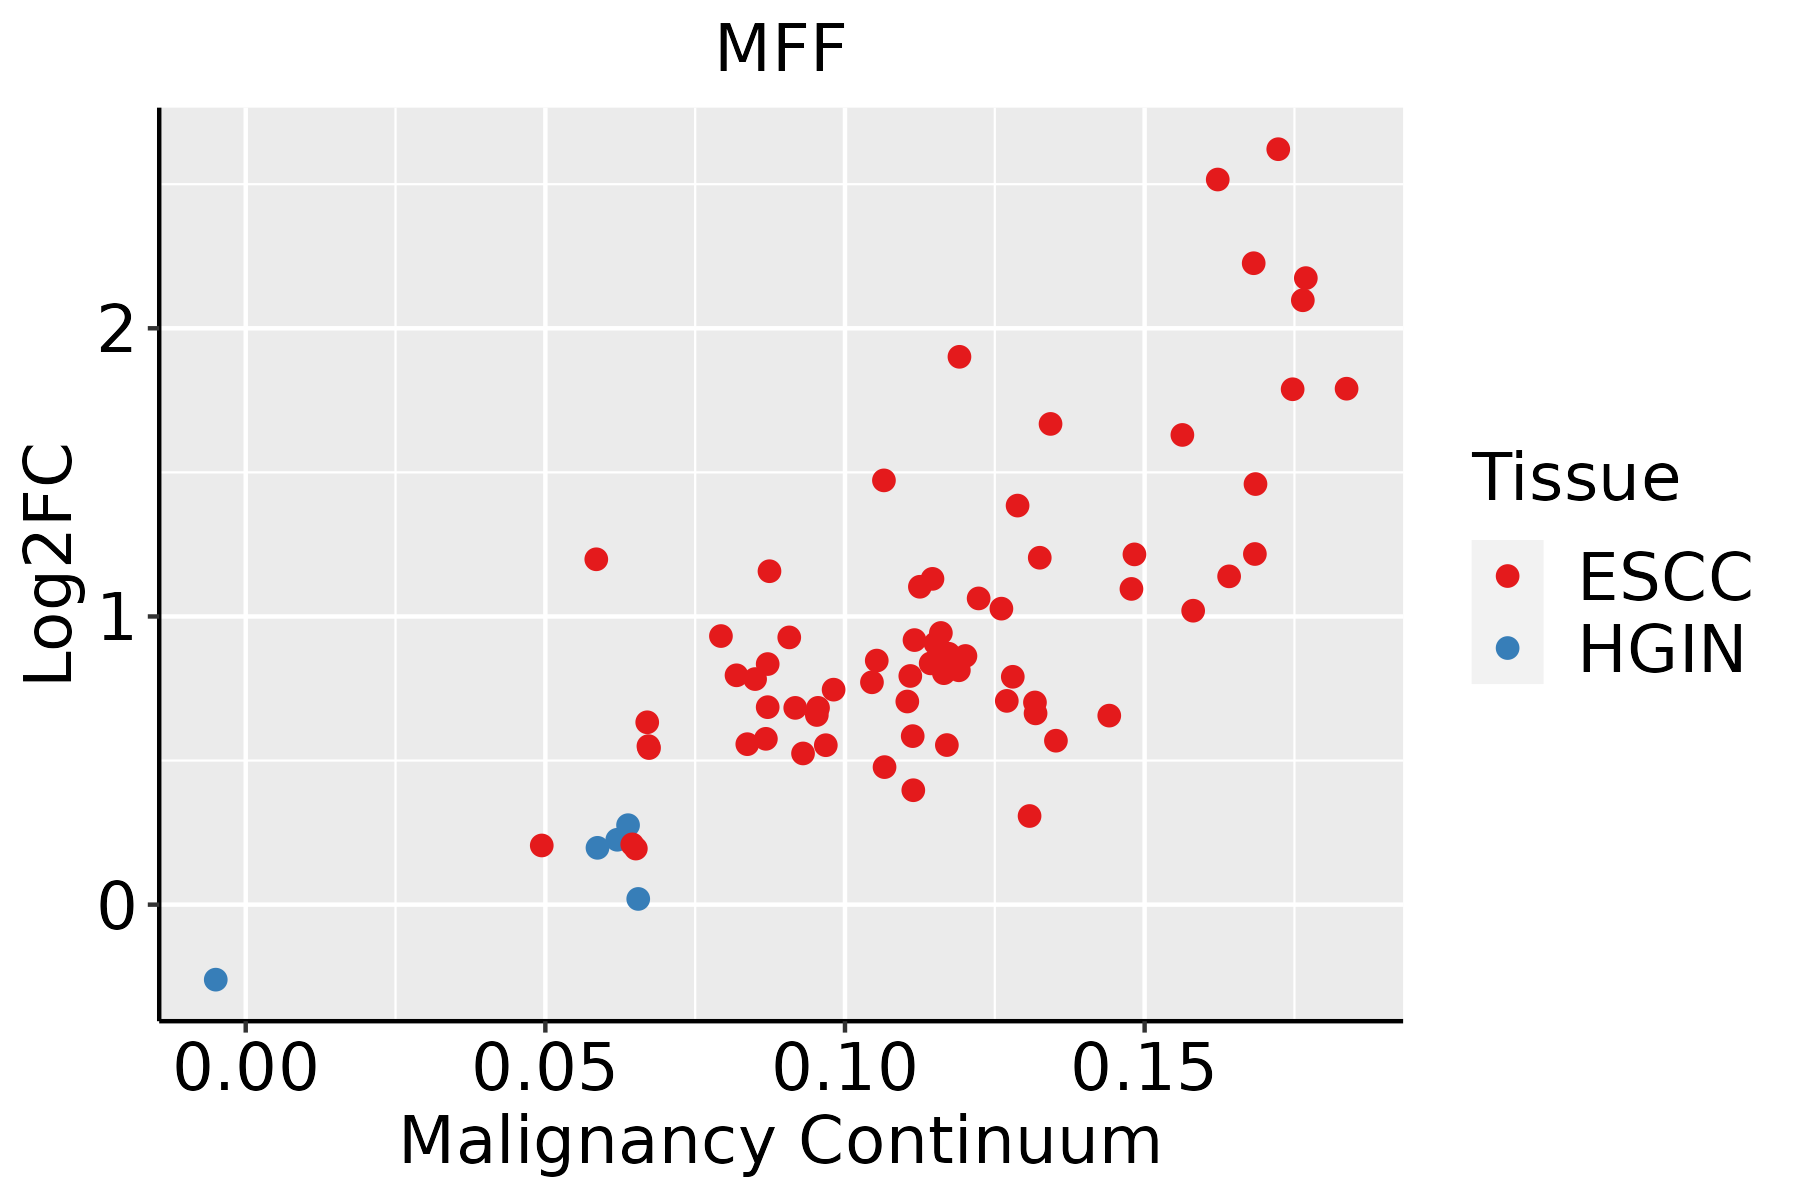 | ESCC: Esophageal squamous cell carcinoma |
| HGIN: High-grade intraepithelial neoplasias | ||
| LGIN: Low-grade intraepithelial neoplasias | ||
| Liver |  | HCC: Hepatocellular carcinoma |
| NAFLD: Non-alcoholic fatty liver disease | ||
| Oral Cavity |  | EOLP: Erosive Oral lichen planus |
| LP: leukoplakia | ||
| NEOLP: Non-erosive oral lichen planus | ||
| OSCC: Oral squamous cell carcinoma | ||
| Skin | 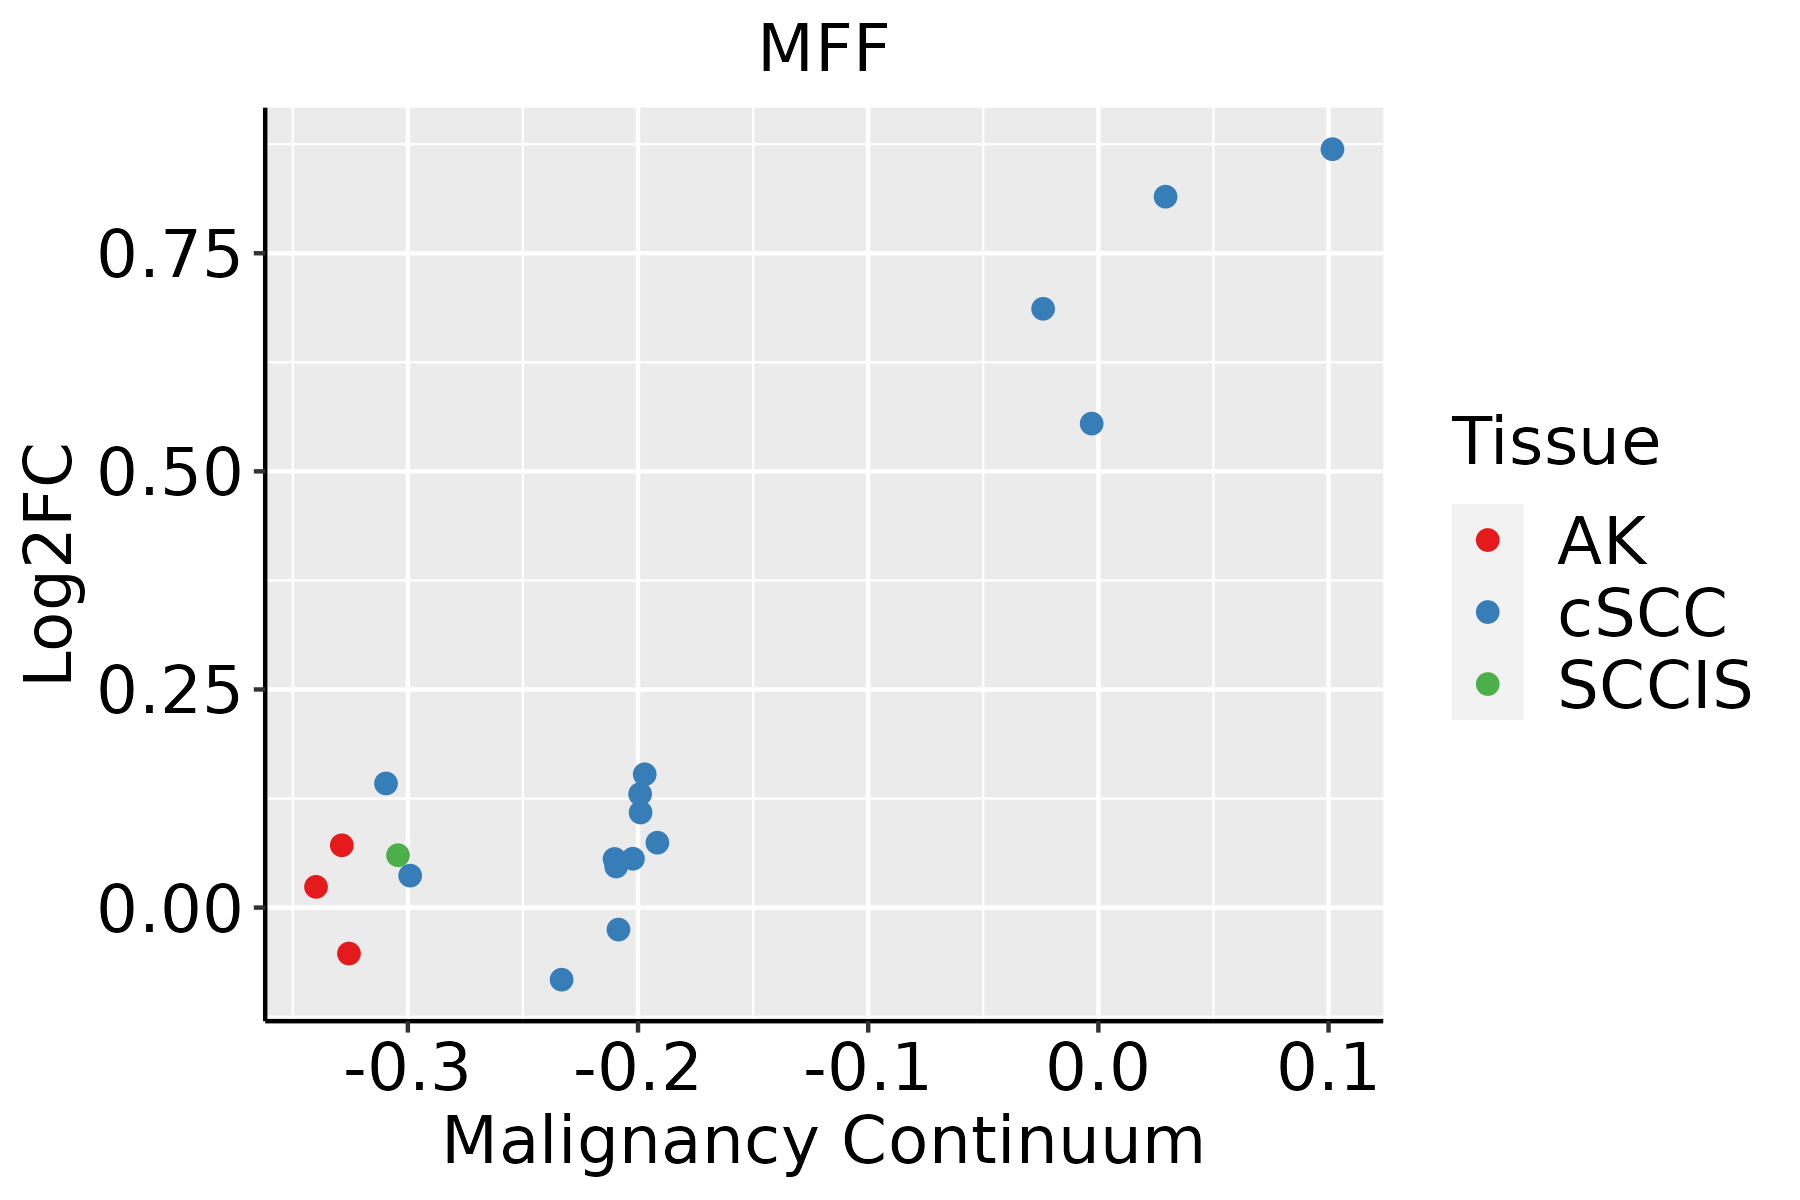 | AK: Actinic keratosis |
| cSCC: Cutaneous squamous cell carcinoma | ||
| SCCIS:squamous cell carcinoma in situ | ||
| Thyroid | 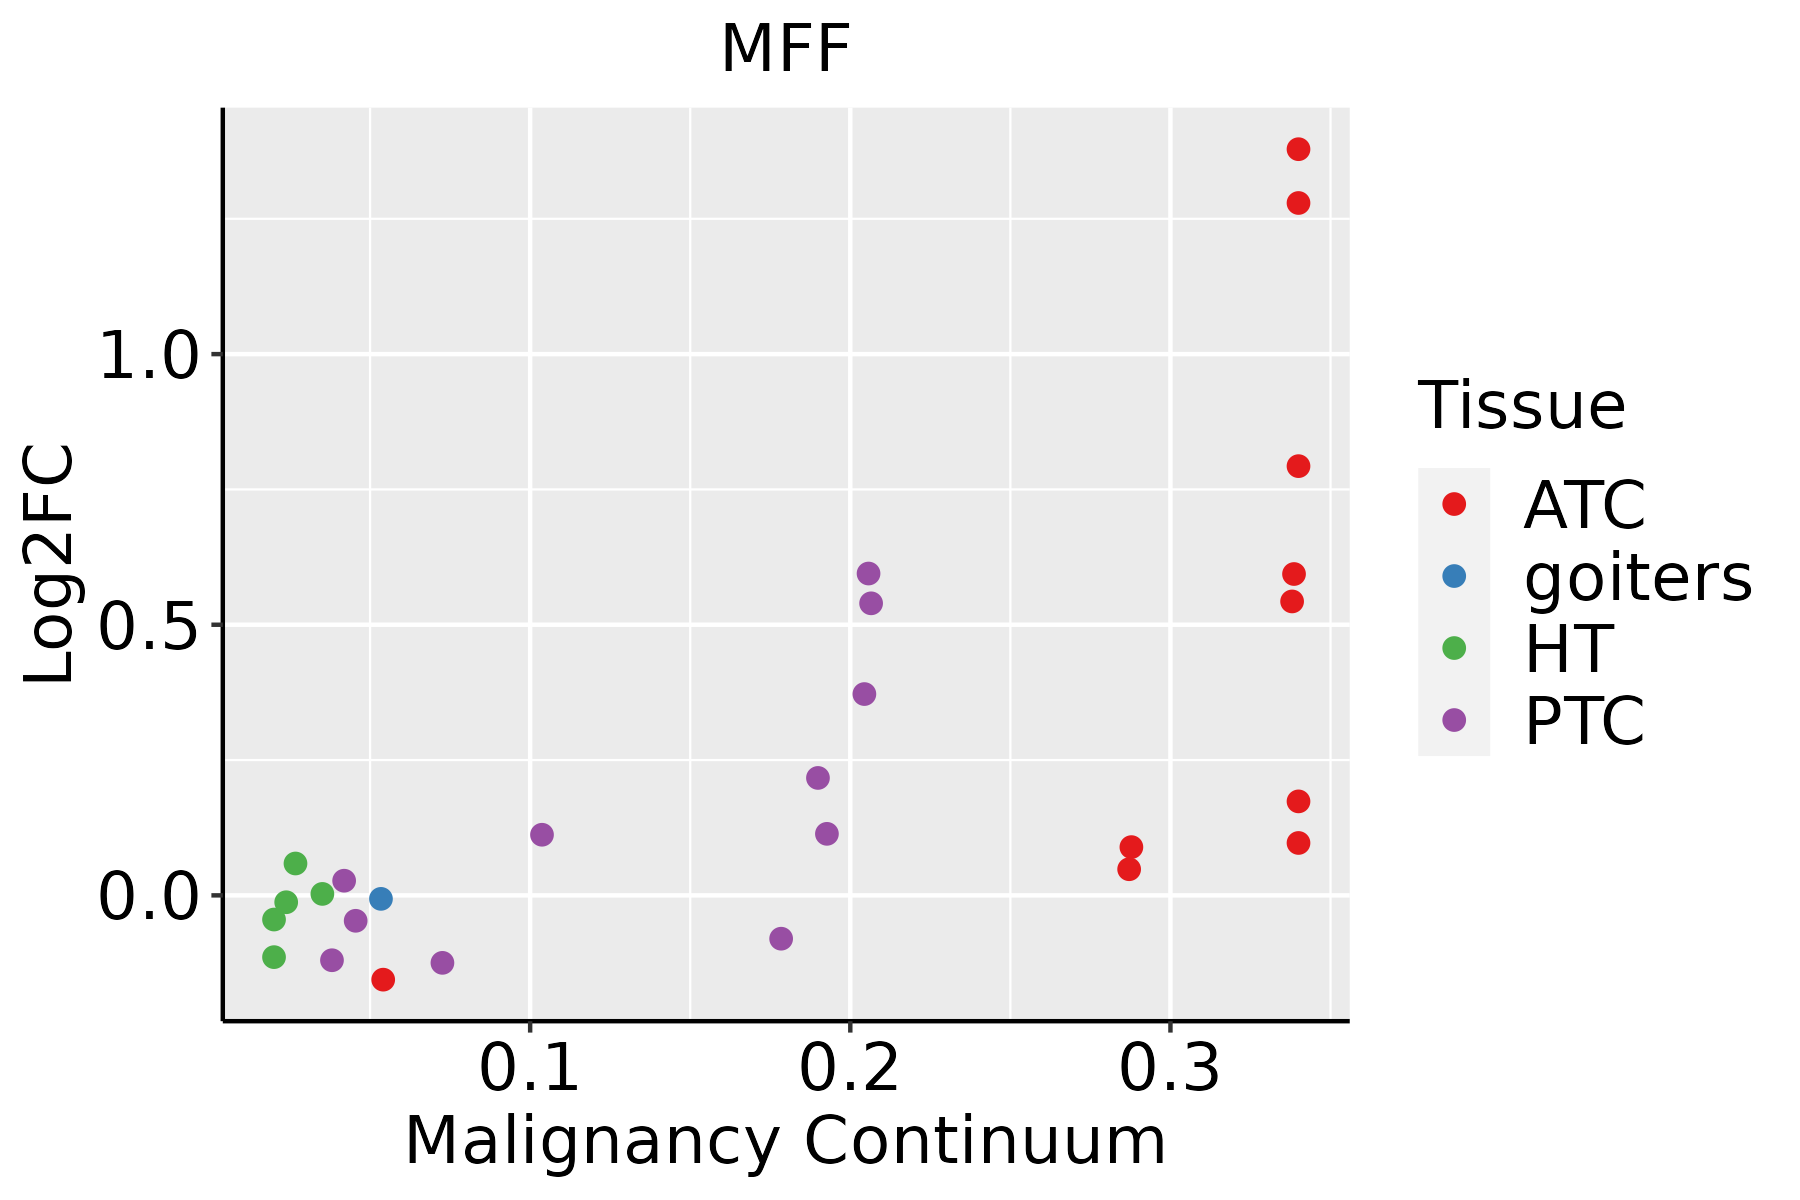 | ATC: Anaplastic thyroid cancer |
| HT: Hashimoto's thyroiditis | ||
| PTC: Papillary thyroid cancer |
| ∗log2FC in expression of this searched gene in stem-like cells from each diseased tissue sample relative to stem-like cells in normal samples in each tissue plotted against the malignancy continuum. Samples are colored based on if they are from different disease stage. |
Top |
Malignant transformation related pathway analysis |
| Find out the enriched GO biological processes and KEGG pathways involved in transition from healthy to precancer to cancer |
| Tissue | Disease Stage | Enriched GO biological Processes |
| Colorectum | AD |  |
| Colorectum | SER |  |
| Colorectum | MSS |  |
| Colorectum | MSI-H |  |
| Colorectum | FAP |  |
| ∗Top 15 enriched GO BP terms are showed in the bar plot of each disease state in each tissue. Each row represents a significant GO biological process which is colored according to the -log10(p.adjust). |
| Page: 1 2 3 4 5 6 7 8 9 |
| GO ID | Tissue | Disease Stage | Description | Gene Ratio | Bg Ratio | pvalue | p.adjust | Count |
| GO:000660512 | Liver | HCC | protein targeting | 219/7958 | 314/18723 | 7.74e-23 | 1.49e-20 | 219 |
| GO:003238621 | Liver | HCC | regulation of intracellular transport | 231/7958 | 337/18723 | 1.99e-22 | 3.40e-20 | 231 |
| GO:000683912 | Liver | HCC | mitochondrial transport | 184/7958 | 254/18723 | 2.30e-22 | 3.83e-20 | 184 |
| GO:003315721 | Liver | HCC | regulation of intracellular protein transport | 165/7958 | 229/18723 | 8.37e-20 | 1.15e-17 | 165 |
| GO:003238821 | Liver | HCC | positive regulation of intracellular transport | 148/7958 | 202/18723 | 5.15e-19 | 6.66e-17 | 148 |
| GO:007265512 | Liver | HCC | establishment of protein localization to mitochondrion | 98/7958 | 120/18723 | 1.18e-18 | 1.46e-16 | 98 |
| GO:007058512 | Liver | HCC | protein localization to mitochondrion | 101/7958 | 125/18723 | 1.53e-18 | 1.86e-16 | 101 |
| GO:009031621 | Liver | HCC | positive regulation of intracellular protein transport | 121/7958 | 160/18723 | 1.27e-17 | 1.39e-15 | 121 |
| GO:190495122 | Liver | HCC | positive regulation of establishment of protein localization | 207/7958 | 319/18723 | 3.95e-16 | 3.29e-14 | 207 |
| GO:000662612 | Liver | HCC | protein targeting to mitochondrion | 82/7958 | 100/18723 | 4.93e-16 | 4.05e-14 | 82 |
| GO:005122222 | Liver | HCC | positive regulation of protein transport | 194/7958 | 303/18723 | 2.41e-14 | 1.56e-12 | 194 |
| GO:009015012 | Liver | HCC | establishment of protein localization to membrane | 168/7958 | 260/18723 | 4.07e-13 | 2.13e-11 | 168 |
| GO:190547511 | Liver | HCC | regulation of protein localization to membrane | 113/7958 | 175/18723 | 2.90e-09 | 7.78e-08 | 113 |
| GO:001082112 | Liver | HCC | regulation of mitochondrion organization | 96/7958 | 144/18723 | 3.82e-09 | 1.02e-07 | 96 |
| GO:190353311 | Liver | HCC | regulation of protein targeting | 60/7958 | 81/18723 | 7.70e-09 | 1.94e-07 | 60 |
| GO:000863712 | Liver | HCC | apoptotic mitochondrial changes | 70/7958 | 107/18723 | 1.39e-06 | 2.01e-05 | 70 |
| GO:190547711 | Liver | HCC | positive regulation of protein localization to membrane | 68/7958 | 106/18723 | 5.50e-06 | 6.82e-05 | 68 |
| GO:0048285 | Liver | HCC | organelle fission | 254/7958 | 488/18723 | 1.07e-05 | 1.23e-04 | 254 |
| GO:004828411 | Liver | HCC | organelle fusion | 84/7958 | 141/18723 | 3.13e-05 | 3.20e-04 | 84 |
| GO:001082211 | Liver | HCC | positive regulation of mitochondrion organization | 48/7958 | 74/18723 | 8.50e-05 | 7.46e-04 | 48 |
| Page: 1 2 3 4 5 6 7 8 9 10 11 12 13 |
| Pathway ID | Tissue | Disease Stage | Description | Gene Ratio | Bg Ratio | pvalue | p.adjust | qvalue | Count |
| Page: 1 |
Top |
Cell-cell communication analysis |
| Identification of potential cell-cell interactions between two cell types and their ligand-receptor pairs for different disease states |
| Ligand | Receptor | LRpair | Pathway | Tissue | Disease Stage |
| Page: 1 |
Top |
Single-cell gene regulatory network inference analysis |
| Find out the significant the regulons (TFs) and the target genes of each regulon across cell types for different disease states |
| TF | Cell Type | Tissue | Disease Stage | Target Gene | RSS | Regulon Activity |
| ∗The dot plots of a searched regulon are shown for all cell subpopulations in each disease state of each tissue based on the regulon specific score inferred using pySCENIC and by calculating the average expression. |
| Page: 1 |
Top |
Somatic mutation of malignant transformation related genes |
| Annotation of somatic variants for genes involved in malignant transformation |
| Hugo Symbol | Variant Class | Variant Classification | dbSNP RS | HGVSc | HGVSp | HGVSp Short | SWISSPROT | BIOTYPE | SIFT | PolyPhen | Tumor Sample Barcode | Tissue | Histology | Sex | Age | Stage | Therapy Types | Drugs | Outcome |
| MFF | SNV | Missense_Mutation | c.646N>A | p.Glu216Lys | p.E216K | Q9GZY8 | protein_coding | deleterious(0.01) | possibly_damaging(0.9) | TCGA-A2-A0YK-01 | Breast | breast invasive carcinoma | Female | <65 | I/II | Chemotherapy | cytoxan | SD | |
| MFF | SNV | Missense_Mutation | c.803N>G | p.Asp268Gly | p.D268G | Q9GZY8 | protein_coding | deleterious(0) | possibly_damaging(0.809) | TCGA-AR-A251-01 | Breast | breast invasive carcinoma | Female | <65 | III/IV | Chemotherapy | doxorubicin | SD | |
| MFF | SNV | Missense_Mutation | c.23A>T | p.Asp8Val | p.D8V | Q9GZY8 | protein_coding | deleterious_low_confidence(0.03) | benign(0.151) | TCGA-C8-A12O-01 | Breast | breast invasive carcinoma | Female | <65 | I/II | Unknown | Unknown | SD | |
| MFF | insertion | Nonsense_Mutation | novel | c.424_425insCCACTACGCCCGGCTAATTTTTTTGT | p.Glu142AlafsTer6 | p.E142Afs*6 | Q9GZY8 | protein_coding | TCGA-A2-A0EM-01 | Breast | breast invasive carcinoma | Female | >=65 | I/II | Hormone Therapy | tamoxiphen | SD | ||
| MFF | SNV | Missense_Mutation | novel | c.1022G>C | p.Arg341Pro | p.R341P | Q9GZY8 | protein_coding | deleterious(0) | probably_damaging(0.989) | TCGA-C5-A1MN-01 | Cervix | cervical & endocervical cancer | Female | <65 | III/IV | Chemotherapy | cisplatin | SD |
| MFF | deletion | Frame_Shift_Del | novel | c.542_543delCA | p.Pro181GlnfsTer3 | p.P181Qfs*3 | Q9GZY8 | protein_coding | TCGA-DS-A1OB-01 | Cervix | cervical & endocervical cancer | Female | <65 | I/II | Chemotherapy | carboplatin | PD | ||
| MFF | SNV | Missense_Mutation | rs201498602 | c.484N>T | p.Arg162Cys | p.R162C | Q9GZY8 | protein_coding | tolerated(0.06) | probably_damaging(0.998) | TCGA-AA-A010-01 | Colorectum | colon adenocarcinoma | Female | <65 | I/II | Chemotherapy | folinic | CR |
| MFF | SNV | Missense_Mutation | c.748N>T | p.Arg250Cys | p.R250C | Q9GZY8 | protein_coding | deleterious(0.03) | probably_damaging(0.959) | TCGA-AA-A010-01 | Colorectum | colon adenocarcinoma | Female | <65 | I/II | Chemotherapy | folinic | CR | |
| MFF | SNV | Missense_Mutation | c.877G>A | p.Ala293Thr | p.A293T | Q9GZY8 | protein_coding | deleterious(0) | probably_damaging(0.998) | TCGA-AD-6964-01 | Colorectum | colon adenocarcinoma | Male | <65 | III/IV | Chemotherapy | folfox | PD | |
| MFF | SNV | Missense_Mutation | novel | c.968N>G | p.Val323Gly | p.V323G | Q9GZY8 | protein_coding | deleterious(0) | possibly_damaging(0.616) | TCGA-CA-6717-01 | Colorectum | colon adenocarcinoma | Male | <65 | I/II | Chemotherapy | oxaliplatin | CR |
| Page: 1 2 3 4 5 |
Top |
Related drugs of malignant transformation related genes |
| Identification of chemicals and drugs interact with genes involved in malignant transfromation |
| (DGIdb 4.0) |
| Entrez ID | Symbol | Category | Interaction Types | Drug Claim Name | Drug Name | PMIDs |
| Page: 1 |

Copyright 2023-Present -The University of Texas Health Science Center at Houston |