
|
|||||
|
 | |
| |
| |
| |
| |
| |
|
Gene: METTL14 |
Gene summary for METTL14 |
| Gene information | Species | Human | Gene symbol | METTL14 | Gene ID | 57721 |
| Gene name | methyltransferase 14, N6-adenosine-methyltransferase subunit | |
| Gene Alias | hMETTL14 | |
| Cytomap | 4q26 | |
| Gene Type | protein-coding | GO ID | GO:0000003 | UniProtAcc | Q9HCE5 |
Top |
Malignant transformation analysis |
| Identification of the aberrant gene expression in precancerous and cancerous lesions by comparing the gene expression of stem-like cells in diseased tissues with normal stem cells |
| Entrez ID | Symbol | Replicates | Species | Organ | Tissue | Adj P-value | Log2FC | Malignancy |
| 57721 | METTL14 | LZE4T | Human | Esophagus | ESCC | 1.02e-07 | 1.40e-01 | 0.0811 |
| 57721 | METTL14 | LZE7T | Human | Esophagus | ESCC | 3.85e-07 | 2.21e-01 | 0.0667 |
| 57721 | METTL14 | LZE8T | Human | Esophagus | ESCC | 1.53e-02 | 1.04e-01 | 0.067 |
| 57721 | METTL14 | LZE20T | Human | Esophagus | ESCC | 9.00e-04 | 6.80e-02 | 0.0662 |
| 57721 | METTL14 | LZE24T | Human | Esophagus | ESCC | 5.03e-05 | 1.15e-01 | 0.0596 |
| 57721 | METTL14 | LZE21T | Human | Esophagus | ESCC | 4.27e-06 | 3.24e-01 | 0.0655 |
| 57721 | METTL14 | P2T-E | Human | Esophagus | ESCC | 4.72e-27 | 4.06e-01 | 0.1177 |
| 57721 | METTL14 | P4T-E | Human | Esophagus | ESCC | 1.83e-16 | 2.95e-01 | 0.1323 |
| 57721 | METTL14 | P5T-E | Human | Esophagus | ESCC | 3.29e-04 | 8.04e-02 | 0.1327 |
| 57721 | METTL14 | P8T-E | Human | Esophagus | ESCC | 7.98e-08 | 1.57e-01 | 0.0889 |
| 57721 | METTL14 | P9T-E | Human | Esophagus | ESCC | 3.21e-04 | 1.13e-01 | 0.1131 |
| 57721 | METTL14 | P10T-E | Human | Esophagus | ESCC | 1.21e-13 | 1.86e-01 | 0.116 |
| 57721 | METTL14 | P11T-E | Human | Esophagus | ESCC | 7.00e-13 | 3.26e-01 | 0.1426 |
| 57721 | METTL14 | P12T-E | Human | Esophagus | ESCC | 7.39e-21 | 3.70e-01 | 0.1122 |
| 57721 | METTL14 | P15T-E | Human | Esophagus | ESCC | 4.56e-16 | 2.73e-01 | 0.1149 |
| 57721 | METTL14 | P16T-E | Human | Esophagus | ESCC | 9.23e-16 | 3.06e-01 | 0.1153 |
| 57721 | METTL14 | P17T-E | Human | Esophagus | ESCC | 3.05e-03 | 1.60e-01 | 0.1278 |
| 57721 | METTL14 | P19T-E | Human | Esophagus | ESCC | 6.59e-06 | 3.13e-01 | 0.1662 |
| 57721 | METTL14 | P20T-E | Human | Esophagus | ESCC | 1.02e-03 | 1.40e-01 | 0.1124 |
| 57721 | METTL14 | P21T-E | Human | Esophagus | ESCC | 1.73e-10 | 1.56e-01 | 0.1617 |
| Page: 1 2 3 4 |
| Tissue | Expression Dynamics | Abbreviation |
| Esophagus | 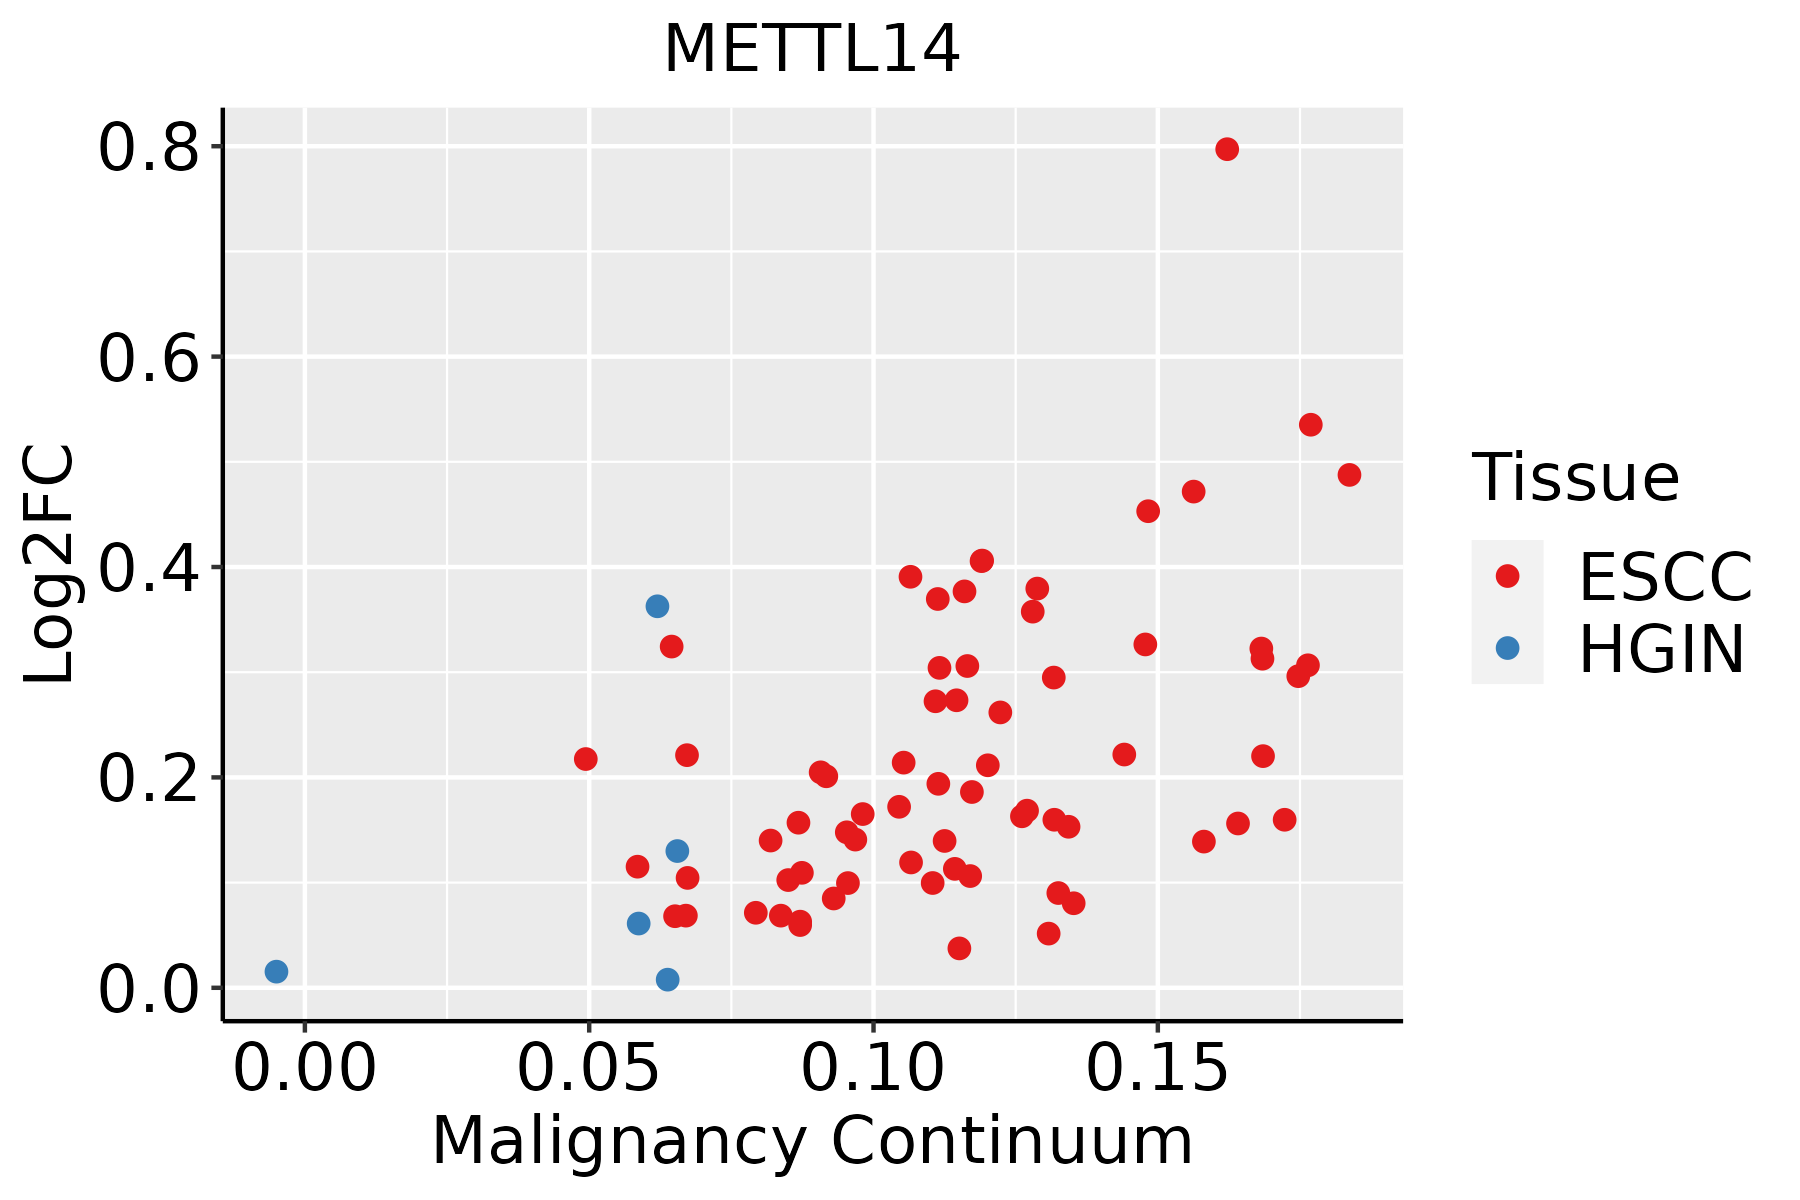 | ESCC: Esophageal squamous cell carcinoma |
| HGIN: High-grade intraepithelial neoplasias | ||
| LGIN: Low-grade intraepithelial neoplasias | ||
| Thyroid |  | ATC: Anaplastic thyroid cancer |
| HT: Hashimoto's thyroiditis | ||
| PTC: Papillary thyroid cancer |
| ∗log2FC in expression of this searched gene in stem-like cells from each diseased tissue sample relative to stem-like cells in normal samples in each tissue plotted against the malignancy continuum. Samples are colored based on if they are from different disease stage. |
Top |
Malignant transformation related pathway analysis |
| Find out the enriched GO biological processes and KEGG pathways involved in transition from healthy to precancer to cancer |
| Tissue | Disease Stage | Enriched GO biological Processes |
| Colorectum | AD |  |
| Colorectum | SER |  |
| Colorectum | MSS |  |
| Colorectum | MSI-H |  |
| Colorectum | FAP |  |
| ∗Top 15 enriched GO BP terms are showed in the bar plot of each disease state in each tissue. Each row represents a significant GO biological process which is colored according to the -log10(p.adjust). |
| Page: 1 2 3 4 5 6 7 8 9 |
| GO ID | Tissue | Disease Stage | Description | Gene Ratio | Bg Ratio | pvalue | p.adjust | Count |
| GO:004427025 | Thyroid | ATC | cellular nitrogen compound catabolic process | 229/6293 | 451/18723 | 2.25e-14 | 1.27e-12 | 229 |
| GO:000641735 | Thyroid | ATC | regulation of translation | 236/6293 | 468/18723 | 2.39e-14 | 1.34e-12 | 236 |
| GO:001943924 | Thyroid | ATC | aromatic compound catabolic process | 232/6293 | 467/18723 | 3.05e-13 | 1.44e-11 | 232 |
| GO:004572733 | Thyroid | ATC | positive regulation of translation | 85/6293 | 136/18723 | 4.71e-12 | 1.84e-10 | 85 |
| GO:003425034 | Thyroid | ATC | positive regulation of cellular amide metabolic process | 97/6293 | 162/18723 | 5.97e-12 | 2.30e-10 | 97 |
| GO:190136124 | Thyroid | ATC | organic cyclic compound catabolic process | 238/6293 | 495/18723 | 1.12e-11 | 4.12e-10 | 238 |
| GO:190331324 | Thyroid | ATC | positive regulation of mRNA metabolic process | 75/6293 | 118/18723 | 2.57e-11 | 8.84e-10 | 75 |
| GO:004348725 | Thyroid | ATC | regulation of RNA stability | 97/6293 | 170/18723 | 2.68e-10 | 7.70e-09 | 97 |
| GO:006101325 | Thyroid | ATC | regulation of mRNA catabolic process | 95/6293 | 166/18723 | 3.27e-10 | 9.16e-09 | 95 |
| GO:004348826 | Thyroid | ATC | regulation of mRNA stability | 90/6293 | 158/18723 | 1.31e-09 | 3.30e-08 | 90 |
| GO:0061157110 | Thyroid | ATC | mRNA destabilization | 52/6293 | 84/18723 | 1.01e-07 | 1.70e-06 | 52 |
| GO:0061014110 | Thyroid | ATC | positive regulation of mRNA catabolic process | 53/6293 | 87/18723 | 1.63e-07 | 2.61e-06 | 53 |
| GO:0050779110 | Thyroid | ATC | RNA destabilization | 53/6293 | 88/18723 | 2.75e-07 | 4.20e-06 | 53 |
| GO:009872722 | Thyroid | ATC | maintenance of cell number | 70/6293 | 134/18723 | 6.45e-06 | 6.69e-05 | 70 |
| GO:001982722 | Thyroid | ATC | stem cell population maintenance | 67/6293 | 131/18723 | 2.48e-05 | 2.16e-04 | 67 |
| GO:003090015 | Thyroid | ATC | forebrain development | 164/6293 | 379/18723 | 4.85e-05 | 3.87e-04 | 164 |
| GO:003424923 | Thyroid | ATC | negative regulation of cellular amide metabolic process | 121/6293 | 273/18723 | 1.36e-04 | 9.57e-04 | 121 |
| GO:001714823 | Thyroid | ATC | negative regulation of translation | 107/6293 | 245/18723 | 6.17e-04 | 3.51e-03 | 107 |
| GO:004206323 | Thyroid | ATC | gliogenesis | 127/6293 | 301/18723 | 1.07e-03 | 5.66e-03 | 127 |
| GO:004341412 | Thyroid | ATC | macromolecule methylation | 131/6293 | 316/18723 | 2.01e-03 | 9.60e-03 | 131 |
| Page: 1 2 3 4 5 6 |
| Pathway ID | Tissue | Disease Stage | Description | Gene Ratio | Bg Ratio | pvalue | p.adjust | qvalue | Count |
| Page: 1 |
Top |
Cell-cell communication analysis |
| Identification of potential cell-cell interactions between two cell types and their ligand-receptor pairs for different disease states |
| Ligand | Receptor | LRpair | Pathway | Tissue | Disease Stage |
| Page: 1 |
Top |
Single-cell gene regulatory network inference analysis |
| Find out the significant the regulons (TFs) and the target genes of each regulon across cell types for different disease states |
| TF | Cell Type | Tissue | Disease Stage | Target Gene | RSS | Regulon Activity |
| METTL14 | CILIA | Lung | Healthy | ERBB3,PDGFC,GINM1, etc. | 1.75e-02 |  |
| METTL14 | INFIB | Prostate | ADJ | TSLP,GPR124,TFF3, etc. | 1.88e-01 |  |
| METTL14 | MYOFIB | Prostate | Healthy | TSLP,GPR124,TFF3, etc. | 2.42e-02 |  |
| METTL14 | FIB | Prostate | Healthy | TSLP,GPR124,TFF3, etc. | 1.91e-02 | |
| METTL14 | INFIB | Prostate | Tumor | TSLP,GPR124,TFF3, etc. | 7.88e-02 |  |
| ∗The dot plots of a searched regulon are shown for all cell subpopulations in each disease state of each tissue based on the regulon specific score inferred using pySCENIC and by calculating the average expression. |
| Page: 1 |
Top |
Somatic mutation of malignant transformation related genes |
| Annotation of somatic variants for genes involved in malignant transformation |
| Hugo Symbol | Variant Class | Variant Classification | dbSNP RS | HGVSc | HGVSp | HGVSp Short | SWISSPROT | BIOTYPE | SIFT | PolyPhen | Tumor Sample Barcode | Tissue | Histology | Sex | Age | Stage | Therapy Types | Drugs | Outcome |
| METTL14 | SNV | Missense_Mutation | c.586N>A | p.Glu196Lys | p.E196K | Q9HCE5 | protein_coding | tolerated(0.14) | probably_damaging(0.966) | TCGA-AC-A23H-01 | Breast | breast invasive carcinoma | Female | >=65 | I/II | Unknown | Unknown | PD | |
| METTL14 | insertion | Nonsense_Mutation | novel | c.1365_1366insTGGACCAACGCTTACAAATAGCAACTACAATGCAGAAA | p.Arg456TrpfsTer7 | p.R456Wfs*7 | Q9HCE5 | protein_coding | TCGA-A8-A0A4-01 | Breast | breast invasive carcinoma | Female | >=65 | I/II | Hormone Therapy | tamoxiphen | CR | ||
| METTL14 | insertion | In_Frame_Ins | novel | c.22_23insATATTAACAATAACAAGCACT | p.Ile8delinsAsnIleAsnAsnAsnLysHisPhe | p.I8delinsNINNNKHF | Q9HCE5 | protein_coding | TCGA-B6-A0I5-01 | Breast | breast invasive carcinoma | Female | <65 | I/II | Unknown | Unknown | SD | ||
| METTL14 | deletion | Frame_Shift_Del | novel | c.688delN | p.Phe230LeufsTer46 | p.F230Lfs*46 | Q9HCE5 | protein_coding | TCGA-EW-A2FV-01 | Breast | breast invasive carcinoma | Female | <65 | III/IV | Chemotherapy | docetaxel | SD | ||
| METTL14 | SNV | Missense_Mutation | c.893N>A | p.Arg298His | p.R298H | Q9HCE5 | protein_coding | deleterious(0) | probably_damaging(1) | TCGA-VS-A959-01 | Cervix | cervical & endocervical cancer | Female | >=65 | I/II | Unknown | Unknown | SD | |
| METTL14 | SNV | Missense_Mutation | c.19G>C | p.Glu7Gln | p.E7Q | Q9HCE5 | protein_coding | tolerated_low_confidence(0.22) | probably_damaging(0.932) | TCGA-XS-A8TJ-01 | Cervix | cervical & endocervical cancer | Female | <65 | I/II | Chemotherapy | cisplatin | SD | |
| METTL14 | SNV | Missense_Mutation | c.803N>C | p.Asn268Thr | p.N268T | Q9HCE5 | protein_coding | tolerated(0.16) | possibly_damaging(0.843) | TCGA-A6-6138-01 | Colorectum | colon adenocarcinoma | Male | <65 | I/II | Unknown | Unknown | SD | |
| METTL14 | SNV | Missense_Mutation | novel | c.213N>C | p.Glu71Asp | p.E71D | Q9HCE5 | protein_coding | tolerated_low_confidence(0.34) | benign(0.039) | TCGA-AA-3862-01 | Colorectum | colon adenocarcinoma | Male | >=65 | I/II | Unknown | Unknown | SD |
| METTL14 | SNV | Missense_Mutation | novel | c.1286N>T | p.Arg429Ile | p.R429I | Q9HCE5 | protein_coding | deleterious_low_confidence(0) | probably_damaging(0.962) | TCGA-AA-3984-01 | Colorectum | colon adenocarcinoma | Female | <65 | I/II | Unknown | Unknown | SD |
| METTL14 | SNV | Missense_Mutation | c.10N>A | p.Arg4Ser | p.R4S | Q9HCE5 | protein_coding | tolerated_low_confidence(0.1) | probably_damaging(0.931) | TCGA-AD-6964-01 | Colorectum | colon adenocarcinoma | Male | <65 | III/IV | Chemotherapy | folfox | PD |
| Page: 1 2 3 4 5 |
Top |
Related drugs of malignant transformation related genes |
| Identification of chemicals and drugs interact with genes involved in malignant transfromation |
| (DGIdb 4.0) |
| Entrez ID | Symbol | Category | Interaction Types | Drug Claim Name | Drug Name | PMIDs |
| Page: 1 |

Copyright 2023-Present -The University of Texas Health Science Center at Houston |