| Tissue | Expression Dynamics | Abbreviation |
| Breast | 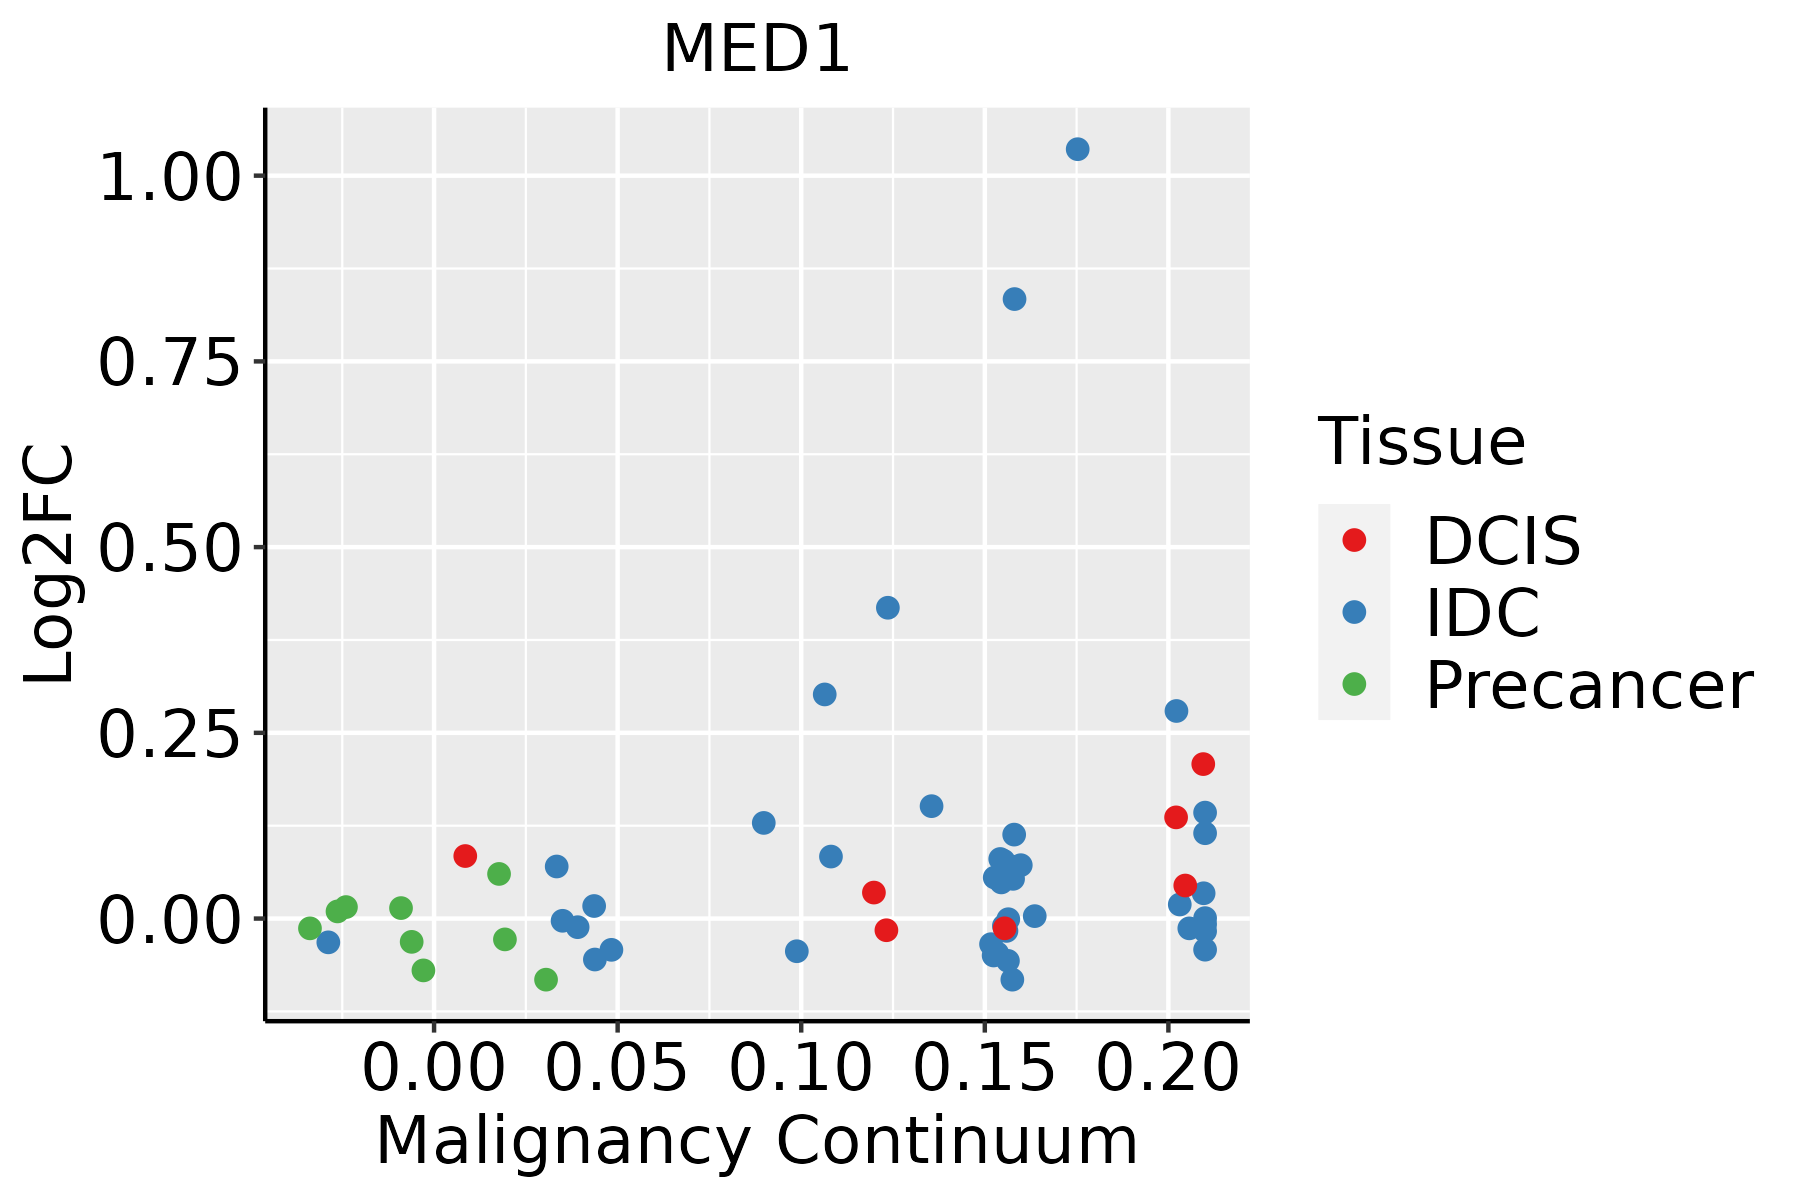 | IDC: Invasive ductal carcinoma |
| DCIS: Ductal carcinoma in situ |
| Precancer(BRCA1-mut): Precancerous lesion from BRCA1 mutation carriers |
| Esophagus | 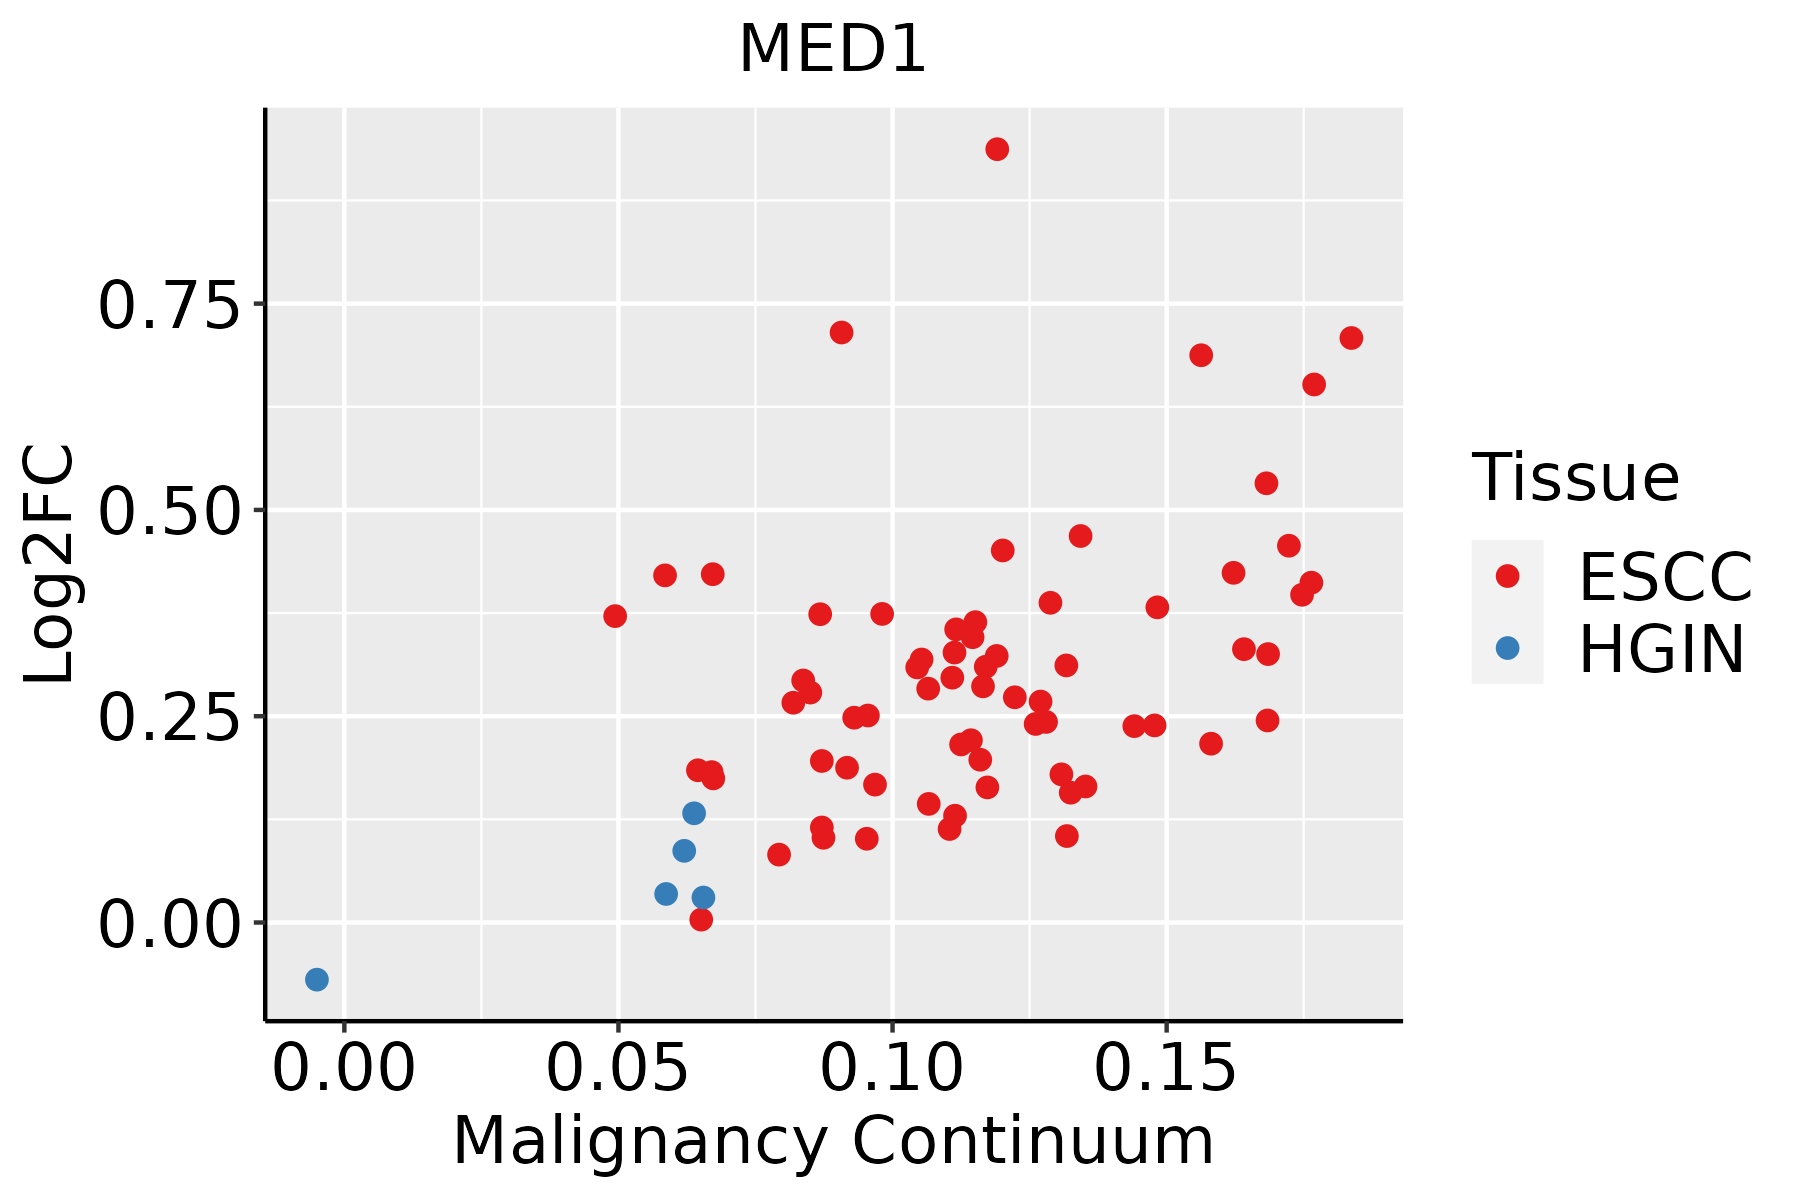 | ESCC: Esophageal squamous cell carcinoma |
| HGIN: High-grade intraepithelial neoplasias |
| LGIN: Low-grade intraepithelial neoplasias |
| Liver |  | HCC: Hepatocellular carcinoma |
| NAFLD: Non-alcoholic fatty liver disease |
| Oral Cavity | 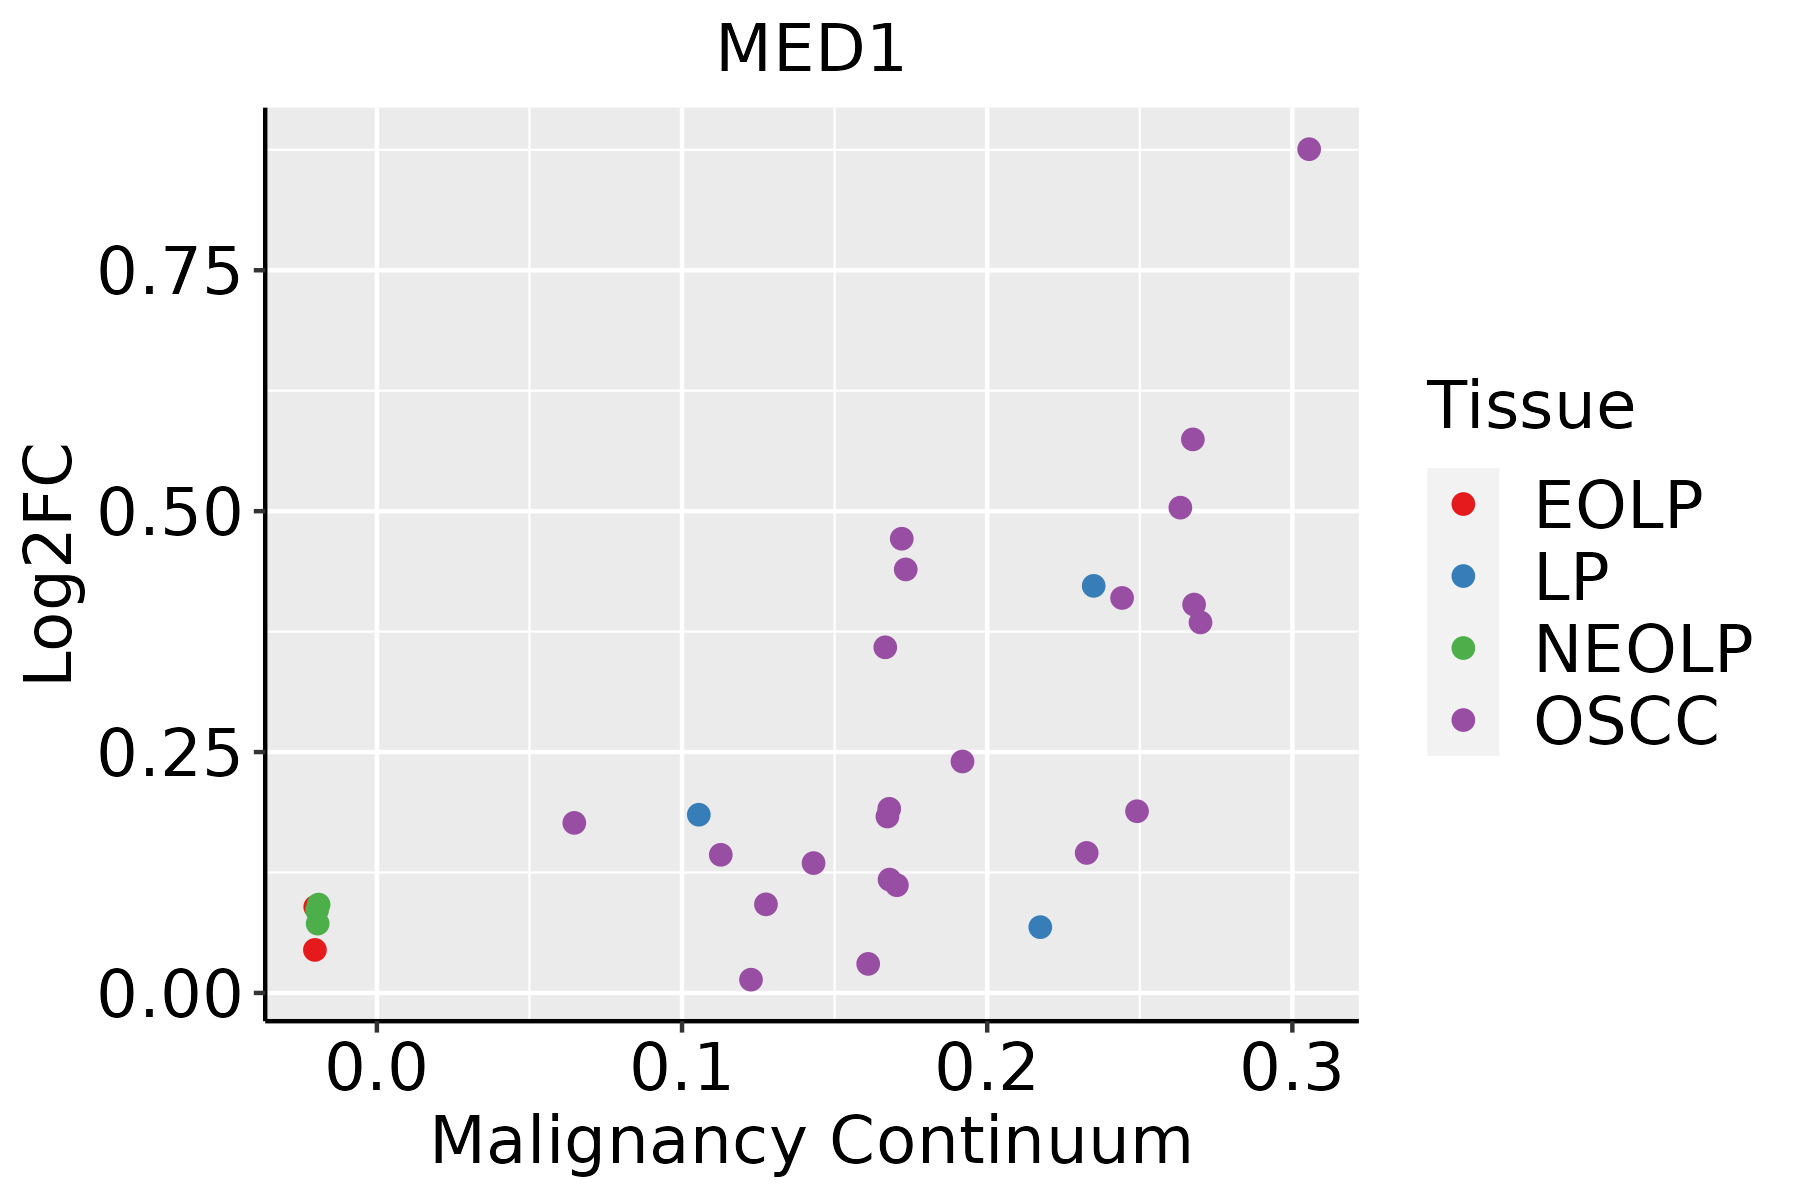 | EOLP: Erosive Oral lichen planus |
| LP: leukoplakia |
| NEOLP: Non-erosive oral lichen planus |
| OSCC: Oral squamous cell carcinoma |
| Prostate | 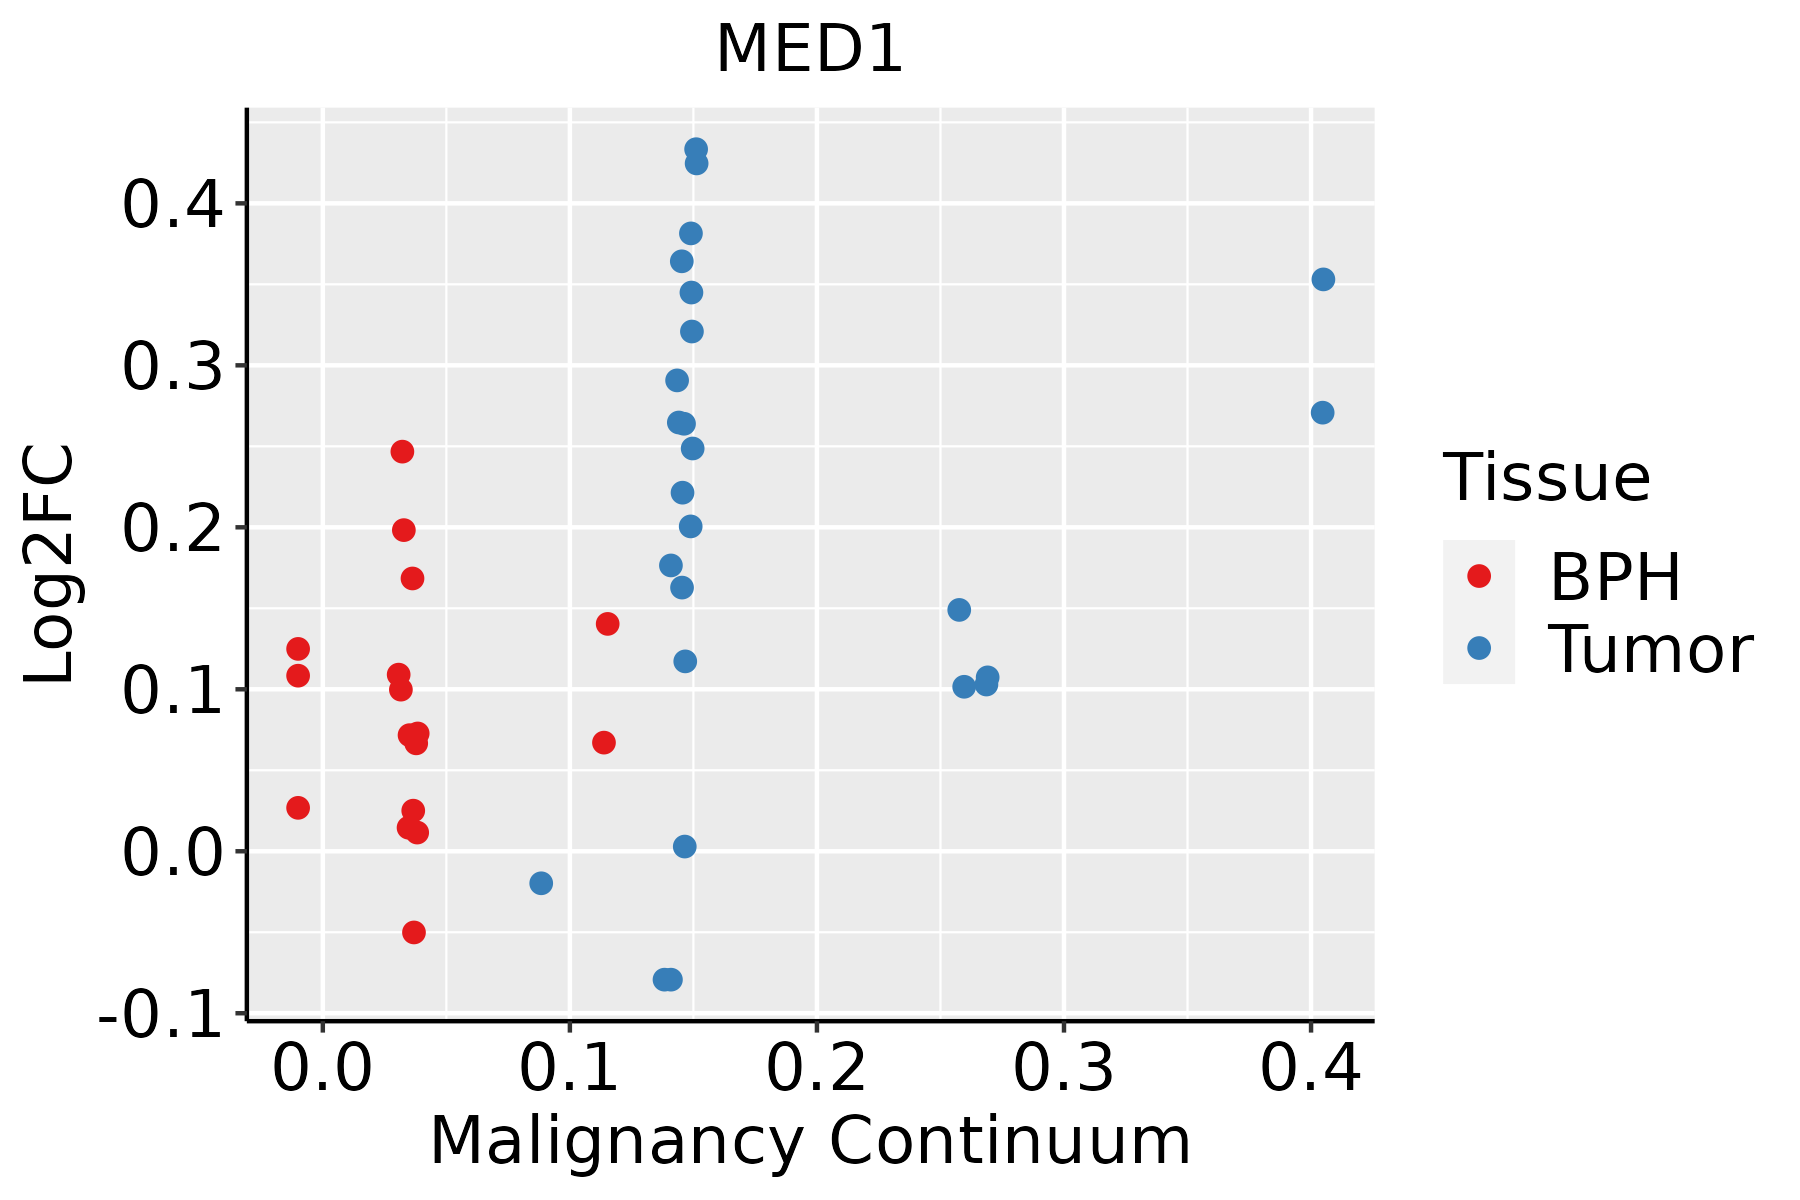 | BPH: Benign Prostatic Hyperplasia |
| GO ID | Tissue | Disease Stage | Description | Gene Ratio | Bg Ratio | pvalue | p.adjust | Count |
| GO:007180612 | Breast | IDC | protein transmembrane transport | 12/1434 | 59/18723 | 1.49e-03 | 1.50e-02 | 12 |
| GO:00066944 | Breast | IDC | steroid biosynthetic process | 25/1434 | 173/18723 | 1.56e-03 | 1.56e-02 | 25 |
| GO:000991312 | Breast | IDC | epidermal cell differentiation | 28/1434 | 202/18723 | 1.62e-03 | 1.60e-02 | 28 |
| GO:00147061 | Breast | IDC | striated muscle tissue development | 46/1434 | 384/18723 | 1.67e-03 | 1.63e-02 | 46 |
| GO:000690014 | Breast | IDC | vesicle budding from membrane | 12/1434 | 61/18723 | 2.01e-03 | 1.90e-02 | 12 |
| GO:00302161 | Breast | IDC | keratinocyte differentiation | 21/1434 | 139/18723 | 2.06e-03 | 1.95e-02 | 21 |
| GO:00343414 | Breast | IDC | response to interferon-gamma | 21/1434 | 141/18723 | 2.46e-03 | 2.22e-02 | 21 |
| GO:0048754 | Breast | IDC | branching morphogenesis of an epithelial tube | 22/1434 | 151/18723 | 2.61e-03 | 2.34e-02 | 22 |
| GO:004544412 | Breast | IDC | fat cell differentiation | 30/1434 | 229/18723 | 2.72e-03 | 2.41e-02 | 30 |
| GO:0045648 | Breast | IDC | positive regulation of erythrocyte differentiation | 8/1434 | 33/18723 | 2.85e-03 | 2.49e-02 | 8 |
| GO:00435883 | Breast | IDC | skin development | 33/1434 | 263/18723 | 3.46e-03 | 2.87e-02 | 33 |
| GO:003166914 | Breast | IDC | cellular response to nutrient levels | 28/1434 | 215/18723 | 4.02e-03 | 3.25e-02 | 28 |
| GO:00611804 | Breast | IDC | mammary gland epithelium development | 12/1434 | 67/18723 | 4.53e-03 | 3.49e-02 | 12 |
| GO:00068906 | Breast | IDC | retrograde vesicle-mediated transport, Golgi to endoplasmic reticulum | 10/1434 | 52/18723 | 5.49e-03 | 4.03e-02 | 10 |
| GO:000170113 | Breast | IDC | in utero embryonic development | 42/1434 | 367/18723 | 5.85e-03 | 4.24e-02 | 42 |
| GO:007169212 | Breast | IDC | protein localization to extracellular region | 42/1434 | 368/18723 | 6.13e-03 | 4.38e-02 | 42 |
| GO:00075172 | Breast | IDC | muscle organ development | 38/1434 | 327/18723 | 6.63e-03 | 4.62e-02 | 38 |
| GO:000930613 | Breast | IDC | protein secretion | 41/1434 | 359/18723 | 6.64e-03 | 4.63e-02 | 41 |
| GO:00016555 | Breast | IDC | urogenital system development | 39/1434 | 338/18723 | 6.75e-03 | 4.68e-02 | 39 |
| GO:003559213 | Breast | IDC | establishment of protein localization to extracellular region | 41/1434 | 360/18723 | 6.96e-03 | 4.81e-02 | 41 |
| Pathway ID | Tissue | Disease Stage | Description | Gene Ratio | Bg Ratio | pvalue | p.adjust | qvalue | Count |
| hsa0491916 | Breast | IDC | Thyroid hormone signaling pathway | 23/867 | 121/8465 | 2.45e-03 | 1.69e-02 | 1.27e-02 | 23 |
| hsa0491917 | Breast | IDC | Thyroid hormone signaling pathway | 23/867 | 121/8465 | 2.45e-03 | 1.69e-02 | 1.27e-02 | 23 |
| hsa0491928 | Esophagus | ESCC | Thyroid hormone signaling pathway | 78/4205 | 121/8465 | 6.79e-04 | 2.23e-03 | 1.14e-03 | 78 |
| hsa015227 | Esophagus | ESCC | Endocrine resistance | 63/4205 | 98/8465 | 2.38e-03 | 6.58e-03 | 3.37e-03 | 63 |
| hsa04919113 | Esophagus | ESCC | Thyroid hormone signaling pathway | 78/4205 | 121/8465 | 6.79e-04 | 2.23e-03 | 1.14e-03 | 78 |
| hsa0152215 | Esophagus | ESCC | Endocrine resistance | 63/4205 | 98/8465 | 2.38e-03 | 6.58e-03 | 3.37e-03 | 63 |
| hsa0491912 | Liver | HCC | Thyroid hormone signaling pathway | 75/4020 | 121/8465 | 8.76e-04 | 3.38e-03 | 1.88e-03 | 75 |
| hsa01522 | Liver | HCC | Endocrine resistance | 58/4020 | 98/8465 | 1.28e-02 | 3.19e-02 | 1.78e-02 | 58 |
| hsa0491913 | Liver | HCC | Thyroid hormone signaling pathway | 75/4020 | 121/8465 | 8.76e-04 | 3.38e-03 | 1.88e-03 | 75 |
| hsa015221 | Liver | HCC | Endocrine resistance | 58/4020 | 98/8465 | 1.28e-02 | 3.19e-02 | 1.78e-02 | 58 |
| hsa015226 | Oral cavity | OSCC | Endocrine resistance | 63/3704 | 98/8465 | 3.09e-05 | 1.31e-04 | 6.67e-05 | 63 |
| hsa0491926 | Oral cavity | OSCC | Thyroid hormone signaling pathway | 73/3704 | 121/8465 | 1.63e-04 | 5.52e-04 | 2.81e-04 | 73 |
| hsa0152214 | Oral cavity | OSCC | Endocrine resistance | 63/3704 | 98/8465 | 3.09e-05 | 1.31e-04 | 6.67e-05 | 63 |
| hsa04919112 | Oral cavity | OSCC | Thyroid hormone signaling pathway | 73/3704 | 121/8465 | 1.63e-04 | 5.52e-04 | 2.81e-04 | 73 |
| hsa0152221 | Prostate | Tumor | Endocrine resistance | 37/1791 | 98/8465 | 1.17e-04 | 7.42e-04 | 4.60e-04 | 37 |
| hsa0491925 | Prostate | Tumor | Thyroid hormone signaling pathway | 40/1791 | 121/8465 | 1.47e-03 | 6.26e-03 | 3.88e-03 | 40 |
| hsa0152231 | Prostate | Tumor | Endocrine resistance | 37/1791 | 98/8465 | 1.17e-04 | 7.42e-04 | 4.60e-04 | 37 |
| hsa0491934 | Prostate | Tumor | Thyroid hormone signaling pathway | 40/1791 | 121/8465 | 1.47e-03 | 6.26e-03 | 3.88e-03 | 40 |
| Hugo Symbol | Variant Class | Variant Classification | dbSNP RS | HGVSc | HGVSp | HGVSp Short | SWISSPROT | BIOTYPE | SIFT | PolyPhen | Tumor Sample Barcode | Tissue | Histology | Sex | Age | Stage | Therapy Types | Drugs | Outcome |
| MED1 | SNV | Missense_Mutation | novel | c.4150N>T | p.Val1384Leu | p.V1384L | Q15648 | protein_coding | deleterious_low_confidence(0.04) | benign(0.01) | TCGA-AC-A3TM-01 | Breast | breast invasive carcinoma | Female | <65 | III/IV | Chemotherapy | cytoxan | CR |
| MED1 | SNV | Missense_Mutation | | c.3950N>A | p.Ser1317Asn | p.S1317N | Q15648 | protein_coding | deleterious_low_confidence(0.03) | benign(0.037) | TCGA-AN-A0FN-01 | Breast | breast invasive carcinoma | Female | <65 | I/II | Unknown | Unknown | SD |
| MED1 | SNV | Missense_Mutation | | c.3527N>T | p.Gly1176Val | p.G1176V | Q15648 | protein_coding | tolerated_low_confidence(0.19) | possibly_damaging(0.609) | TCGA-AO-A0JM-01 | Breast | breast invasive carcinoma | Female | <65 | I/II | Chemotherapy | doxorubicin | SD |
| MED1 | SNV | Missense_Mutation | novel | c.3094N>C | p.Thr1032Pro | p.T1032P | Q15648 | protein_coding | deleterious_low_confidence(0) | probably_damaging(0.996) | TCGA-B6-A1KF-01 | Breast | breast invasive carcinoma | Female | >=65 | I/II | Unknown | Unknown | SD |
| MED1 | SNV | Missense_Mutation | rs764603504 | c.2012N>A | p.Ser671Tyr | p.S671Y | Q15648 | protein_coding | deleterious_low_confidence(0) | probably_damaging(0.979) | TCGA-BH-A2L8-01 | Breast | breast invasive carcinoma | Female | <65 | I/II | Chemotherapy | cytoxan | CR |
| MED1 | SNV | Missense_Mutation | | c.2672N>G | p.Asp891Gly | p.D891G | Q15648 | protein_coding | deleterious_low_confidence(0) | probably_damaging(0.94) | TCGA-D8-A1Y1-01 | Breast | breast invasive carcinoma | Female | >=65 | III/IV | Hormone Therapy | tamoxiphen | PD |
| MED1 | SNV | Missense_Mutation | | c.440T>C | p.Phe147Ser | p.F147S | Q15648 | protein_coding | deleterious(0) | probably_damaging(0.992) | TCGA-EW-A1OV-01 | Breast | breast invasive carcinoma | Female | <65 | I/II | Chemotherapy | epirubicin | SD |
| MED1 | insertion | In_Frame_Ins | novel | c.4587_4588insAAAAAATCTCATAGCATCAAG | p.Lys1523_Lys1529dup | p.K1523_K1529dup | Q15648 | protein_coding | | | TCGA-A7-A0DB-01 | Breast | breast invasive carcinoma | Female | <65 | I/II | Hormone Therapy | arimidex | SD |
| MED1 | deletion | Frame_Shift_Del | | c.1709delN | p.Gly570ValfsTer9 | p.G570Vfs*9 | Q15648 | protein_coding | | | TCGA-AN-A0AK-01 | Breast | breast invasive carcinoma | Female | >=65 | I/II | Unknown | Unknown | SD |
| MED1 | SNV | Missense_Mutation | rs199907019 | c.1883N>T | p.Thr628Met | p.T628M | Q15648 | protein_coding | deleterious_low_confidence(0) | benign(0.062) | TCGA-2W-A8YY-01 | Cervix | cervical & endocervical cancer | Female | <65 | I/II | Chemotherapy | cisplatin | CR |


