
|
|||||
|
 | |
| |
| |
| |
| |
| |
|
Gene: MCPH1 |
Gene summary for MCPH1 |
| Gene information | Species | Human | Gene symbol | MCPH1 | Gene ID | 79648 |
| Gene name | microcephalin 1 | |
| Gene Alias | BRIT1 | |
| Cytomap | 8p23.1 | |
| Gene Type | protein-coding | GO ID | GO:0000122 | UniProtAcc | Q8NEM0 |
Top |
Malignant transformation analysis |
| Identification of the aberrant gene expression in precancerous and cancerous lesions by comparing the gene expression of stem-like cells in diseased tissues with normal stem cells |
| Entrez ID | Symbol | Replicates | Species | Organ | Tissue | Adj P-value | Log2FC | Malignancy |
| 79648 | MCPH1 | HTA11_3410_2000001011 | Human | Colorectum | AD | 2.67e-16 | -5.98e-01 | 0.0155 |
| 79648 | MCPH1 | HTA11_2487_2000001011 | Human | Colorectum | SER | 5.53e-06 | -5.30e-01 | -0.1808 |
| 79648 | MCPH1 | HTA11_78_2000001011 | Human | Colorectum | AD | 1.56e-02 | -3.45e-01 | -0.1088 |
| 79648 | MCPH1 | HTA11_347_2000001011 | Human | Colorectum | AD | 6.30e-04 | -3.21e-01 | -0.1954 |
| 79648 | MCPH1 | HTA11_3361_2000001011 | Human | Colorectum | AD | 9.75e-06 | -5.45e-01 | -0.1207 |
| 79648 | MCPH1 | HTA11_83_2000001011 | Human | Colorectum | SER | 6.43e-03 | -5.18e-01 | -0.1526 |
| 79648 | MCPH1 | HTA11_696_2000001011 | Human | Colorectum | AD | 1.00e-13 | -4.31e-01 | -0.1464 |
| 79648 | MCPH1 | HTA11_866_2000001011 | Human | Colorectum | AD | 5.17e-09 | -4.10e-01 | -0.1001 |
| 79648 | MCPH1 | HTA11_1391_2000001011 | Human | Colorectum | AD | 3.75e-02 | -3.27e-01 | -0.059 |
| 79648 | MCPH1 | HTA11_5212_2000001011 | Human | Colorectum | AD | 2.44e-02 | -6.13e-01 | -0.2061 |
| 79648 | MCPH1 | HTA11_7862_2000001011 | Human | Colorectum | AD | 1.94e-03 | -6.14e-01 | -0.0179 |
| 79648 | MCPH1 | HTA11_866_3004761011 | Human | Colorectum | AD | 1.28e-12 | -5.59e-01 | 0.096 |
| 79648 | MCPH1 | HTA11_7696_3000711011 | Human | Colorectum | AD | 3.04e-16 | -4.78e-01 | 0.0674 |
| 79648 | MCPH1 | HTA11_99999970781_79442 | Human | Colorectum | MSS | 2.49e-21 | -5.38e-01 | 0.294 |
| 79648 | MCPH1 | HTA11_99999965104_69814 | Human | Colorectum | MSS | 5.99e-07 | -6.02e-01 | 0.281 |
| 79648 | MCPH1 | HTA11_99999971662_82457 | Human | Colorectum | MSS | 1.73e-07 | -3.49e-01 | 0.3859 |
| 79648 | MCPH1 | HTA11_99999973899_84307 | Human | Colorectum | MSS | 2.62e-03 | -5.52e-01 | 0.2585 |
| 79648 | MCPH1 | HTA11_99999974143_84620 | Human | Colorectum | MSS | 9.75e-19 | -5.31e-01 | 0.3005 |
| 79648 | MCPH1 | A001-C-207 | Human | Colorectum | FAP | 6.95e-03 | -2.19e-01 | 0.1278 |
| 79648 | MCPH1 | A015-C-203 | Human | Colorectum | FAP | 6.82e-18 | -2.27e-01 | -0.1294 |
| Page: 1 2 3 4 5 6 |
| Tissue | Expression Dynamics | Abbreviation |
| Colorectum (GSE201348) |  | FAP: Familial adenomatous polyposis |
| CRC: Colorectal cancer | ||
| Colorectum (HTA11) |  | AD: Adenomas |
| SER: Sessile serrated lesions | ||
| MSI-H: Microsatellite-high colorectal cancer | ||
| MSS: Microsatellite stable colorectal cancer | ||
| Esophagus | 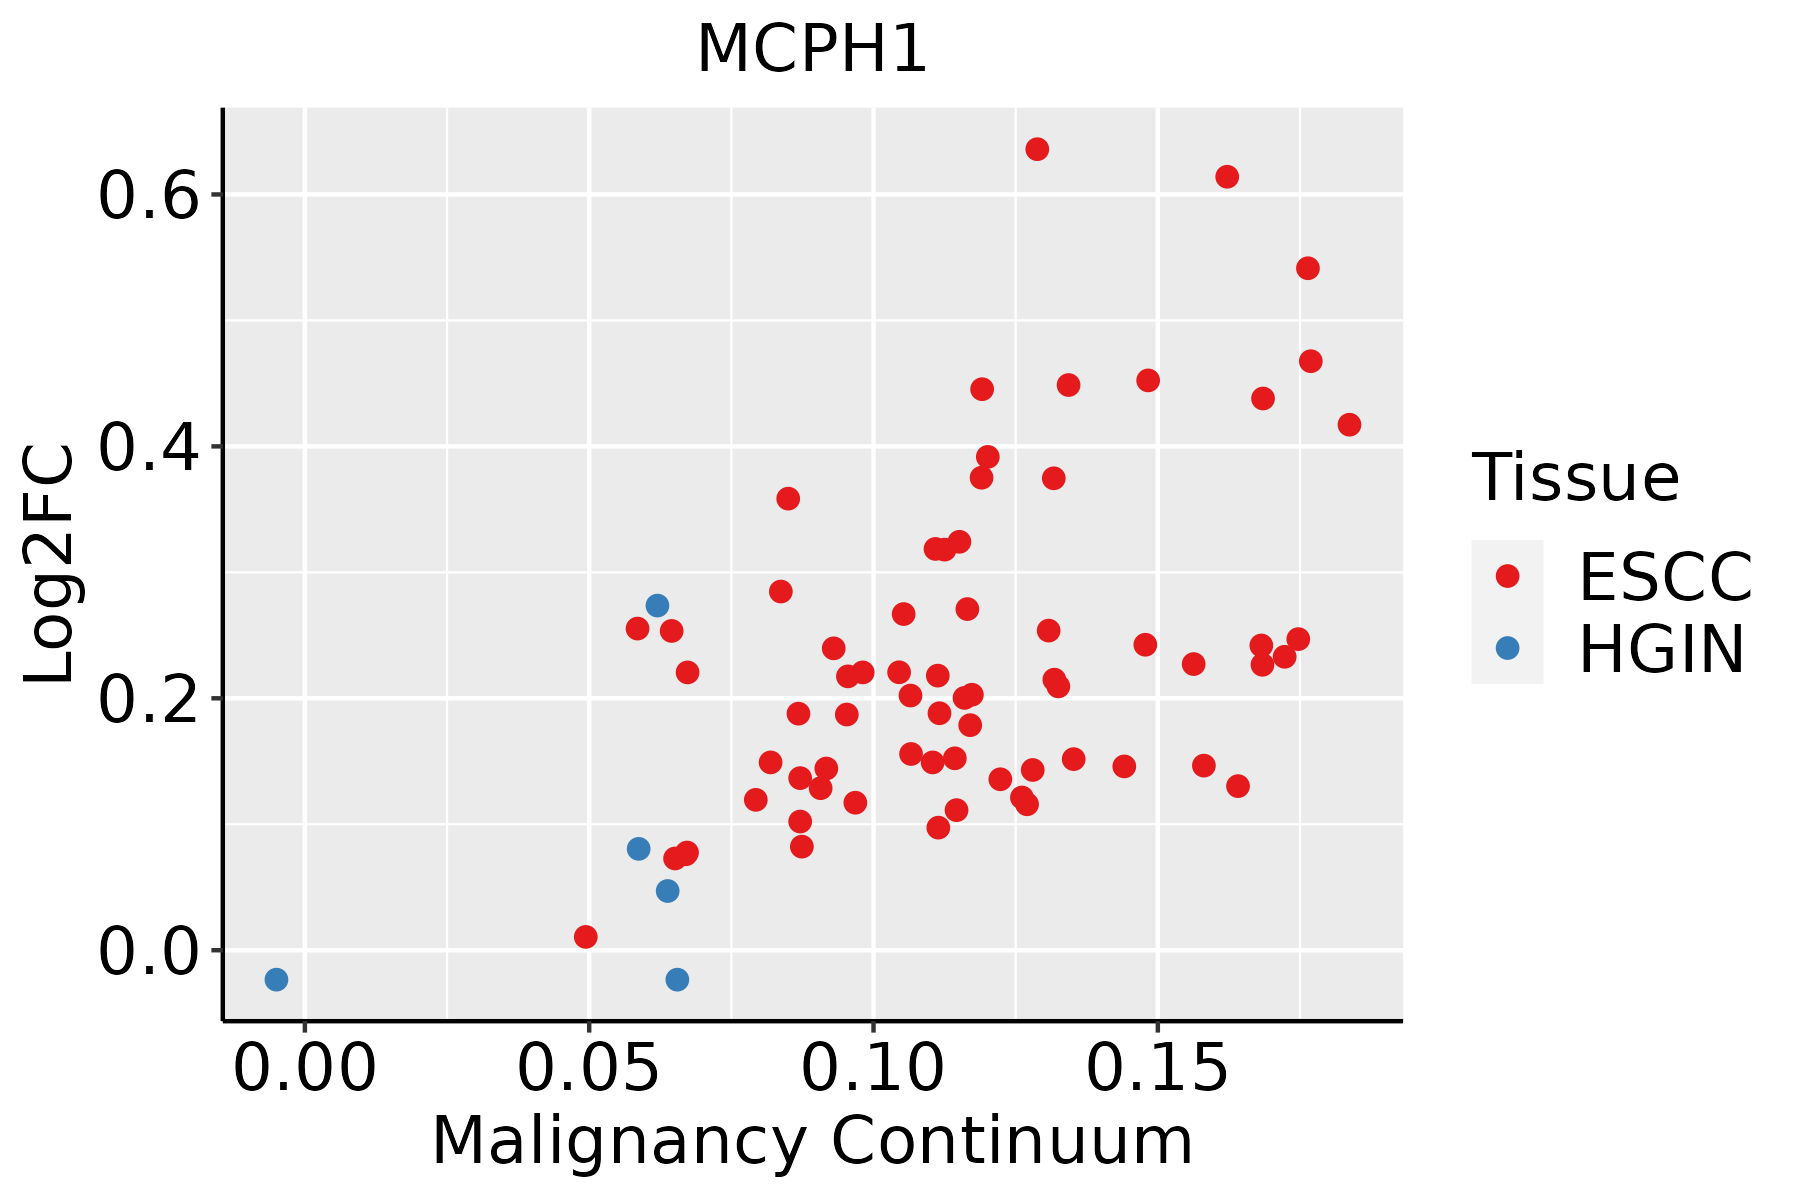 | ESCC: Esophageal squamous cell carcinoma |
| HGIN: High-grade intraepithelial neoplasias | ||
| LGIN: Low-grade intraepithelial neoplasias | ||
| Liver | 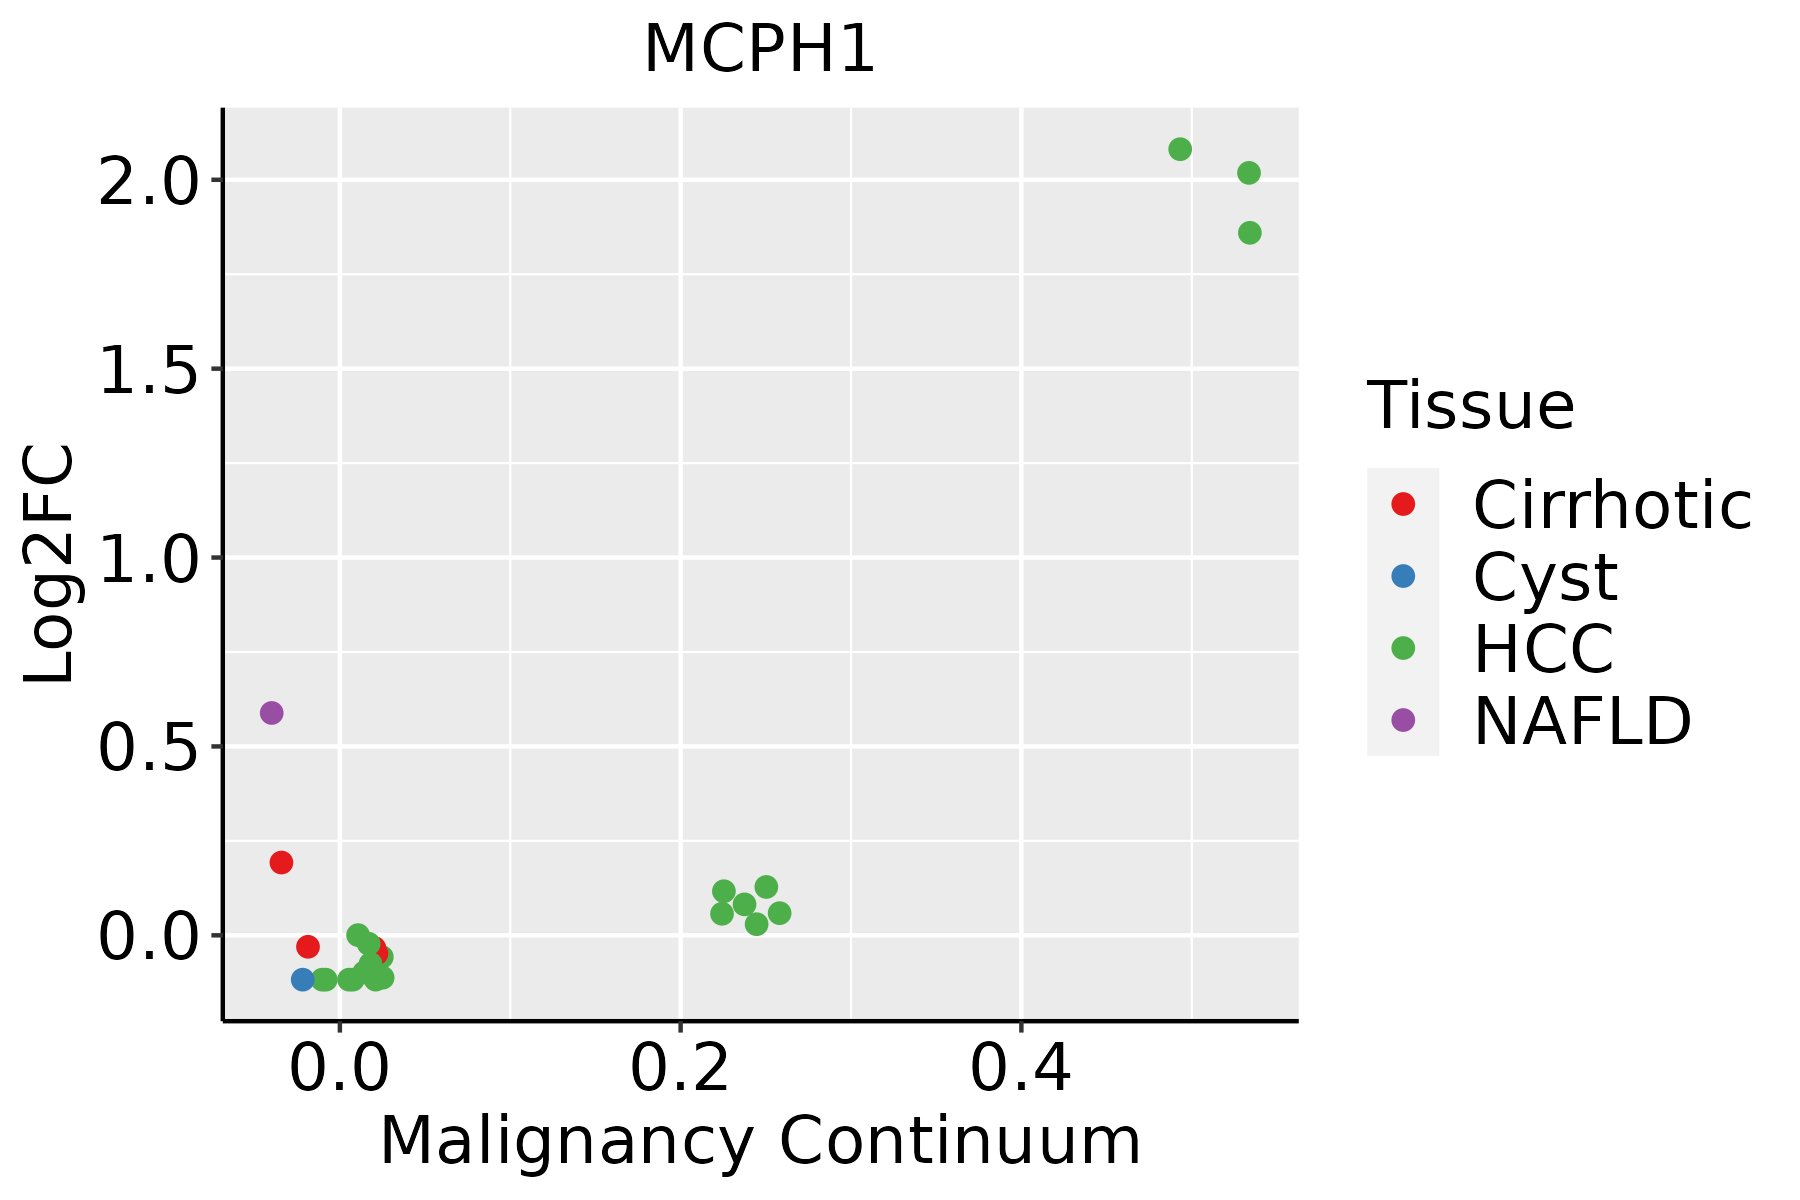 | HCC: Hepatocellular carcinoma |
| NAFLD: Non-alcoholic fatty liver disease |
| ∗log2FC in expression of this searched gene in stem-like cells from each diseased tissue sample relative to stem-like cells in normal samples in each tissue plotted against the malignancy continuum. Samples are colored based on if they are from different disease stage. |
Top |
Malignant transformation related pathway analysis |
| Find out the enriched GO biological processes and KEGG pathways involved in transition from healthy to precancer to cancer |
| Tissue | Disease Stage | Enriched GO biological Processes |
| Colorectum | AD |  |
| Colorectum | SER |  |
| Colorectum | MSS |  |
| Colorectum | MSI-H |  |
| Colorectum | FAP |  |
| ∗Top 15 enriched GO BP terms are showed in the bar plot of each disease state in each tissue. Each row represents a significant GO biological process which is colored according to the -log10(p.adjust). |
| Page: 1 2 3 4 5 6 7 8 9 |
| GO ID | Tissue | Disease Stage | Description | Gene Ratio | Bg Ratio | pvalue | p.adjust | Count |
| GO:00987273 | Liver | NAFLD | maintenance of cell number | 26/1882 | 134/18723 | 7.72e-04 | 9.73e-03 | 26 |
| GO:00715394 | Liver | NAFLD | protein localization to centrosome | 10/1882 | 33/18723 | 1.09e-03 | 1.27e-02 | 10 |
| GO:19055084 | Liver | NAFLD | protein localization to microtubule organizing center | 10/1882 | 35/18723 | 1.79e-03 | 1.85e-02 | 10 |
| GO:00516565 | Liver | NAFLD | establishment of organelle localization | 57/1882 | 390/18723 | 2.52e-03 | 2.34e-02 | 57 |
| GO:00603481 | Liver | NAFLD | bone development | 33/1882 | 205/18723 | 4.45e-03 | 3.60e-02 | 33 |
| GO:00726983 | Liver | NAFLD | protein localization to microtubule cytoskeleton | 12/1882 | 54/18723 | 6.44e-03 | 4.69e-02 | 12 |
| GO:003304421 | Liver | HCC | regulation of chromosome organization | 125/7958 | 187/18723 | 1.35e-11 | 5.40e-10 | 125 |
| GO:005165621 | Liver | HCC | establishment of organelle localization | 226/7958 | 390/18723 | 4.15e-10 | 1.34e-08 | 226 |
| GO:000716322 | Liver | HCC | establishment or maintenance of cell polarity | 133/7958 | 218/18723 | 2.48e-08 | 5.73e-07 | 133 |
| GO:190285011 | Liver | HCC | microtubule cytoskeleton organization involved in mitosis | 93/7958 | 147/18723 | 2.91e-07 | 5.09e-06 | 93 |
| GO:003001022 | Liver | HCC | establishment of cell polarity | 82/7958 | 143/18723 | 2.38e-04 | 1.79e-03 | 82 |
| GO:0031023 | Liver | HCC | microtubule organizing center organization | 82/7958 | 143/18723 | 2.38e-04 | 1.79e-03 | 82 |
| GO:00987272 | Liver | HCC | maintenance of cell number | 77/7958 | 134/18723 | 3.32e-04 | 2.33e-03 | 77 |
| GO:0007098 | Liver | HCC | centrosome cycle | 75/7958 | 130/18723 | 3.33e-04 | 2.34e-03 | 75 |
| GO:00443802 | Liver | HCC | protein localization to cytoskeleton | 38/7958 | 58/18723 | 3.37e-04 | 2.36e-03 | 38 |
| GO:00198272 | Liver | HCC | stem cell population maintenance | 75/7958 | 131/18723 | 4.58e-04 | 3.04e-03 | 75 |
| GO:007269811 | Liver | HCC | protein localization to microtubule cytoskeleton | 35/7958 | 54/18723 | 7.73e-04 | 4.65e-03 | 35 |
| GO:0032886 | Liver | HCC | regulation of microtubule-based process | 123/7958 | 240/18723 | 3.69e-03 | 1.64e-02 | 123 |
| GO:190550811 | Liver | HCC | protein localization to microtubule organizing center | 23/7958 | 35/18723 | 4.72e-03 | 2.02e-02 | 23 |
| GO:00466052 | Liver | HCC | regulation of centrosome cycle | 30/7958 | 49/18723 | 6.31e-03 | 2.57e-02 | 30 |
| Page: 1 2 3 4 5 6 |
| Pathway ID | Tissue | Disease Stage | Description | Gene Ratio | Bg Ratio | pvalue | p.adjust | qvalue | Count |
| Page: 1 |
Top |
Cell-cell communication analysis |
| Identification of potential cell-cell interactions between two cell types and their ligand-receptor pairs for different disease states |
| Ligand | Receptor | LRpair | Pathway | Tissue | Disease Stage |
| Page: 1 |
Top |
Single-cell gene regulatory network inference analysis |
| Find out the significant the regulons (TFs) and the target genes of each regulon across cell types for different disease states |
| TF | Cell Type | Tissue | Disease Stage | Target Gene | RSS | Regulon Activity |
| ∗The dot plots of a searched regulon are shown for all cell subpopulations in each disease state of each tissue based on the regulon specific score inferred using pySCENIC and by calculating the average expression. |
| Page: 1 |
Top |
Somatic mutation of malignant transformation related genes |
| Annotation of somatic variants for genes involved in malignant transformation |
| Hugo Symbol | Variant Class | Variant Classification | dbSNP RS | HGVSc | HGVSp | HGVSp Short | SWISSPROT | BIOTYPE | SIFT | PolyPhen | Tumor Sample Barcode | Tissue | Histology | Sex | Age | Stage | Therapy Types | Drugs | Outcome |
| MCPH1 | SNV | Missense_Mutation | c.1937N>A | p.Pro646Gln | p.P646Q | protein_coding | deleterious(0) | benign(0.162) | TCGA-A8-A097-01 | Breast | breast invasive carcinoma | Female | >=65 | I/II | Hormone Therapy | tamoxiphen | SD | ||
| MCPH1 | SNV | Missense_Mutation | c.1936N>T | p.Pro646Ser | p.P646S | protein_coding | deleterious(0.01) | possibly_damaging(0.474) | TCGA-A8-A09Z-01 | Breast | breast invasive carcinoma | Female | >=65 | I/II | Unknown | Unknown | SD | ||
| MCPH1 | SNV | Missense_Mutation | novel | c.2361N>A | p.Ser787Arg | p.S787R | protein_coding | deleterious(0.02) | probably_damaging(0.931) | TCGA-BH-A0HF-01 | Breast | breast invasive carcinoma | Female | >=65 | I/II | Hormone Therapy | arimidex | SD | |
| MCPH1 | SNV | Missense_Mutation | novel | c.1660N>A | p.Glu554Lys | p.E554K | protein_coding | tolerated(0.22) | possibly_damaging(0.465) | TCGA-BH-A2L8-01 | Breast | breast invasive carcinoma | Female | <65 | I/II | Chemotherapy | cytoxan | CR | |
| MCPH1 | deletion | Frame_Shift_Del | c.1402delA | p.Thr468ProfsTer32 | p.T468Pfs*32 | protein_coding | TCGA-AN-A0AK-01 | Breast | breast invasive carcinoma | Female | >=65 | I/II | Unknown | Unknown | SD | ||||
| MCPH1 | insertion | Frame_Shift_Ins | novel | c.2363_2364insGTCTGCCTTAACTGACTTGGAGGTAAATAGATTCGGAG | p.Val789SerfsTer42 | p.V789Sfs*42 | protein_coding | TCGA-BH-A0HF-01 | Breast | breast invasive carcinoma | Female | >=65 | I/II | Hormone Therapy | arimidex | SD | |||
| MCPH1 | SNV | Missense_Mutation | rs751512309 | c.2105N>T | p.Ala702Val | p.A702V | protein_coding | deleterious(0.04) | benign(0.31) | TCGA-2W-A8YY-01 | Cervix | cervical & endocervical cancer | Female | <65 | I/II | Chemotherapy | cisplatin | CR | |
| MCPH1 | SNV | Missense_Mutation | novel | c.892N>A | p.Glu298Lys | p.E298K | protein_coding | tolerated(0.2) | benign(0.169) | TCGA-C5-A7UI-01 | Cervix | cervical & endocervical cancer | Female | <65 | I/II | Unknown | Unknown | SD | |
| MCPH1 | deletion | Frame_Shift_Del | c.1402delA | p.Thr468ProfsTer32 | p.T468Pfs*32 | protein_coding | TCGA-EA-A410-01 | Cervix | cervical & endocervical cancer | Female | <65 | I/II | Unknown | Unknown | SD | ||||
| MCPH1 | SNV | Missense_Mutation | rs536823455 | c.2255G>A | p.Arg752His | p.R752H | protein_coding | deleterious(0.03) | benign(0.013) | TCGA-AA-3864-01 | Colorectum | colon adenocarcinoma | Male | >=65 | I/II | Unknown | Unknown | SD |
| Page: 1 2 3 4 5 6 7 8 9 10 |
Top |
Related drugs of malignant transformation related genes |
| Identification of chemicals and drugs interact with genes involved in malignant transfromation |
| (DGIdb 4.0) |
| Entrez ID | Symbol | Category | Interaction Types | Drug Claim Name | Drug Name | PMIDs |
| Page: 1 |

Copyright 2023-Present -The University of Texas Health Science Center at Houston |