Schematic overview of the cellular and molecular mechanisms involved in the cancer progression, including the proposed cellular and molecular mechanisms in cancer cells trajectory. AT1: alveolar type 1 cells; AT2: alveolar type 2 cells; AAH: atypical adenomatous hyperplasia; AIS: adenocarcinoma in situ; MIA: minimally invasive adenocarcinoma; IA: invasive adenocarcinoma; EMT: epithelial-mesenchymal transition

Home

Download

Statistics

Help

Contact

Center for Computational Systems Medicine
leaf

Gene summary

leaf

Malignant transformation analysis

leaf

Malignant transformation related pathway analysis

leaf

Cell-cell communication analysis

leaf

Single-cell gene regulatory network inference analysis

leaf

Somatic mutation of malignant transformation related genes

leaf

Related drugs of malignant transformation related genes

Gene: MBP

Gene summary for MBP

check button Gene summary.

Gene informationSpeciesHuman
Gene symbol

MBP

Gene ID

4155

Gene namemyelin basic protein
Gene AliasMBP
Cytomap18q23
Gene Typeprotein-coding
GO ID

GO:0000165

UniProtAcc

P02686


Top

Malignant transformation analysis

check button Identification of the aberrant gene expression in precancerous and cancerous lesions by comparing the gene expression of stem-like cells in diseased tissues with normal stem cells
check button Malignant transformation involving gene list.
Entrez IDSymbolReplicatesSpeciesOrganTissueAdj P-valueLog2FCMalignancy
4155MBPHTA11_3410_2000001011HumanColorectumAD1.79e-03-2.52e-010.0155
4155MBPHTA11_347_2000001011HumanColorectumAD1.26e-033.58e-01-0.1954
4155MBPHTA11_411_2000001011HumanColorectumSER3.67e-027.88e-01-0.2602
4155MBPHTA11_99999974143_84620HumanColorectumMSS6.56e-03-2.75e-010.3005
4155MBPF007HumanColorectumFAP1.61e-03-3.40e-010.1176
4155MBPA001-C-207HumanColorectumFAP8.58e-06-2.89e-010.1278
4155MBPA015-C-203HumanColorectumFAP4.63e-27-4.07e-01-0.1294
4155MBPA015-C-204HumanColorectumFAP5.91e-07-3.66e-01-0.0228
4155MBPA014-C-040HumanColorectumFAP3.63e-04-3.82e-01-0.1184
4155MBPA002-C-201HumanColorectumFAP6.35e-18-4.80e-010.0324
4155MBPA002-C-203HumanColorectumFAP4.79e-06-2.30e-010.2786
4155MBPA001-C-119HumanColorectumFAP1.71e-05-3.45e-01-0.1557
4155MBPA001-C-108HumanColorectumFAP3.68e-16-3.49e-01-0.0272
4155MBPA002-C-205HumanColorectumFAP8.93e-22-4.59e-01-0.1236
4155MBPA001-C-104HumanColorectumFAP4.55e-04-2.50e-010.0184
4155MBPA015-C-005HumanColorectumFAP4.24e-02-1.36e-01-0.0336
4155MBPA015-C-006HumanColorectumFAP2.82e-15-4.64e-01-0.0994
4155MBPA015-C-106HumanColorectumFAP3.41e-14-2.77e-01-0.0511
4155MBPA002-C-114HumanColorectumFAP4.57e-16-3.91e-01-0.1561
4155MBPA015-C-104HumanColorectumFAP3.43e-30-3.25e-01-0.1899
Page: 1 2 3 4 5 6 7 8 9 

check button Transcriptomic changes along malignancy continuum.
TissueExpression DynamicsAbbreviation
Colorectum (GSE201348)The image shows the transcriptomic changes along malignancy continuum.log2FC in expression of this searched gene in stem-like cells from each diseased tissue sample relative to stem-like cells in normal samples in each tissue plotted against the malignancy continuum. Samples are colored based on if they are from different disease stage.FAP: Familial adenomatous polyposis
CRC: Colorectal cancer
Colorectum (HTA11)The image shows the transcriptomic changes along malignancy continuum.log2FC in expression of this searched gene in stem-like cells from each diseased tissue sample relative to stem-like cells in normal samples in each tissue plotted against the malignancy continuum. Samples are colored based on if they are from different disease stage.AD: Adenomas
SER: Sessile serrated lesions
MSI-H: Microsatellite-high colorectal cancer
MSS: Microsatellite stable colorectal cancer
EndometriumThe image shows the transcriptomic changes along malignancy continuum.log2FC in expression of this searched gene in stem-like cells from each diseased tissue sample relative to stem-like cells in normal samples in each tissue plotted against the malignancy continuum. Samples are colored based on if they are from different disease stage.AEH: Atypical endometrial hyperplasia
EEC: Endometrioid Cancer
EsophagusThe image shows the transcriptomic changes along malignancy continuum.log2FC in expression of this searched gene in stem-like cells from each diseased tissue sample relative to stem-like cells in normal samples in each tissue plotted against the malignancy continuum. Samples are colored based on if they are from different disease stage.
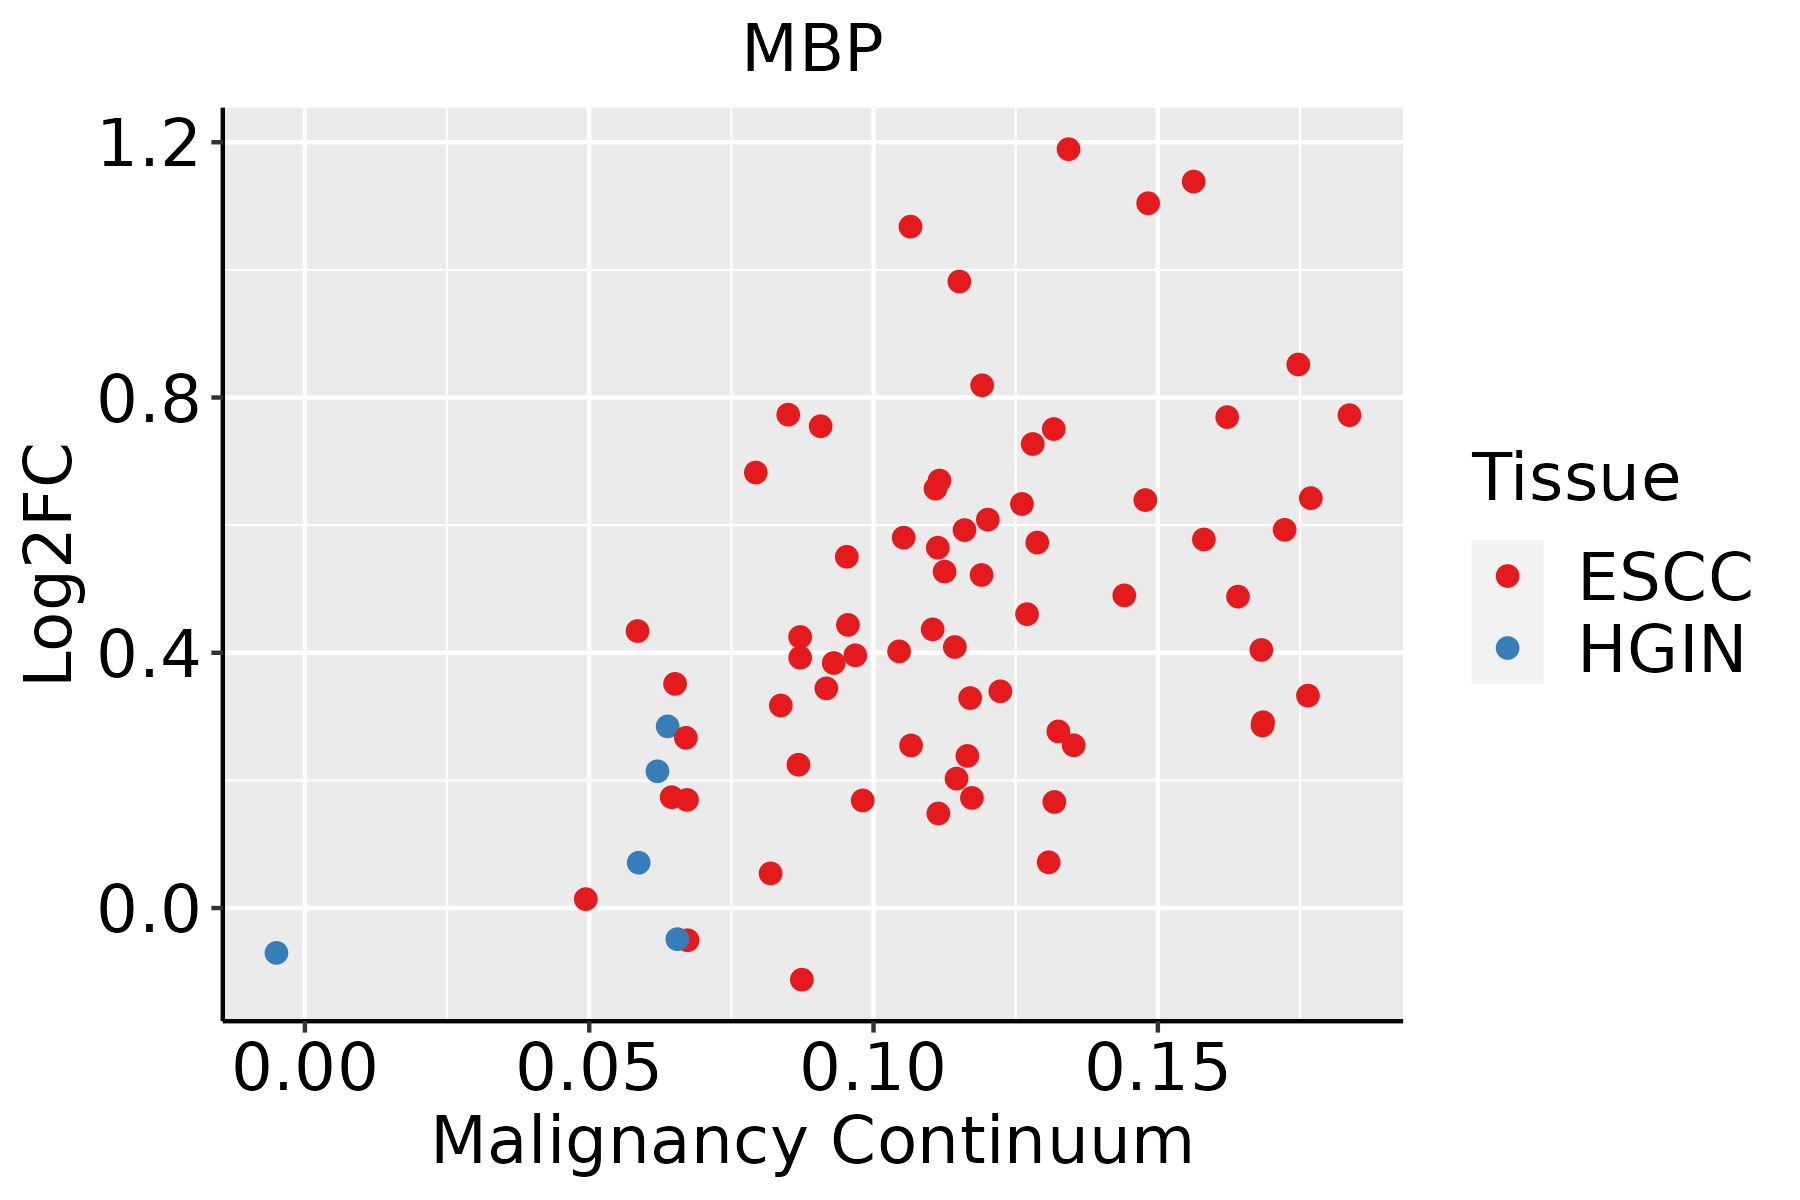
ESCC: Esophageal squamous cell carcinoma
HGIN: High-grade intraepithelial neoplasias
LGIN: Low-grade intraepithelial neoplasias
LiverThe image shows the transcriptomic changes along malignancy continuum.log2FC in expression of this searched gene in stem-like cells from each diseased tissue sample relative to stem-like cells in normal samples in each tissue plotted against the malignancy continuum. Samples are colored based on if they are from different disease stage.
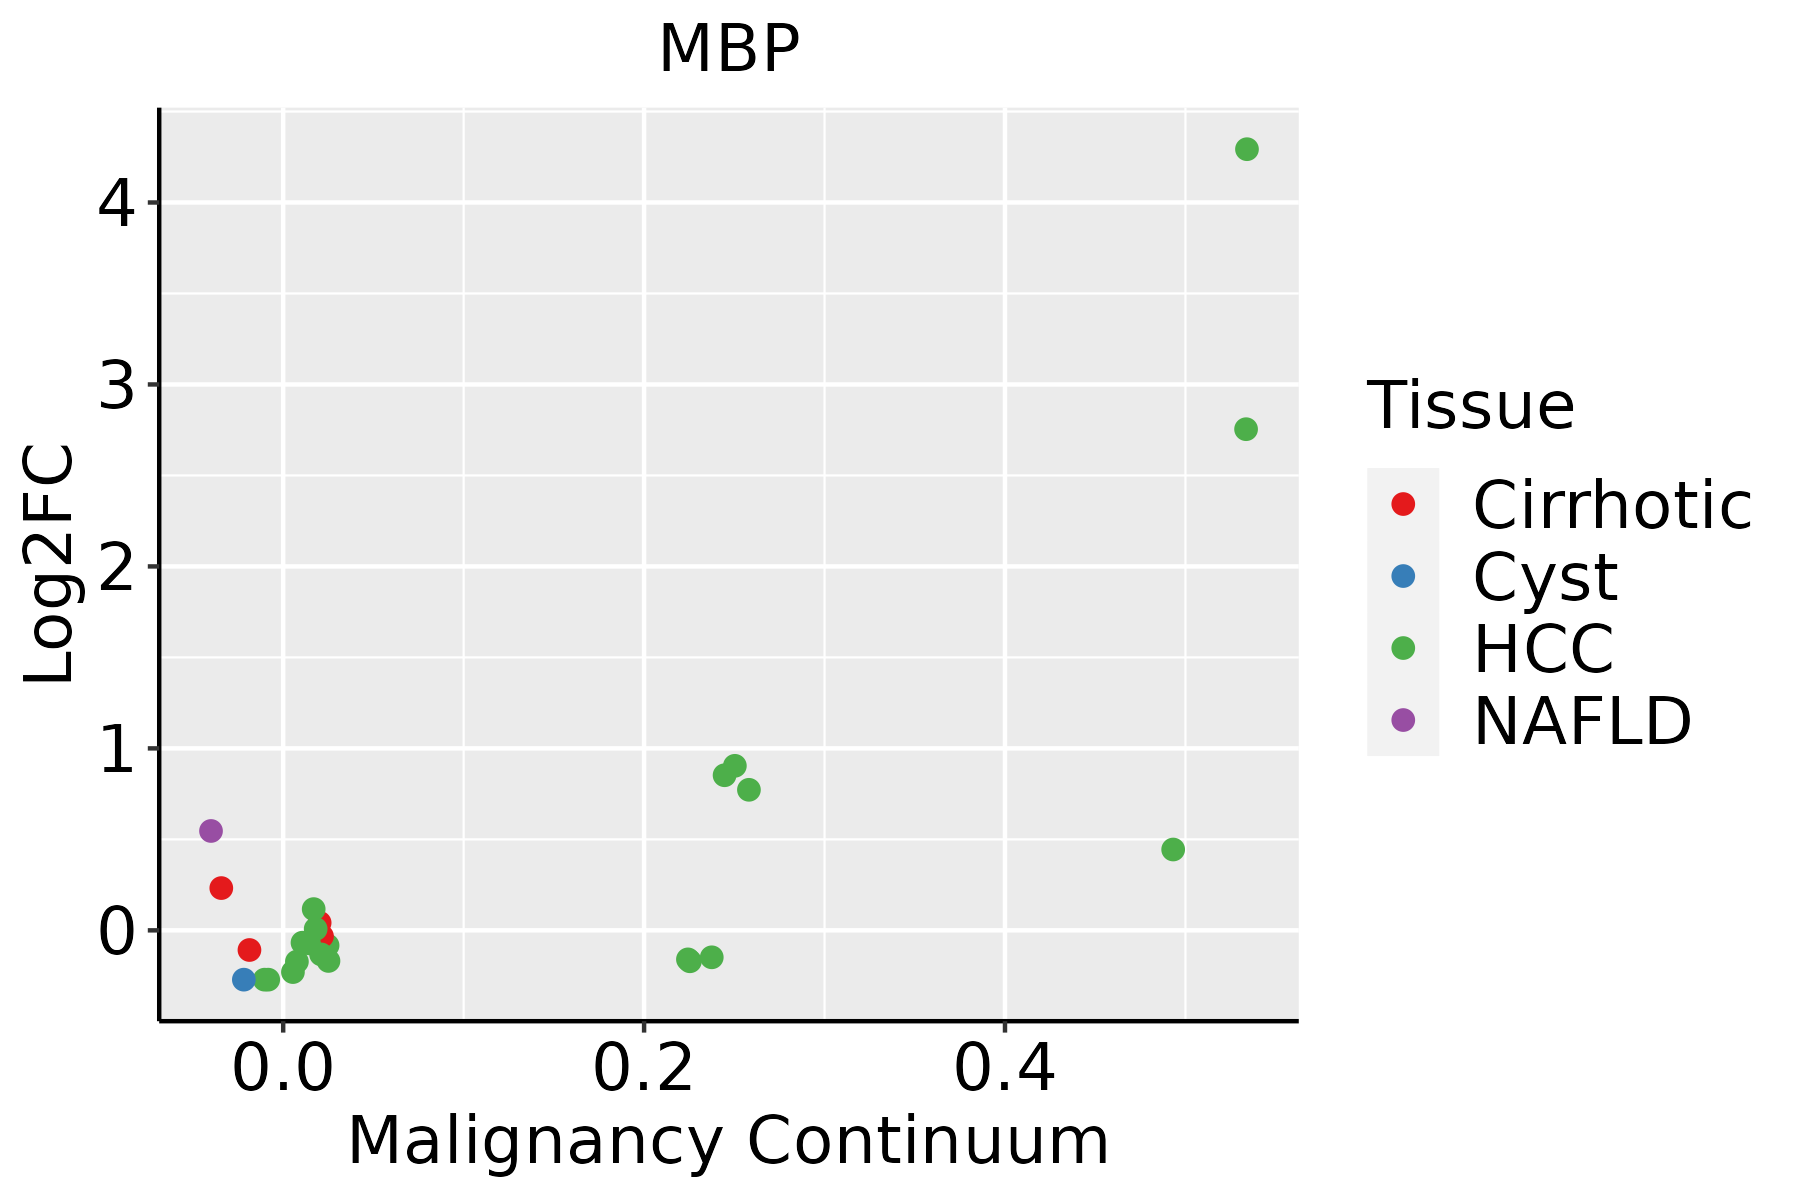
HCC: Hepatocellular carcinoma
NAFLD: Non-alcoholic fatty liver disease
LungThe image shows the transcriptomic changes along malignancy continuum.log2FC in expression of this searched gene in stem-like cells from each diseased tissue sample relative to stem-like cells in normal samples in each tissue plotted against the malignancy continuum. Samples are colored based on if they are from different disease stage.
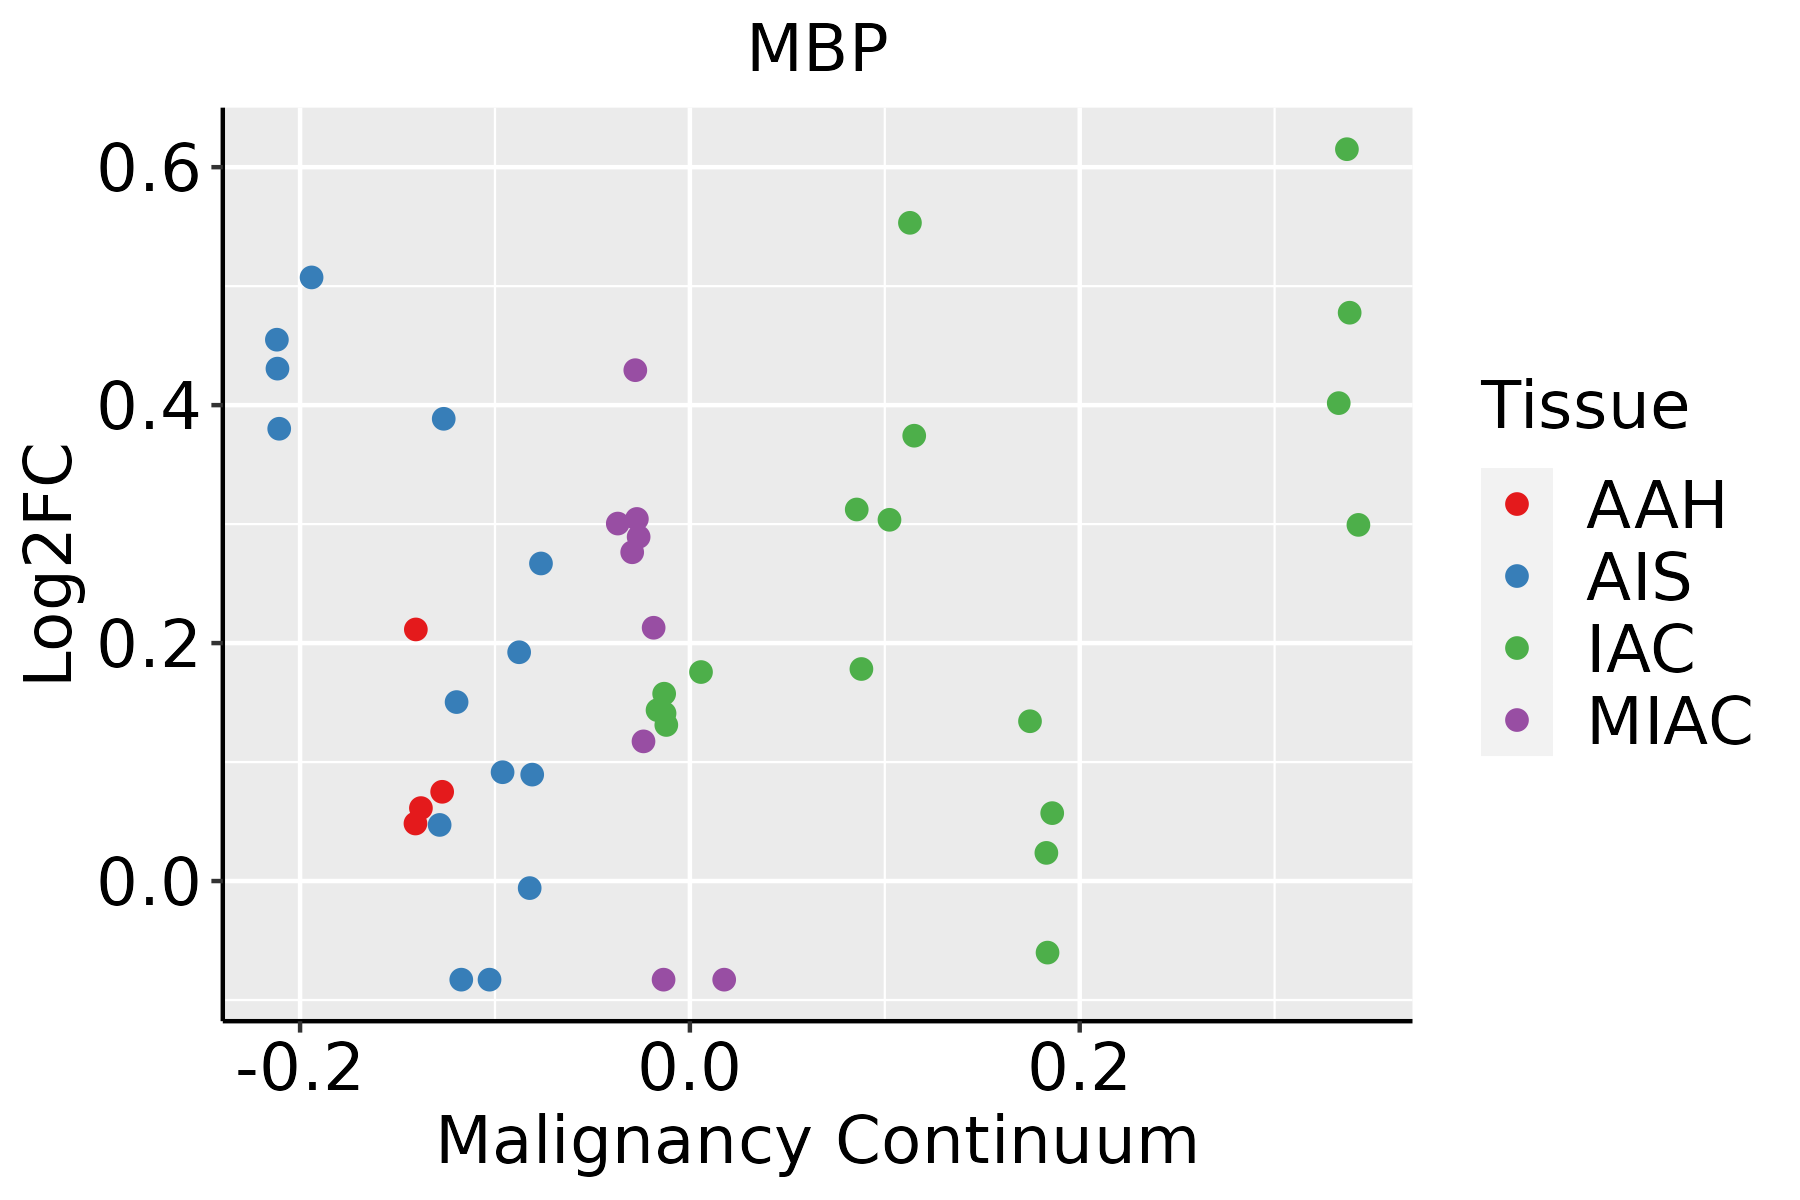
AAH: Atypical adenomatous hyperplasia
AIS: Adenocarcinoma in situ
IAC: Invasive lung adenocarcinoma
MIA: Minimally invasive adenocarcinoma
Oral CavityThe image shows the transcriptomic changes along malignancy continuum.log2FC in expression of this searched gene in stem-like cells from each diseased tissue sample relative to stem-like cells in normal samples in each tissue plotted against the malignancy continuum. Samples are colored based on if they are from different disease stage.EOLP: Erosive Oral lichen planus
LP: leukoplakia
NEOLP: Non-erosive oral lichen planus
OSCC: Oral squamous cell carcinoma
ProstateThe image shows the transcriptomic changes along malignancy continuum.log2FC in expression of this searched gene in stem-like cells from each diseased tissue sample relative to stem-like cells in normal samples in each tissue plotted against the malignancy continuum. Samples are colored based on if they are from different disease stage.BPH: Benign Prostatic Hyperplasia
SkinThe image shows the transcriptomic changes along malignancy continuum.log2FC in expression of this searched gene in stem-like cells from each diseased tissue sample relative to stem-like cells in normal samples in each tissue plotted against the malignancy continuum. Samples are colored based on if they are from different disease stage.
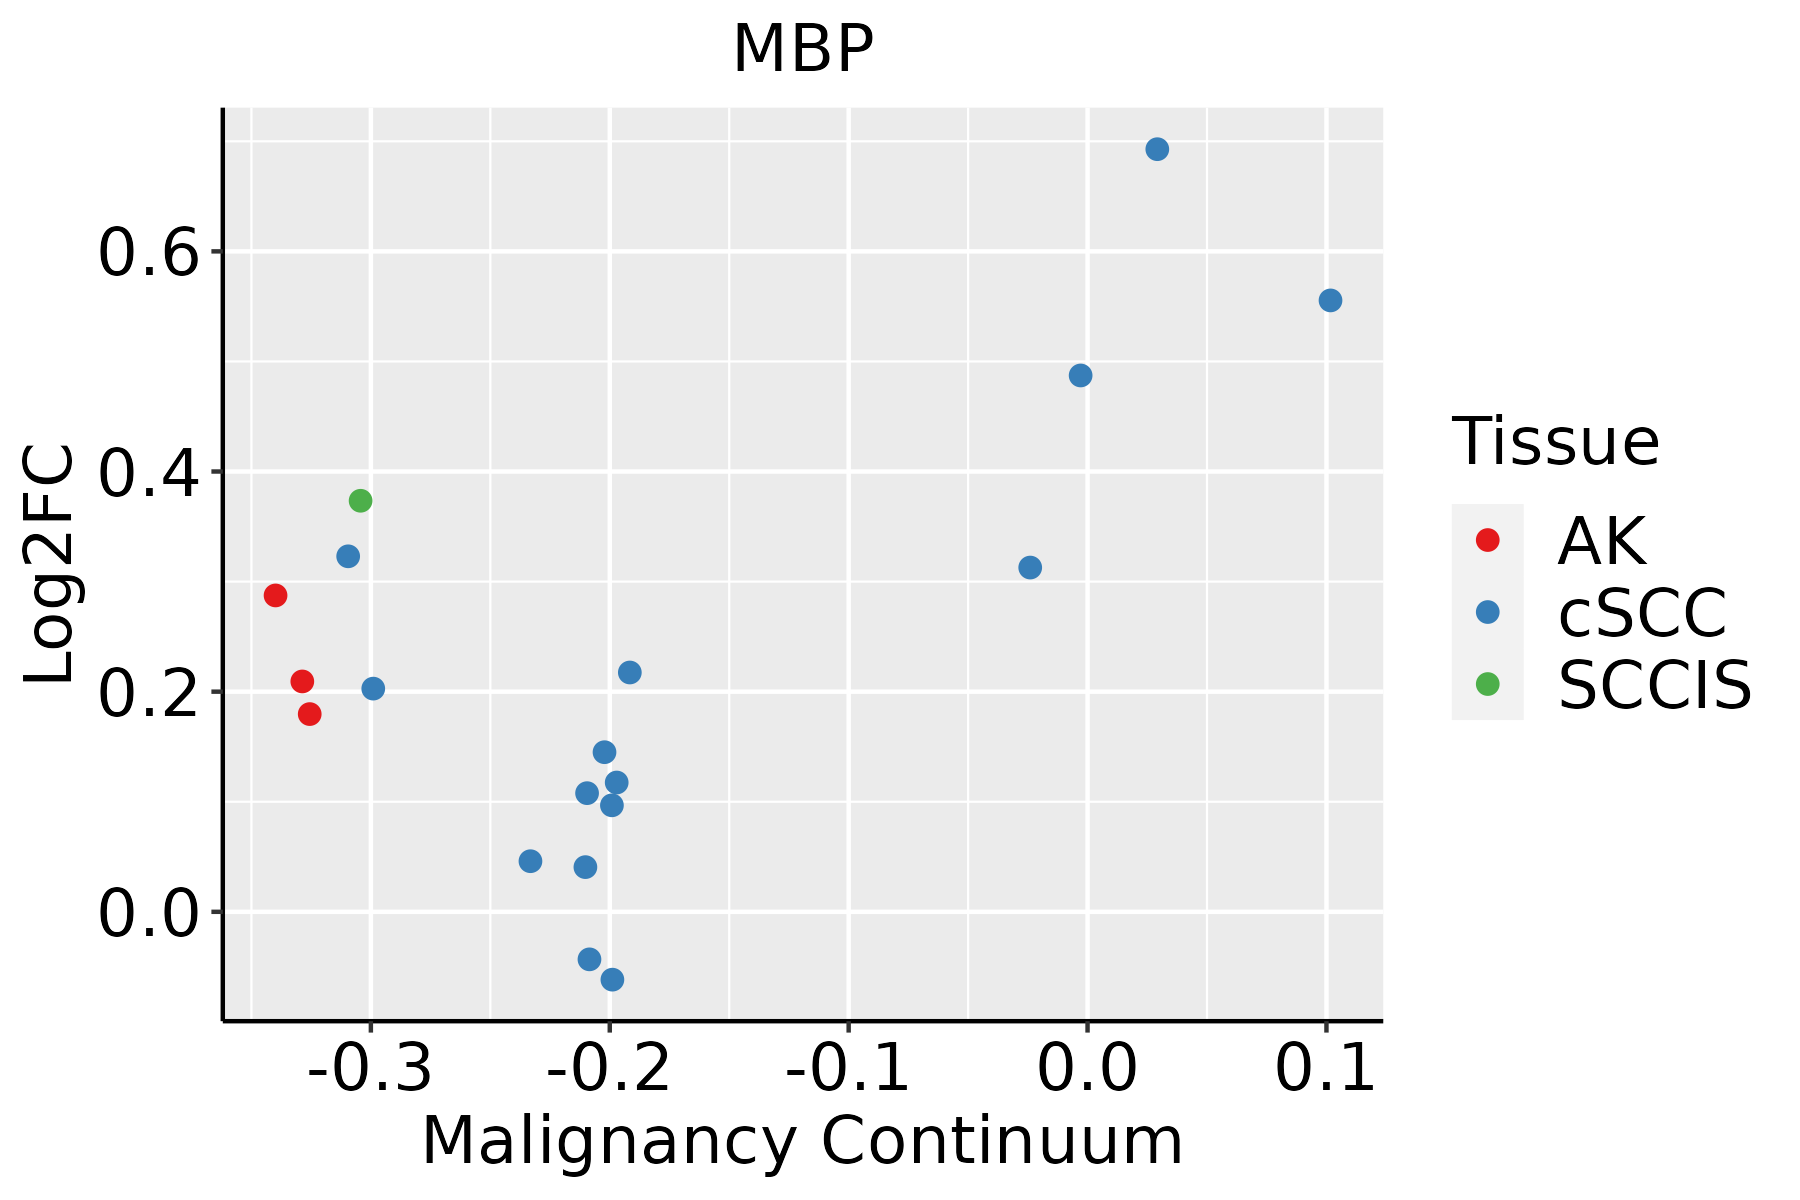
AK: Actinic keratosis
cSCC: Cutaneous squamous cell carcinoma
SCCIS:squamous cell carcinoma in situ
ThyroidThe image shows the transcriptomic changes along malignancy continuum.log2FC in expression of this searched gene in stem-like cells from each diseased tissue sample relative to stem-like cells in normal samples in each tissue plotted against the malignancy continuum. Samples are colored based on if they are from different disease stage.ATC: Anaplastic thyroid cancer
HT: Hashimoto's thyroiditis
PTC: Papillary thyroid cancer
∗log2FC in expression of this searched gene in stem-like cells from each diseased tissue sample relative to stem-like cells in normal samples in each tissue plotted against the malignancy continuum. Samples are colored based on if they are from different disease stage.

Top

Malignant transformation related pathway analysis

check buttonFind out the enriched GO biological processes and KEGG pathways involved in transition from healthy to precancer to cancer
check button Figure of enriched GO biological processes.
TissueDisease StageEnriched GO biological Processes
ColorectumADGO analysis - Figure of enriched GO biological processes: Top 15 enriched GO BP terms are showed in the bar plot of each disease state in each tissue. Each row represents a significant GO biological process which is colored according to the -log10(p.adjust).
ColorectumSERGO analysis - Figure of enriched GO biological processes: Top 15 enriched GO BP terms are showed in the bar plot of each disease state in each tissue. Each row represents a significant GO biological process which is colored according to the -log10(p.adjust).
ColorectumMSSGO analysis - Figure of enriched GO biological processes: Top 15 enriched GO BP terms are showed in the bar plot of each disease state in each tissue. Each row represents a significant GO biological process which is colored according to the -log10(p.adjust).
ColorectumMSI-HGO analysis - Figure of enriched GO biological processes: Top 15 enriched GO BP terms are showed in the bar plot of each disease state in each tissue. Each row represents a significant GO biological process which is colored according to the -log10(p.adjust).
ColorectumFAPGO analysis - Figure of enriched GO biological processes: Top 15 enriched GO BP terms are showed in the bar plot of each disease state in each tissue. Each row represents a significant GO biological process which is colored according to the -log10(p.adjust).
∗Top 15 enriched GO BP terms are showed in the bar plot of each disease state in each tissue. Each row represents a significant GO biological process which is colored according to the -log10(p.adjust).
Page: 1 2 3 4 5 6 7 8 9 

check button Enriched GO biological processes.
GO IDTissueDisease StageDescriptionGene RatioBg Ratiopvaluep.adjustCount
GO:005254816EndometriumAEHregulation of endopeptidase activity76/2100432/187234.42e-057.43e-0476
GO:004885710EndometriumAEHneural nucleus development18/210064/187231.65e-042.15e-0318
GO:001095015EndometriumAEHpositive regulation of endopeptidase activity37/2100179/187231.66e-042.16e-0337
GO:000189410EndometriumAEHtissue homeostasis50/2100268/187232.04e-042.54e-0350
GO:003090110EndometriumAEHmidbrain development22/210090/187233.09e-043.48e-0322
GO:00602499EndometriumAEHanatomical structure homeostasis55/2100314/187235.27e-045.32e-0355
GO:00018198EndometriumAEHpositive regulation of cytokine production71/2100467/187234.76e-033.02e-0271
GO:00071627EndometriumAEHnegative regulation of cell adhesion49/2100303/187235.43e-033.37e-0249
GO:004586217EndometriumEECpositive regulation of proteolysis83/2168372/187232.32e-091.86e-0783
GO:005254717EndometriumEECregulation of peptidase activity91/2168461/187232.00e-078.93e-0691
GO:005254817EndometriumEECregulation of endopeptidase activity82/2168432/187233.96e-061.04e-0482
GO:002240715EndometriumEECregulation of cell-cell adhesion84/2168448/187234.98e-061.24e-0484
GO:001095217EndometriumEECpositive regulation of peptidase activity44/2168197/187231.25e-052.54e-0444
GO:003563314EndometriumEECmaintenance of blood-brain barrier14/216835/187231.62e-053.14e-0414
GO:000963615EndometriumEECresponse to toxic substance54/2168262/187231.65e-053.18e-0454
GO:002176216EndometriumEECsubstantia nigra development16/216844/187231.71e-053.26e-0416
GO:003090113EndometriumEECmidbrain development23/216890/187231.80e-042.21e-0323
GO:000189415EndometriumEECtissue homeostasis51/2168268/187232.34e-042.75e-0351
GO:004885714EndometriumEECneural nucleus development18/216864/187232.47e-042.88e-0318
GO:001095016EndometriumEECpositive regulation of endopeptidase activity37/2168179/187233.13e-043.48e-0337
Page: 1 2 3 4 5 6 7 8 9 10 11 12 13 14 15 16 17 18 19 20 21 22 23 24 

check button Enriched KEGG pathways.
Pathway IDTissueDisease StageDescriptionGene RatioBg Ratiopvaluep.adjustqvalueCount
Page: 1 

Top

Cell-cell communication analysis

check buttonIdentification of potential cell-cell interactions between two cell types and their ligand-receptor pairs for different disease states
LigandReceptorLRpairPathwayTissueDisease Stage
Page: 1 

Top

Single-cell gene regulatory network inference analysis

check buttonFind out the significant the regulons (TFs) and the target genes of each regulon across cell types for different disease states
TFCell TypeTissueDisease StageTarget GeneRSSRegulon Activity
∗The dot plots of a searched regulon are shown for all cell subpopulations in each disease state of each tissue based on the regulon specific score inferred using pySCENIC and by calculating the average expression.
Page: 1 

Top

Somatic mutation of malignant transformation related genes

check buttonAnnotation of somatic variants for genes involved in malignant transformation
Hugo SymbolVariant ClassVariant ClassificationdbSNP RSHGVScHGVSpHGVSp ShortSWISSPROTBIOTYPESIFTPolyPhenTumor Sample BarcodeTissueHistologySexAgeStageTherapy TypesDrugsOutcome
MBPSNVMissense_Mutationc.653N>Gp.Asn218Serp.N218SP02686protein_codingdeleterious_low_confidence(0.03)probably_damaging(0.987)TCGA-BH-A18G-01Breastbreast invasive carcinomaFemale>=65I/IIUnknownUnknownSD
MBPSNVMissense_Mutationc.637C>Tp.Arg213Trpp.R213WP02686protein_codingdeleterious_low_confidence(0)probably_damaging(0.997)TCGA-D8-A1XT-01Breastbreast invasive carcinomaFemale<65I/IIChemotherapyadriamycin+cyclophosphamideSD
MBPSNVMissense_Mutationrs529411261c.206N>Ap.Arg69Hisp.R69HP02686protein_codingtolerated_low_confidence(0.19)benign(0.001)TCGA-A6-2672-01Colorectumcolon adenocarcinomaFemale>=65III/IVUnknownUnknownSD
MBPdeletionFrame_Shift_Delc.86delNp.Lys29ArgfsTer36p.K29Rfs*36P02686protein_codingTCGA-AZ-6598-01Colorectumcolon adenocarcinomaFemale>=65I/IIUnknownUnknownSD
MBPdeletionFrame_Shift_Delc.86delNp.Lys29ArgfsTer36p.K29Rfs*36P02686protein_codingTCGA-CM-6674-01Colorectumcolon adenocarcinomaMale<65I/IIUnknownUnknownSD
MBPSNVMissense_Mutationrs141290653c.263N>Ap.Arg88Hisp.R88HP02686protein_codingdeleterious_low_confidence(0)probably_damaging(0.997)TCGA-A5-A0G1-01Endometriumuterine corpus endometrioid carcinomaFemale>=65I/IIUnknownUnknownSD
MBPSNVMissense_Mutationrs745869718c.404N>Tp.Ala135Valp.A135VP02686protein_codingdeleterious_low_confidence(0.01)probably_damaging(0.994)TCGA-AP-A051-01Endometriumuterine corpus endometrioid carcinomaFemale>=65I/IIUnknownUnknownSD
MBPSNVMissense_Mutationc.394G>Tp.Asp132Tyrp.D132YP02686protein_codingdeleterious_low_confidence(0)possibly_damaging(0.855)TCGA-AP-A1DK-01Endometriumuterine corpus endometrioid carcinomaFemale<65I/IIUnknownUnknownSD
MBPSNVMissense_Mutationnovelc.588N>Ap.His196Glnp.H196QP02686protein_codingtolerated_low_confidence(0.17)probably_damaging(0.992)TCGA-B5-A11E-01Endometriumuterine corpus endometrioid carcinomaFemale<65I/IIUnknownUnknownSD
MBPSNVMissense_Mutationc.109N>Tp.Arg37Trpp.R37WP02686protein_codingdeleterious_low_confidence(0.01)benign(0.312)TCGA-B5-A11Y-01Endometriumuterine corpus endometrioid carcinomaFemale<65I/IIUnknownUnknownSD
Page: 1 2 3 

Top

Related drugs of malignant transformation related genes

check buttonIdentification of chemicals and drugs interact with genes involved in malignant transfromation
(DGIdb 4.0)
Entrez IDSymbolCategoryInteraction TypesDrug Claim NameDrug NamePMIDs
4155MBPCELL SURFACEBIOFLAVONOID9482255
4155MBPCELL SURFACENBI-5788TIPLIMOTIDE
4155MBPCELL SURFACEBHT-3009
4155MBPCELL SURFACECSACYCLOSPORINE9184637
4155MBPCELL SURFACEINTERFERON BETA-1A10932275
4155MBPCELL SURFACEQUERCETINQUERCETIN9482255
4155MBPCELL SURFACEPREDNISONEPREDNISONE10612091
4155MBPCELL SURFACEINSULININSULIN8948451
4155MBPCELL SURFACEATX-MS-1467
Page: 1