
|
|||||
|
 | |
| |
| |
| |
| |
| |
|
Gene: LYAR |
Gene summary for LYAR |
| Gene information | Species | Human | Gene symbol | LYAR | Gene ID | 55646 |
| Gene name | Ly1 antibody reactive | |
| Gene Alias | ZC2HC2 | |
| Cytomap | 4p16.3 | |
| Gene Type | protein-coding | GO ID | GO:0000122 | UniProtAcc | Q9NX58 |
Top |
Malignant transformation analysis |
| Identification of the aberrant gene expression in precancerous and cancerous lesions by comparing the gene expression of stem-like cells in diseased tissues with normal stem cells |
| Entrez ID | Symbol | Replicates | Species | Organ | Tissue | Adj P-value | Log2FC | Malignancy |
| 55646 | LYAR | LZE4T | Human | Esophagus | ESCC | 1.08e-02 | -1.25e-01 | 0.0811 |
| 55646 | LYAR | LZE7T | Human | Esophagus | ESCC | 2.16e-08 | 5.23e-01 | 0.0667 |
| 55646 | LYAR | LZE22T | Human | Esophagus | ESCC | 3.25e-02 | -6.49e-02 | 0.068 |
| 55646 | LYAR | LZE24T | Human | Esophagus | ESCC | 3.82e-03 | 1.28e-01 | 0.0596 |
| 55646 | LYAR | LZE6T | Human | Esophagus | ESCC | 4.90e-06 | 1.50e-01 | 0.0845 |
| 55646 | LYAR | P1T-E | Human | Esophagus | ESCC | 7.82e-06 | 4.34e-02 | 0.0875 |
| 55646 | LYAR | P2T-E | Human | Esophagus | ESCC | 3.30e-22 | 5.09e-01 | 0.1177 |
| 55646 | LYAR | P4T-E | Human | Esophagus | ESCC | 2.75e-08 | 4.59e-01 | 0.1323 |
| 55646 | LYAR | P5T-E | Human | Esophagus | ESCC | 2.80e-19 | 3.57e-01 | 0.1327 |
| 55646 | LYAR | P8T-E | Human | Esophagus | ESCC | 5.92e-18 | 1.86e-01 | 0.0889 |
| 55646 | LYAR | P9T-E | Human | Esophagus | ESCC | 1.23e-05 | 1.76e-01 | 0.1131 |
| 55646 | LYAR | P10T-E | Human | Esophagus | ESCC | 9.46e-10 | 1.34e-01 | 0.116 |
| 55646 | LYAR | P11T-E | Human | Esophagus | ESCC | 7.02e-07 | -2.14e-02 | 0.1426 |
| 55646 | LYAR | P12T-E | Human | Esophagus | ESCC | 5.04e-17 | 9.27e-02 | 0.1122 |
| 55646 | LYAR | P15T-E | Human | Esophagus | ESCC | 4.42e-09 | -2.42e-02 | 0.1149 |
| 55646 | LYAR | P16T-E | Human | Esophagus | ESCC | 1.89e-15 | 3.48e-01 | 0.1153 |
| 55646 | LYAR | P20T-E | Human | Esophagus | ESCC | 1.35e-03 | 1.19e-01 | 0.1124 |
| 55646 | LYAR | P21T-E | Human | Esophagus | ESCC | 2.63e-10 | 3.24e-01 | 0.1617 |
| 55646 | LYAR | P22T-E | Human | Esophagus | ESCC | 8.41e-07 | -5.37e-02 | 0.1236 |
| 55646 | LYAR | P23T-E | Human | Esophagus | ESCC | 2.38e-09 | 3.33e-01 | 0.108 |
| Page: 1 2 3 4 5 6 |
| Tissue | Expression Dynamics | Abbreviation |
| Esophagus | 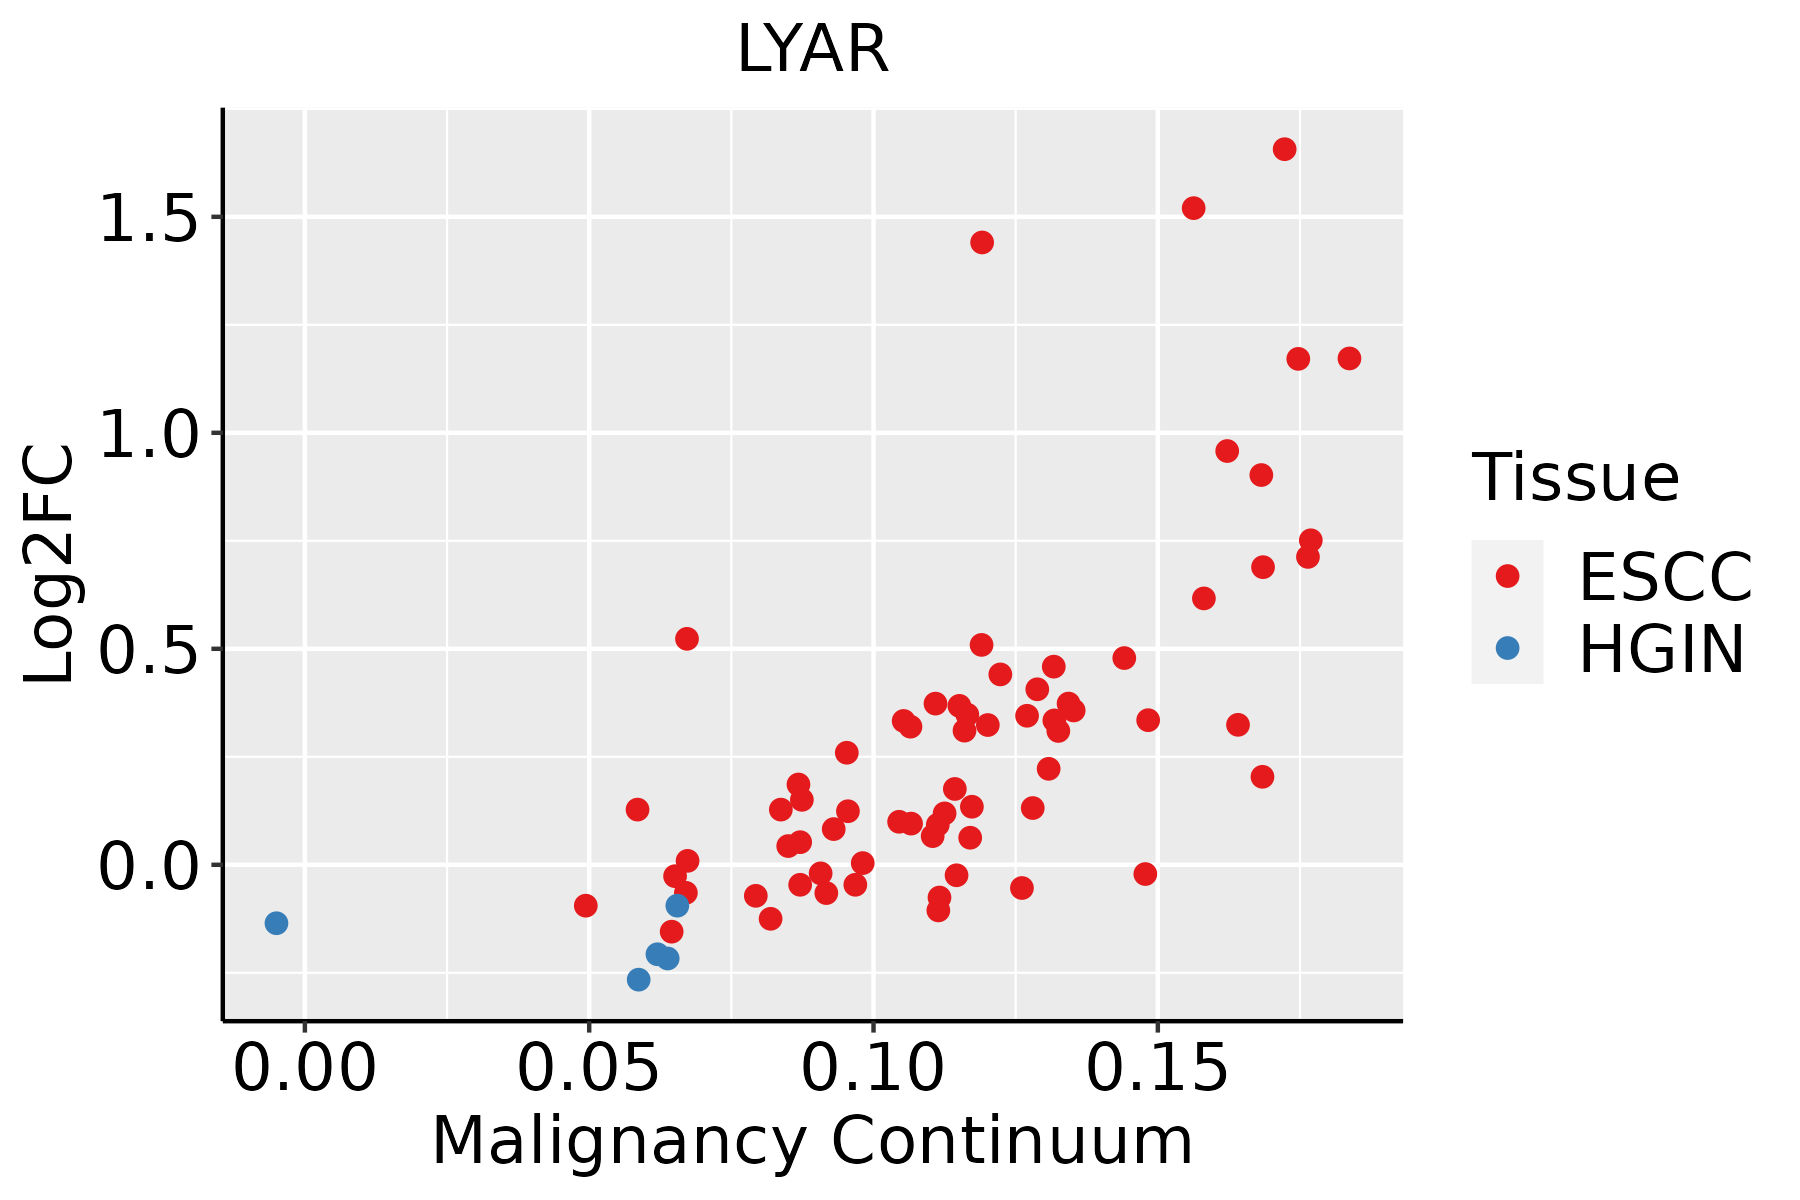 | ESCC: Esophageal squamous cell carcinoma |
| HGIN: High-grade intraepithelial neoplasias | ||
| LGIN: Low-grade intraepithelial neoplasias | ||
| Liver |  | HCC: Hepatocellular carcinoma |
| NAFLD: Non-alcoholic fatty liver disease | ||
| Oral Cavity |  | EOLP: Erosive Oral lichen planus |
| LP: leukoplakia | ||
| NEOLP: Non-erosive oral lichen planus | ||
| OSCC: Oral squamous cell carcinoma | ||
| Skin | 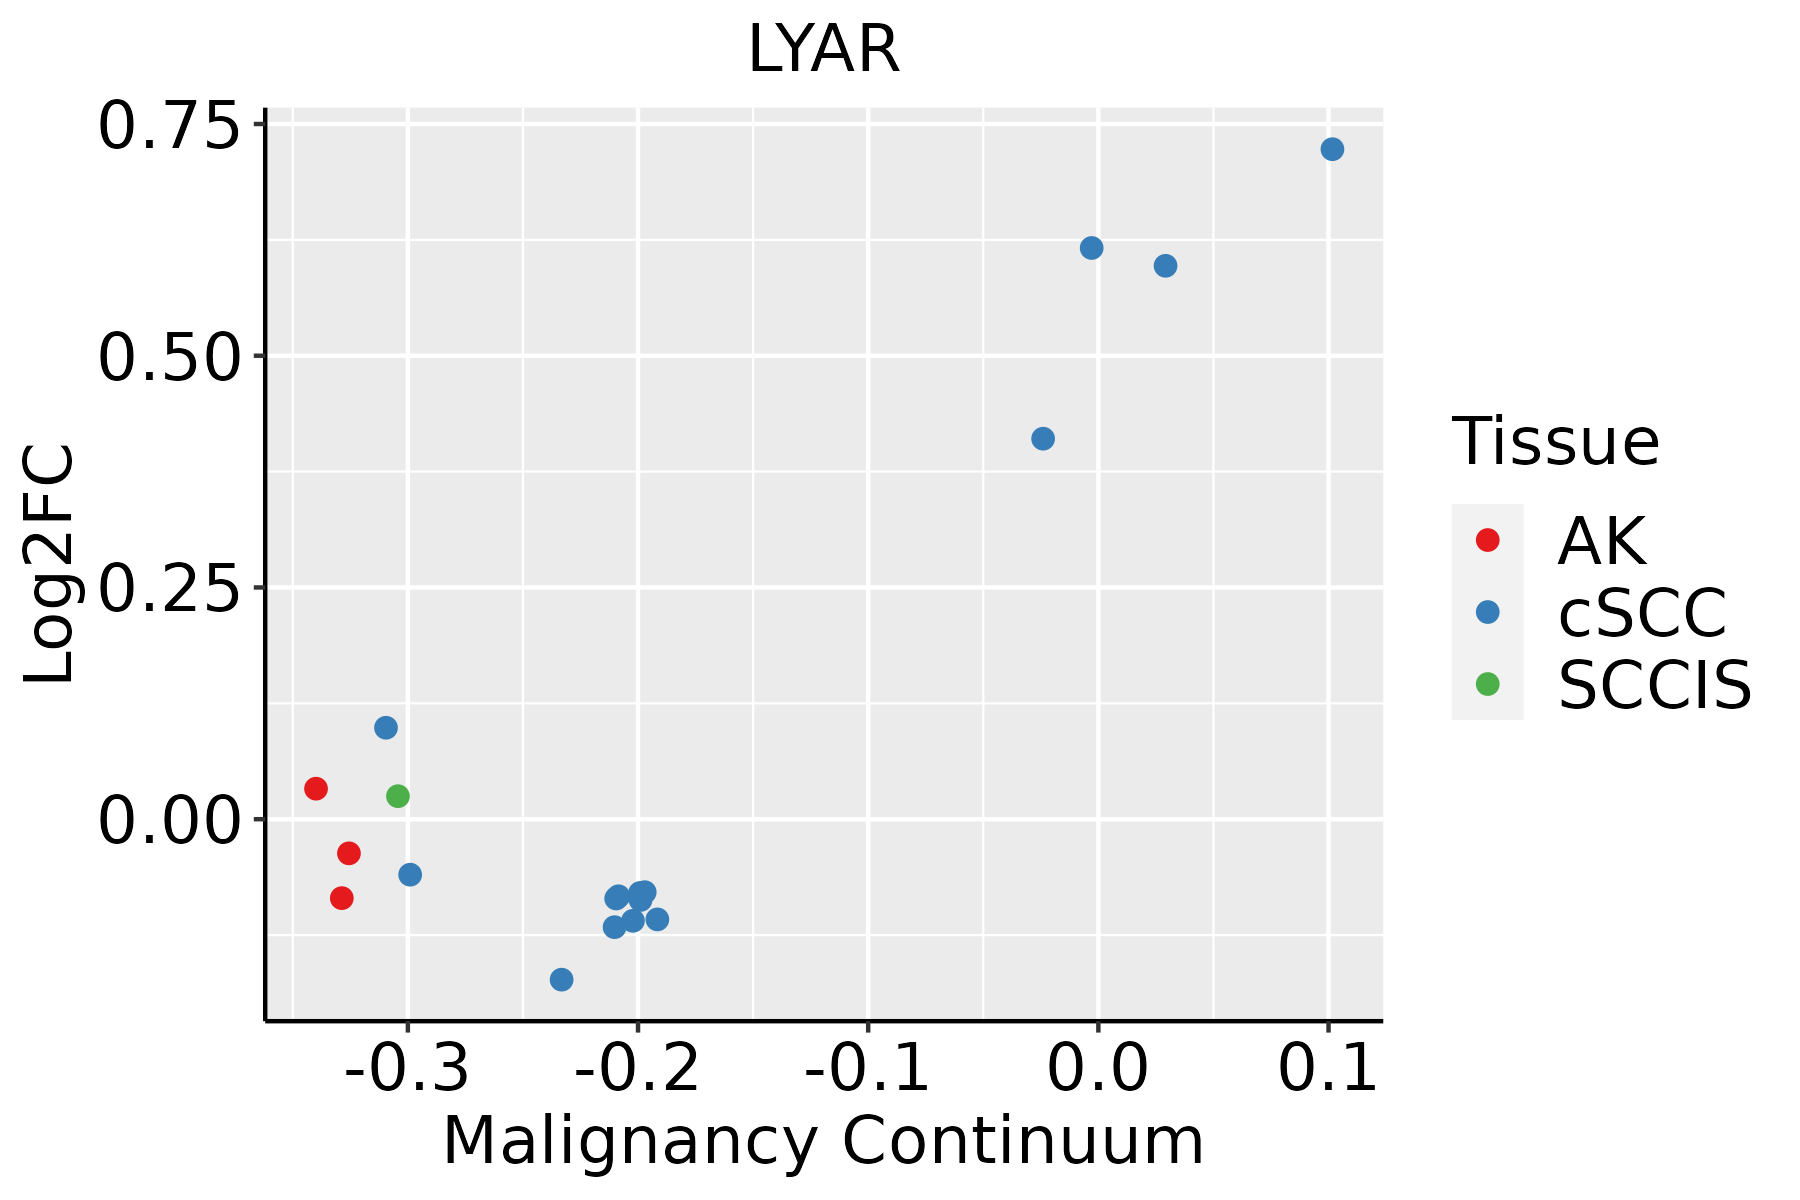 | AK: Actinic keratosis |
| cSCC: Cutaneous squamous cell carcinoma | ||
| SCCIS:squamous cell carcinoma in situ | ||
| Thyroid | 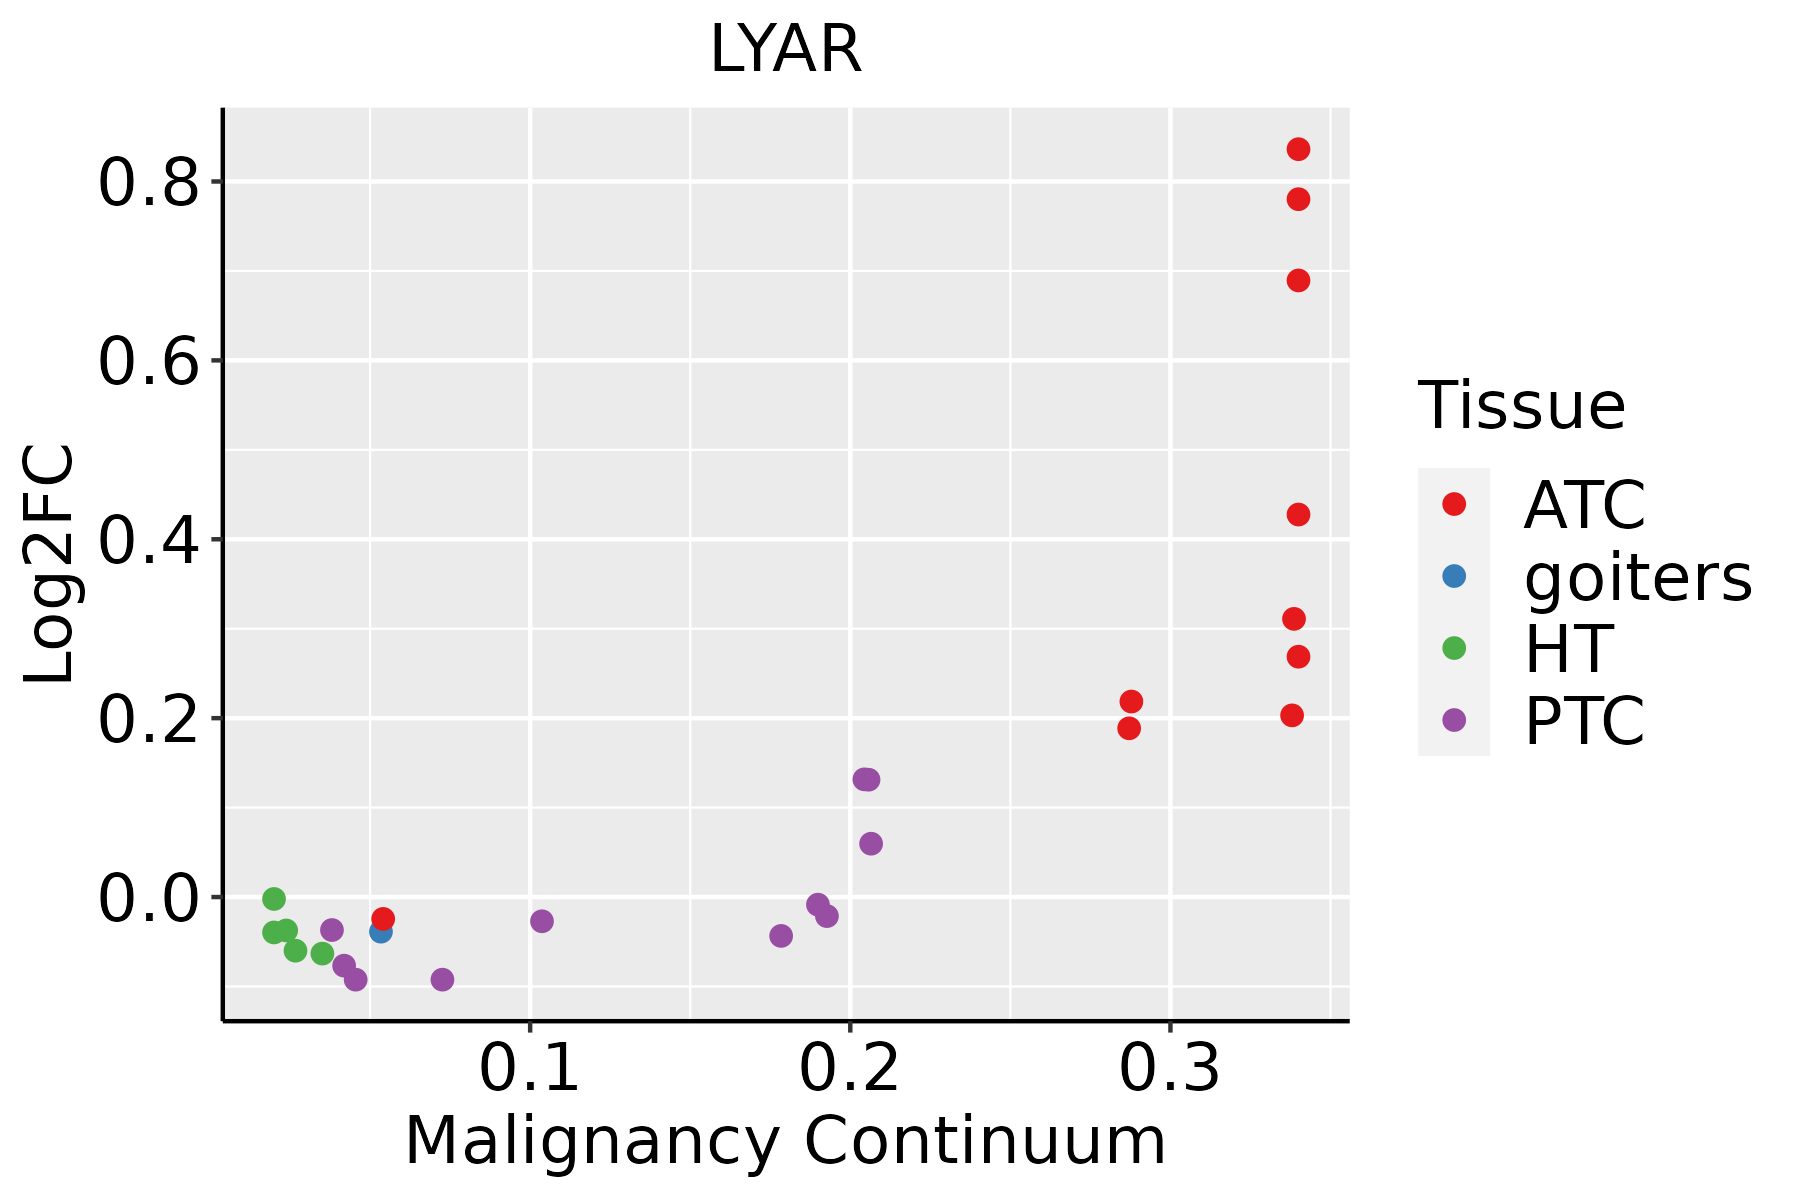 | ATC: Anaplastic thyroid cancer |
| HT: Hashimoto's thyroiditis | ||
| PTC: Papillary thyroid cancer |
| ∗log2FC in expression of this searched gene in stem-like cells from each diseased tissue sample relative to stem-like cells in normal samples in each tissue plotted against the malignancy continuum. Samples are colored based on if they are from different disease stage. |
Top |
Malignant transformation related pathway analysis |
| Find out the enriched GO biological processes and KEGG pathways involved in transition from healthy to precancer to cancer |
| Tissue | Disease Stage | Enriched GO biological Processes |
| Colorectum | AD |  |
| Colorectum | SER |  |
| Colorectum | MSS |  |
| Colorectum | MSI-H |  |
| Colorectum | FAP |  |
| ∗Top 15 enriched GO BP terms are showed in the bar plot of each disease state in each tissue. Each row represents a significant GO biological process which is colored according to the -log10(p.adjust). |
| Page: 1 2 3 4 5 6 7 8 9 |
| GO ID | Tissue | Disease Stage | Description | Gene Ratio | Bg Ratio | pvalue | p.adjust | Count |
| GO:000636424 | Skin | cSCC | rRNA processing | 156/4864 | 225/18723 | 1.42e-42 | 1.48e-39 | 156 |
| GO:001607224 | Skin | cSCC | rRNA metabolic process | 158/4864 | 236/18723 | 4.06e-40 | 2.83e-37 | 158 |
| GO:003447017 | Skin | cSCC | ncRNA processing | 215/4864 | 395/18723 | 6.83e-34 | 4.28e-31 | 215 |
| GO:003466013 | Skin | cSCC | ncRNA metabolic process | 234/4864 | 485/18723 | 1.37e-26 | 4.77e-24 | 234 |
| GO:003009929 | Skin | cSCC | myeloid cell differentiation | 146/4864 | 381/18723 | 6.38e-08 | 1.61e-06 | 146 |
| GO:00063565 | Skin | cSCC | regulation of transcription by RNA polymerase I | 22/4864 | 34/18723 | 2.33e-06 | 3.77e-05 | 22 |
| GO:000226229 | Skin | cSCC | myeloid cell homeostasis | 67/4864 | 157/18723 | 3.79e-06 | 5.70e-05 | 67 |
| GO:004887229 | Skin | cSCC | homeostasis of number of cells | 104/4864 | 272/18723 | 5.34e-06 | 7.71e-05 | 104 |
| GO:003410129 | Skin | cSCC | erythrocyte homeostasis | 57/4864 | 129/18723 | 5.45e-06 | 7.84e-05 | 57 |
| GO:00063603 | Skin | cSCC | transcription by RNA polymerase I | 30/4864 | 55/18723 | 6.13e-06 | 8.70e-05 | 30 |
| GO:003021828 | Skin | cSCC | erythrocyte differentiation | 53/4864 | 120/18723 | 1.16e-05 | 1.50e-04 | 53 |
| GO:00459433 | Skin | cSCC | positive regulation of transcription by RNA polymerase I | 15/4864 | 23/18723 | 8.72e-05 | 8.21e-04 | 15 |
| GO:000283122 | Skin | cSCC | regulation of response to biotic stimulus | 112/4864 | 327/18723 | 5.00e-04 | 3.76e-03 | 112 |
| GO:00028326 | Skin | cSCC | negative regulation of response to biotic stimulus | 43/4864 | 108/18723 | 1.12e-03 | 7.36e-03 | 43 |
| GO:004508812 | Skin | cSCC | regulation of innate immune response | 75/4864 | 218/18723 | 3.40e-03 | 1.84e-02 | 75 |
| GO:00458246 | Skin | cSCC | negative regulation of innate immune response | 28/4864 | 71/18723 | 8.86e-03 | 4.07e-02 | 28 |
| GO:0022613113 | Thyroid | PTC | ribonucleoprotein complex biogenesis | 292/5968 | 463/18723 | 3.24e-44 | 2.05e-40 | 292 |
| GO:0042254113 | Thyroid | PTC | ribosome biogenesis | 202/5968 | 299/18723 | 3.47e-37 | 5.47e-34 | 202 |
| GO:0006364112 | Thyroid | PTC | rRNA processing | 156/5968 | 225/18723 | 5.58e-31 | 5.03e-28 | 156 |
| GO:0016072112 | Thyroid | PTC | rRNA metabolic process | 160/5968 | 236/18723 | 5.68e-30 | 3.58e-27 | 160 |
| Page: 1 2 3 4 5 6 7 |
| Pathway ID | Tissue | Disease Stage | Description | Gene Ratio | Bg Ratio | pvalue | p.adjust | qvalue | Count |
| Page: 1 |
Top |
Cell-cell communication analysis |
| Identification of potential cell-cell interactions between two cell types and their ligand-receptor pairs for different disease states |
| Ligand | Receptor | LRpair | Pathway | Tissue | Disease Stage |
| Page: 1 |
Top |
Single-cell gene regulatory network inference analysis |
| Find out the significant the regulons (TFs) and the target genes of each regulon across cell types for different disease states |
| TF | Cell Type | Tissue | Disease Stage | Target Gene | RSS | Regulon Activity |
| ∗The dot plots of a searched regulon are shown for all cell subpopulations in each disease state of each tissue based on the regulon specific score inferred using pySCENIC and by calculating the average expression. |
| Page: 1 |
Top |
Somatic mutation of malignant transformation related genes |
| Annotation of somatic variants for genes involved in malignant transformation |
| Hugo Symbol | Variant Class | Variant Classification | dbSNP RS | HGVSc | HGVSp | HGVSp Short | SWISSPROT | BIOTYPE | SIFT | PolyPhen | Tumor Sample Barcode | Tissue | Histology | Sex | Age | Stage | Therapy Types | Drugs | Outcome |
| LYAR | SNV | Missense_Mutation | c.572N>C | p.Arg191Thr | p.R191T | Q9NX58 | protein_coding | deleterious(0.01) | possibly_damaging(0.798) | TCGA-AC-A23H-01 | Breast | breast invasive carcinoma | Female | >=65 | I/II | Unknown | Unknown | PD | |
| LYAR | insertion | Nonsense_Mutation | novel | c.250_251insGCTGGTGCCAGCCCAGTATGTAATGATTTGCTTAG | p.Leu84CysfsTer8 | p.L84Cfs*8 | Q9NX58 | protein_coding | TCGA-AO-A0JB-01 | Breast | breast invasive carcinoma | Female | <65 | III/IV | Chemotherapy | cyclophosphamide | SD | ||
| LYAR | SNV | Missense_Mutation | c.35N>T | p.Ser12Leu | p.S12L | Q9NX58 | protein_coding | deleterious(0) | probably_damaging(0.986) | TCGA-AD-6895-01 | Colorectum | colon adenocarcinoma | Male | >=65 | III/IV | Unknown | Unknown | SD | |
| LYAR | SNV | Missense_Mutation | rs757496286 | c.775G>A | p.Ala259Thr | p.A259T | Q9NX58 | protein_coding | tolerated(0.5) | benign(0.011) | TCGA-F4-6856-01 | Colorectum | colon adenocarcinoma | Male | <65 | I/II | Ancillary | leucovorin | CR |
| LYAR | SNV | Missense_Mutation | rs756569454 | c.763N>T | p.Arg255Cys | p.R255C | Q9NX58 | protein_coding | deleterious(0.02) | possibly_damaging(0.799) | TCGA-NH-A5IV-01 | Colorectum | colon adenocarcinoma | Female | >=65 | I/II | Unknown | Unknown | SD |
| LYAR | SNV | Missense_Mutation | c.927C>A | p.Phe309Leu | p.F309L | Q9NX58 | protein_coding | deleterious(0) | probably_damaging(0.997) | TCGA-AG-3892-01 | Colorectum | rectum adenocarcinoma | Female | <65 | I/II | Unknown | Unknown | SD | |
| LYAR | deletion | Frame_Shift_Del | c.12delN | p.Phe4LeufsTer10 | p.F4Lfs*10 | Q9NX58 | protein_coding | TCGA-A6-6780-01 | Colorectum | colon adenocarcinoma | Male | >=65 | I/II | Unknown | Unknown | SD | |||
| LYAR | insertion | Frame_Shift_Ins | novel | c.954_955insGTACATT | p.Leu319ValfsTer10 | p.L319Vfs*10 | Q9NX58 | protein_coding | TCGA-AM-5820-01 | Colorectum | colon adenocarcinoma | Female | <65 | I/II | Unknown | Unknown | SD | ||
| LYAR | deletion | Frame_Shift_Del | c.12delN | p.Phe4LeufsTer10 | p.F4Lfs*10 | Q9NX58 | protein_coding | TCGA-AZ-6598-01 | Colorectum | colon adenocarcinoma | Female | >=65 | I/II | Unknown | Unknown | SD | |||
| LYAR | deletion | Frame_Shift_Del | c.12delN | p.Phe4LeufsTer10 | p.F4Lfs*10 | Q9NX58 | protein_coding | TCGA-G4-6588-01 | Colorectum | colon adenocarcinoma | Female | <65 | I/II | Unknown | Unknown | SD |
| Page: 1 2 3 4 5 6 |
Top |
Related drugs of malignant transformation related genes |
| Identification of chemicals and drugs interact with genes involved in malignant transfromation |
| (DGIdb 4.0) |
| Entrez ID | Symbol | Category | Interaction Types | Drug Claim Name | Drug Name | PMIDs |
| Page: 1 |

Copyright 2023-Present -The University of Texas Health Science Center at Houston |