
|
|||||
|
 | |
| |
| |
| |
| |
| |
|
Gene: LRRC8A |
Gene summary for LRRC8A |
| Gene information | Species | Human | Gene symbol | LRRC8A | Gene ID | 56262 |
| Gene name | leucine rich repeat containing 8 VRAC subunit A | |
| Gene Alias | AGM5 | |
| Cytomap | 9q34.11 | |
| Gene Type | protein-coding | GO ID | GO:0000003 | UniProtAcc | A0A024R892 |
Top |
Malignant transformation analysis |
| Identification of the aberrant gene expression in precancerous and cancerous lesions by comparing the gene expression of stem-like cells in diseased tissues with normal stem cells |
| Entrez ID | Symbol | Replicates | Species | Organ | Tissue | Adj P-value | Log2FC | Malignancy |
| 56262 | LRRC8A | LZE2D | Human | Esophagus | HGIN | 3.20e-02 | -3.10e-01 | 0.0642 |
| 56262 | LRRC8A | LZE4T | Human | Esophagus | ESCC | 2.67e-08 | -2.65e-01 | 0.0811 |
| 56262 | LRRC8A | LZE5T | Human | Esophagus | ESCC | 1.76e-05 | -8.30e-02 | 0.0514 |
| 56262 | LRRC8A | LZE7T | Human | Esophagus | ESCC | 2.47e-04 | 3.24e-02 | 0.0667 |
| 56262 | LRRC8A | LZE22D1 | Human | Esophagus | HGIN | 1.38e-05 | -3.73e-01 | 0.0595 |
| 56262 | LRRC8A | LZE24T | Human | Esophagus | ESCC | 2.18e-05 | 2.77e-01 | 0.0596 |
| 56262 | LRRC8A | P2T-E | Human | Esophagus | ESCC | 4.38e-13 | 1.91e-02 | 0.1177 |
| 56262 | LRRC8A | P4T-E | Human | Esophagus | ESCC | 1.44e-07 | 6.09e-02 | 0.1323 |
| 56262 | LRRC8A | P5T-E | Human | Esophagus | ESCC | 4.42e-14 | -1.81e-01 | 0.1327 |
| 56262 | LRRC8A | P8T-E | Human | Esophagus | ESCC | 1.88e-15 | 2.98e-01 | 0.0889 |
| 56262 | LRRC8A | P9T-E | Human | Esophagus | ESCC | 7.57e-08 | 2.05e-01 | 0.1131 |
| 56262 | LRRC8A | P10T-E | Human | Esophagus | ESCC | 1.79e-11 | 3.23e-01 | 0.116 |
| 56262 | LRRC8A | P12T-E | Human | Esophagus | ESCC | 1.39e-03 | 2.68e-01 | 0.1122 |
| 56262 | LRRC8A | P15T-E | Human | Esophagus | ESCC | 4.03e-15 | 5.87e-01 | 0.1149 |
| 56262 | LRRC8A | P16T-E | Human | Esophagus | ESCC | 6.39e-19 | -4.31e-01 | 0.1153 |
| 56262 | LRRC8A | P17T-E | Human | Esophagus | ESCC | 2.98e-03 | -1.72e-01 | 0.1278 |
| 56262 | LRRC8A | P19T-E | Human | Esophagus | ESCC | 5.76e-09 | -2.28e-01 | 0.1662 |
| 56262 | LRRC8A | P20T-E | Human | Esophagus | ESCC | 1.58e-11 | -1.51e-01 | 0.1124 |
| 56262 | LRRC8A | P21T-E | Human | Esophagus | ESCC | 3.71e-05 | 2.62e-01 | 0.1617 |
| 56262 | LRRC8A | P22T-E | Human | Esophagus | ESCC | 8.20e-09 | -2.73e-02 | 0.1236 |
| Page: 1 2 3 4 5 6 |
| Tissue | Expression Dynamics | Abbreviation |
| Esophagus | 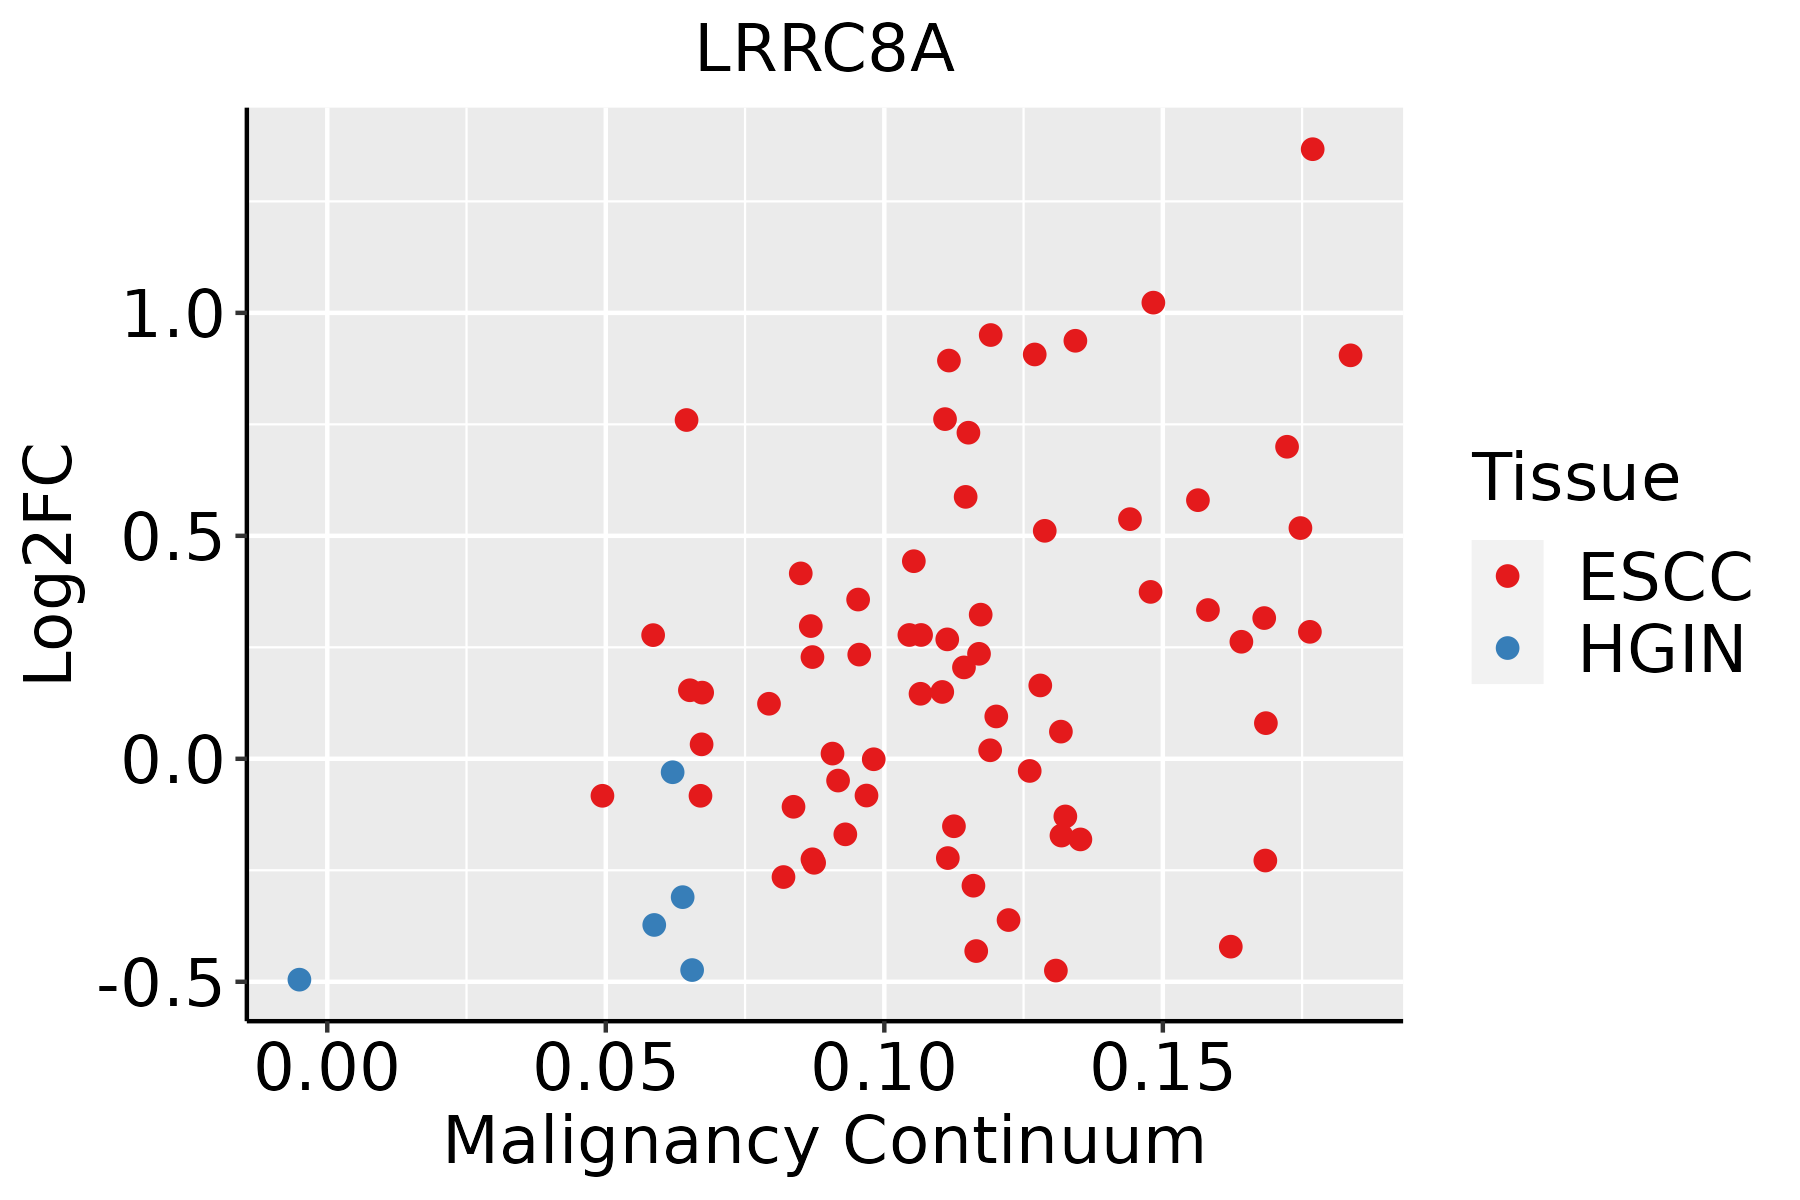 | ESCC: Esophageal squamous cell carcinoma |
| HGIN: High-grade intraepithelial neoplasias | ||
| LGIN: Low-grade intraepithelial neoplasias | ||
| Liver | 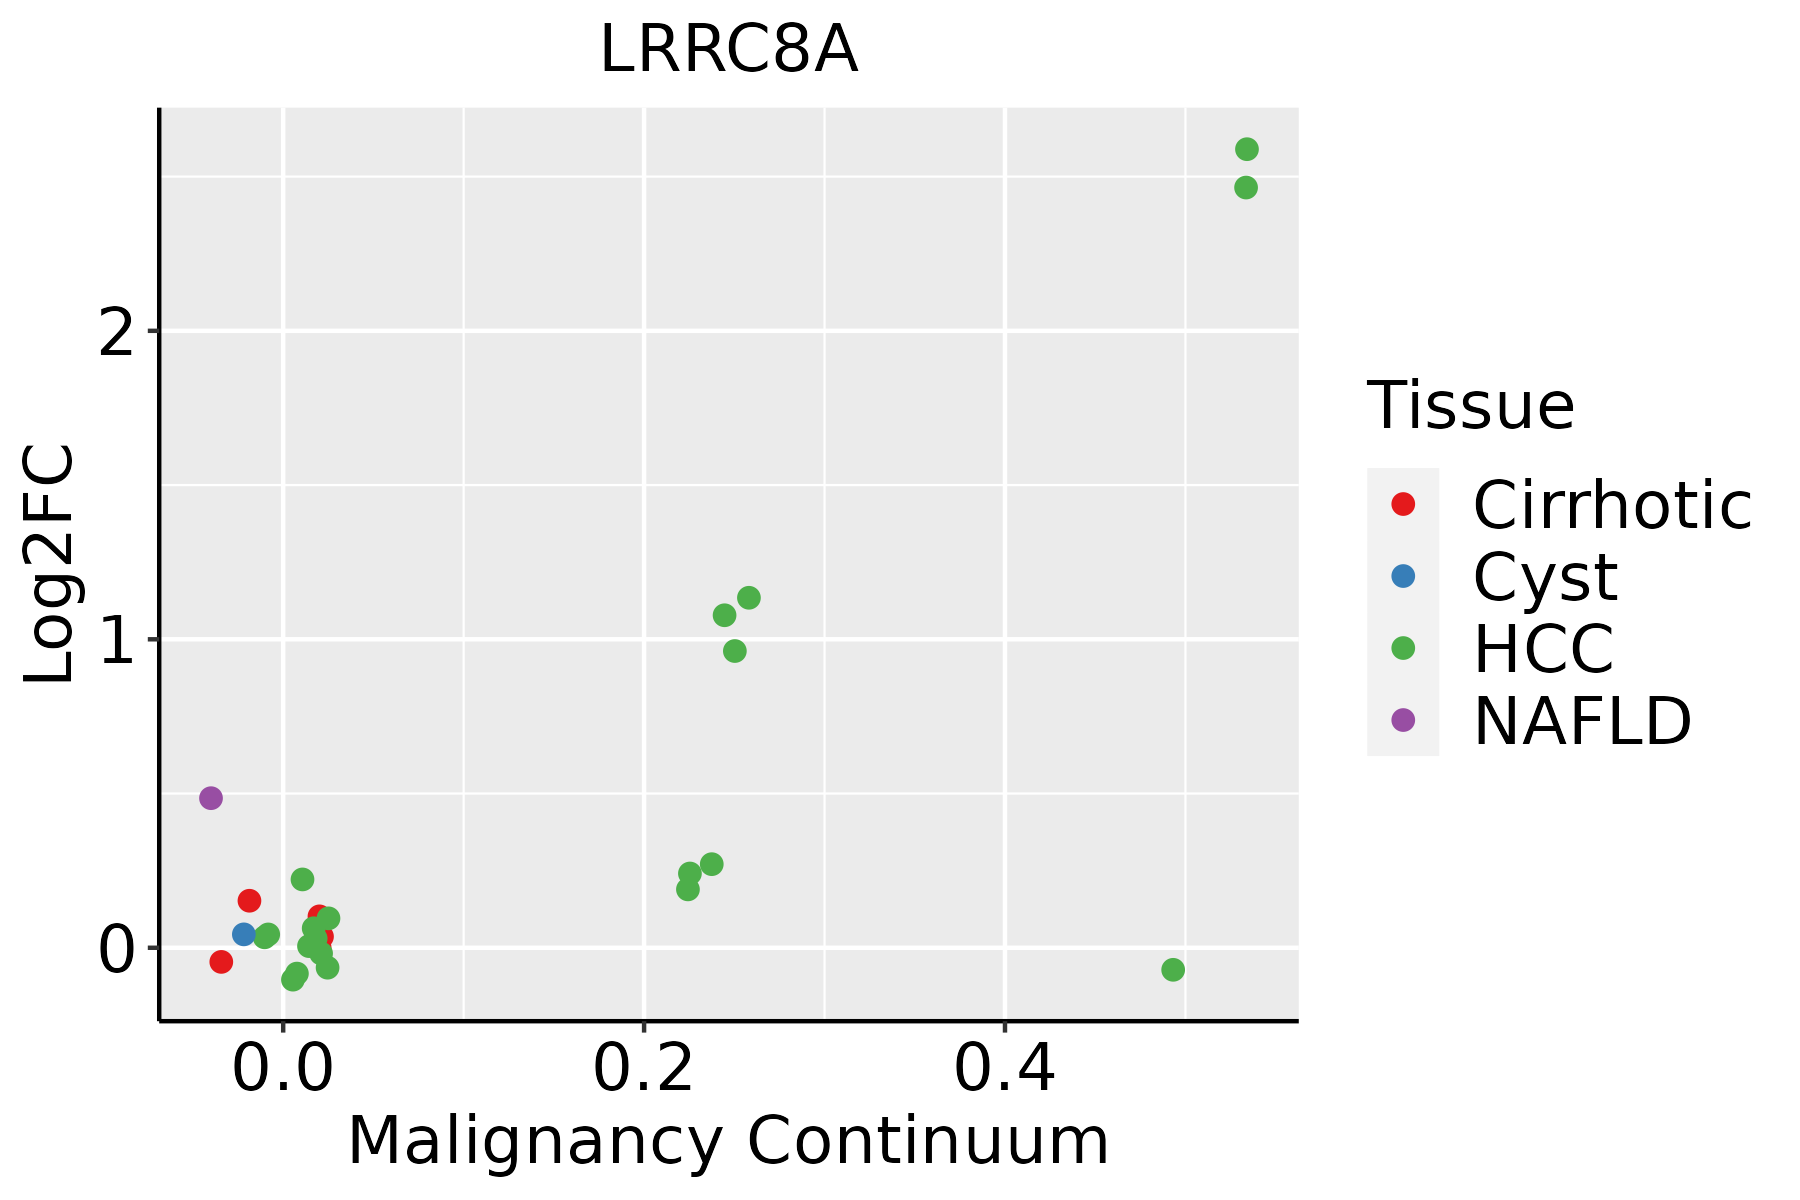 | HCC: Hepatocellular carcinoma |
| NAFLD: Non-alcoholic fatty liver disease | ||
| Oral Cavity | 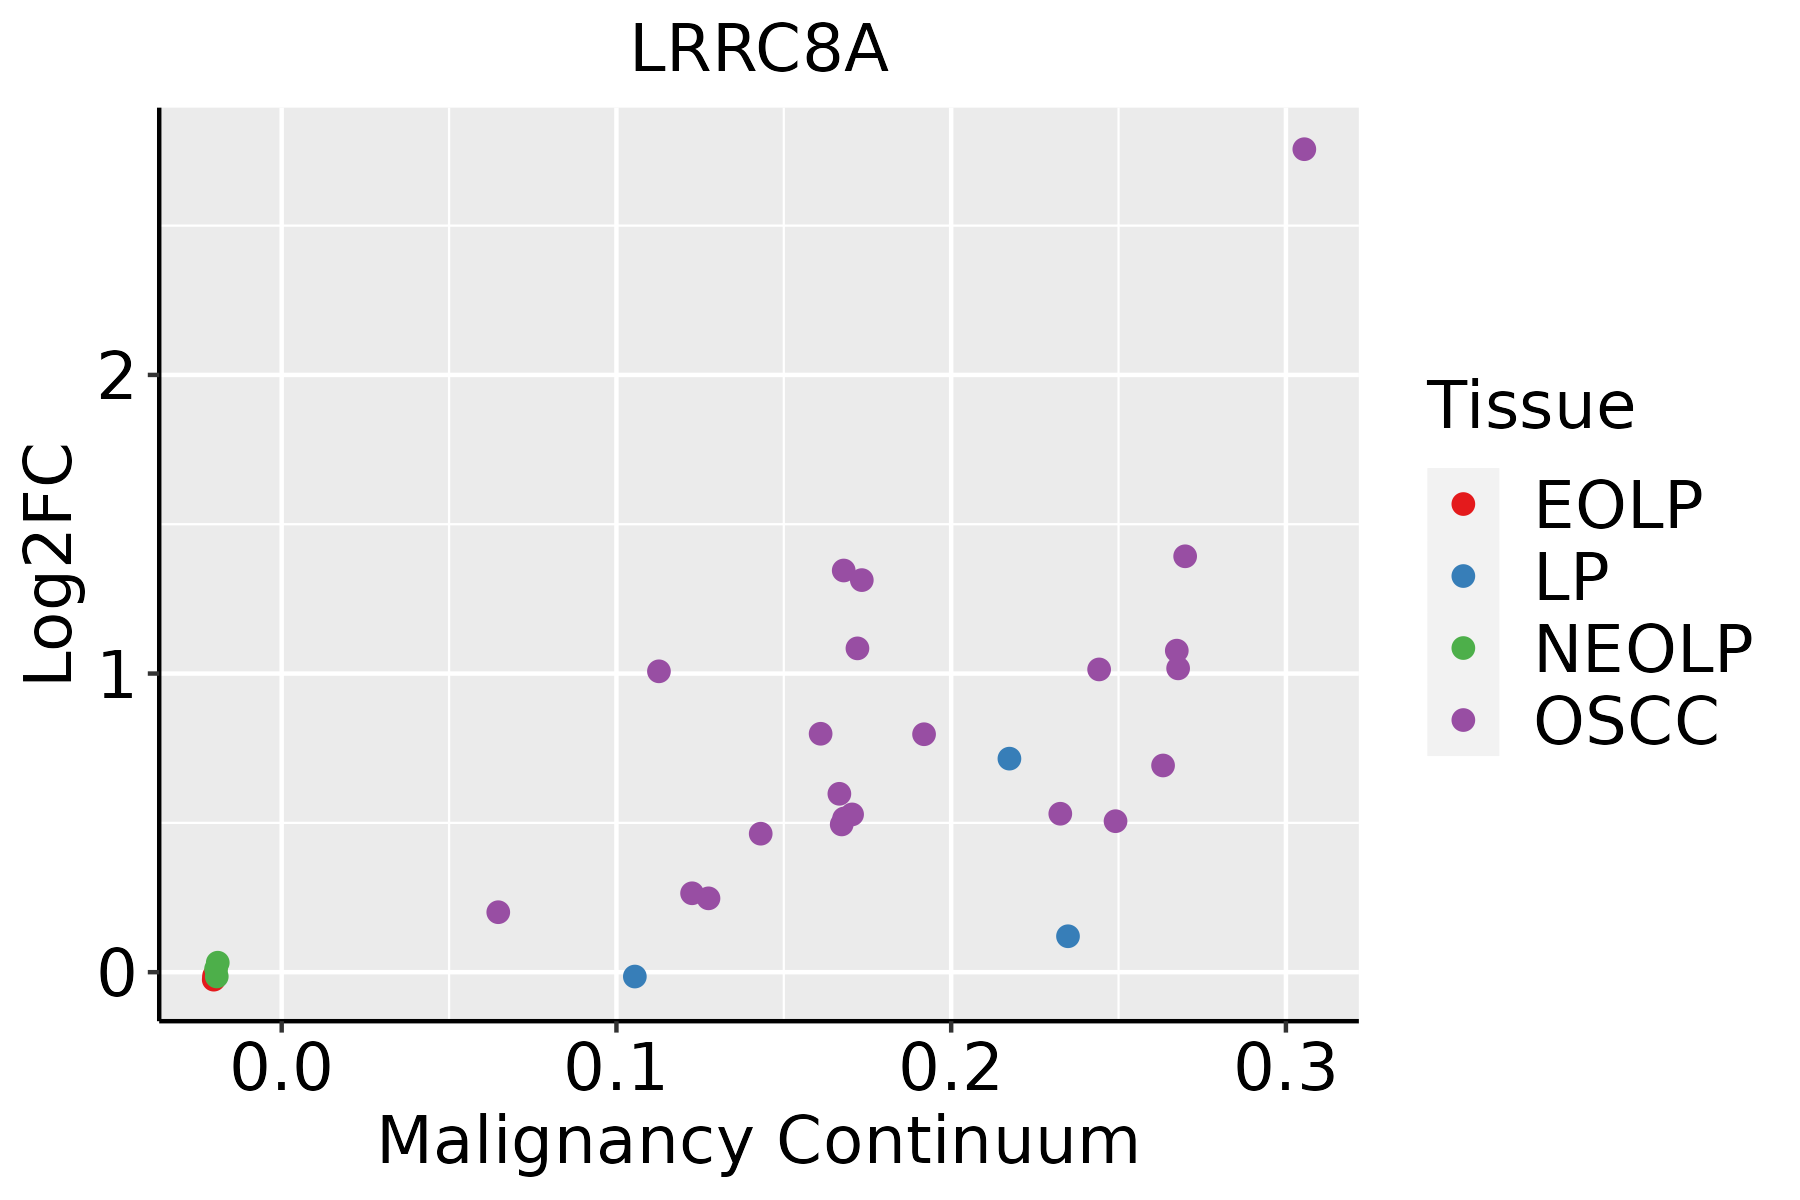 | EOLP: Erosive Oral lichen planus |
| LP: leukoplakia | ||
| NEOLP: Non-erosive oral lichen planus | ||
| OSCC: Oral squamous cell carcinoma | ||
| Thyroid | 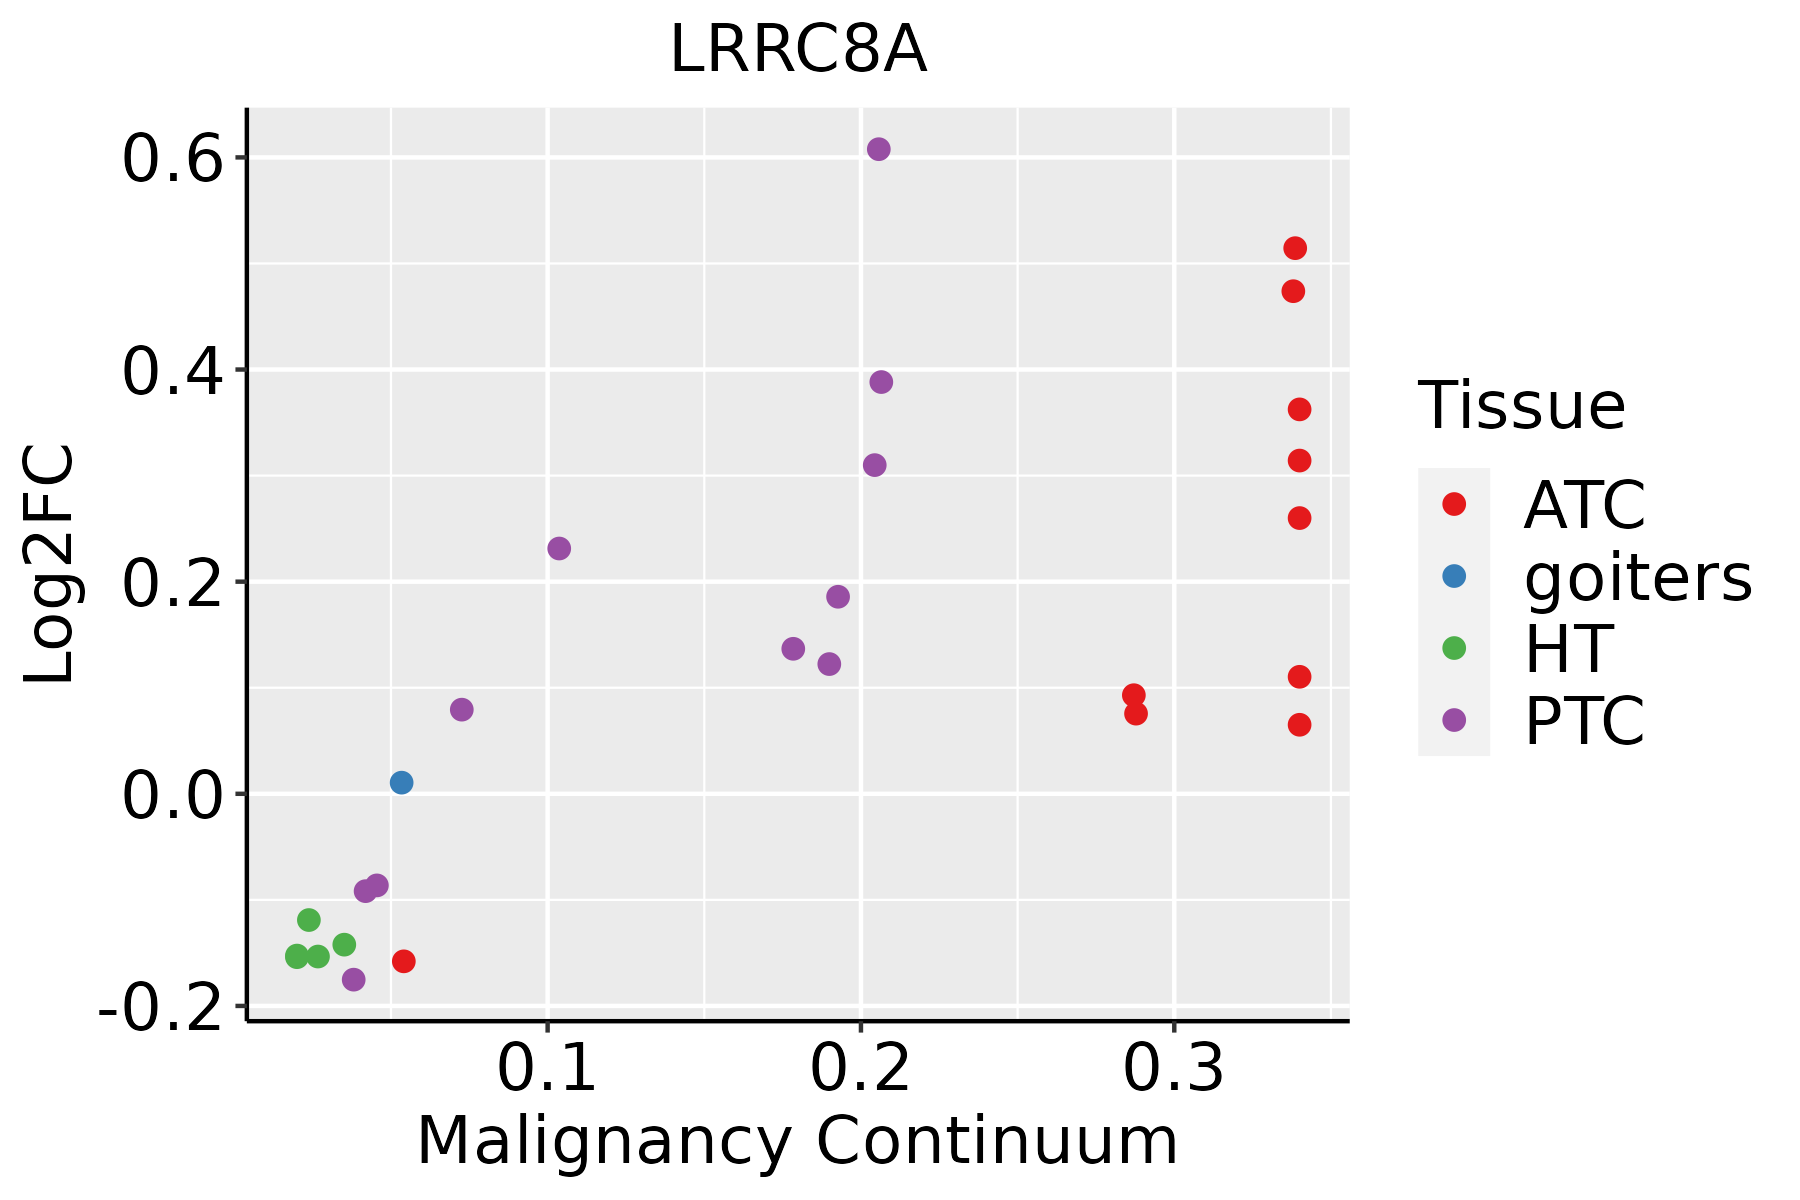 | ATC: Anaplastic thyroid cancer |
| HT: Hashimoto's thyroiditis | ||
| PTC: Papillary thyroid cancer |
| ∗log2FC in expression of this searched gene in stem-like cells from each diseased tissue sample relative to stem-like cells in normal samples in each tissue plotted against the malignancy continuum. Samples are colored based on if they are from different disease stage. |
Top |
Malignant transformation related pathway analysis |
| Find out the enriched GO biological processes and KEGG pathways involved in transition from healthy to precancer to cancer |
| Tissue | Disease Stage | Enriched GO biological Processes |
| Colorectum | AD |  |
| Colorectum | SER |  |
| Colorectum | MSS |  |
| Colorectum | MSI-H |  |
| Colorectum | FAP |  |
| ∗Top 15 enriched GO BP terms are showed in the bar plot of each disease state in each tissue. Each row represents a significant GO biological process which is colored according to the -log10(p.adjust). |
| Page: 1 2 3 4 5 6 7 8 9 |
| GO ID | Tissue | Disease Stage | Description | Gene Ratio | Bg Ratio | pvalue | p.adjust | Count |
| GO:0042593110 | Thyroid | PTC | glucose homeostasis | 102/5968 | 258/18723 | 5.34e-03 | 2.46e-02 | 102 |
| GO:007169216 | Thyroid | PTC | protein localization to extracellular region | 139/5968 | 368/18723 | 8.95e-03 | 3.72e-02 | 139 |
| GO:000930618 | Thyroid | PTC | protein secretion | 135/5968 | 359/18723 | 1.16e-02 | 4.58e-02 | 135 |
| GO:003559218 | Thyroid | PTC | establishment of protein localization to extracellular region | 135/5968 | 360/18723 | 1.28e-02 | 4.95e-02 | 135 |
| GO:190495128 | Thyroid | ATC | positive regulation of establishment of protein localization | 177/6293 | 319/18723 | 5.43e-16 | 4.29e-14 | 177 |
| GO:005122234 | Thyroid | ATC | positive regulation of protein transport | 165/6293 | 303/18723 | 4.94e-14 | 2.69e-12 | 165 |
| GO:003253526 | Thyroid | ATC | regulation of cellular component size | 191/6293 | 383/18723 | 2.51e-11 | 8.69e-10 | 191 |
| GO:001593122 | Thyroid | ATC | nucleobase-containing compound transport | 122/6293 | 222/18723 | 4.30e-11 | 1.41e-09 | 122 |
| GO:000836122 | Thyroid | ATC | regulation of cell size | 89/6293 | 181/18723 | 1.01e-05 | 1.00e-04 | 89 |
| GO:000697016 | Thyroid | ATC | response to osmotic stress | 45/6293 | 84/18723 | 1.27e-04 | 9.03e-04 | 45 |
| GO:007169223 | Thyroid | ATC | protein localization to extracellular region | 150/6293 | 368/18723 | 2.25e-03 | 1.05e-02 | 150 |
| GO:003350024 | Thyroid | ATC | carbohydrate homeostasis | 109/6293 | 259/18723 | 2.56e-03 | 1.18e-02 | 109 |
| GO:000930623 | Thyroid | ATC | protein secretion | 146/6293 | 359/18723 | 2.83e-03 | 1.29e-02 | 146 |
| GO:003559223 | Thyroid | ATC | establishment of protein localization to extracellular region | 146/6293 | 360/18723 | 3.20e-03 | 1.44e-02 | 146 |
| GO:004259325 | Thyroid | ATC | glucose homeostasis | 108/6293 | 258/18723 | 3.27e-03 | 1.47e-02 | 108 |
| GO:000167825 | Thyroid | ATC | cellular glucose homeostasis | 75/6293 | 172/18723 | 3.89e-03 | 1.69e-02 | 75 |
| GO:005070815 | Thyroid | ATC | regulation of protein secretion | 109/6293 | 268/18723 | 8.87e-03 | 3.36e-02 | 109 |
| Page: 1 2 3 4 5 |
| Pathway ID | Tissue | Disease Stage | Description | Gene Ratio | Bg Ratio | pvalue | p.adjust | qvalue | Count |
| Page: 1 |
Top |
Cell-cell communication analysis |
| Identification of potential cell-cell interactions between two cell types and their ligand-receptor pairs for different disease states |
| Ligand | Receptor | LRpair | Pathway | Tissue | Disease Stage |
| Page: 1 |
Top |
Single-cell gene regulatory network inference analysis |
| Find out the significant the regulons (TFs) and the target genes of each regulon across cell types for different disease states |
| TF | Cell Type | Tissue | Disease Stage | Target Gene | RSS | Regulon Activity |
| ∗The dot plots of a searched regulon are shown for all cell subpopulations in each disease state of each tissue based on the regulon specific score inferred using pySCENIC and by calculating the average expression. |
| Page: 1 |
Top |
Somatic mutation of malignant transformation related genes |
| Annotation of somatic variants for genes involved in malignant transformation |
| Hugo Symbol | Variant Class | Variant Classification | dbSNP RS | HGVSc | HGVSp | HGVSp Short | SWISSPROT | BIOTYPE | SIFT | PolyPhen | Tumor Sample Barcode | Tissue | Histology | Sex | Age | Stage | Therapy Types | Drugs | Outcome |
| LRRC8A | SNV | Missense_Mutation | novel | c.706N>A | p.Glu236Lys | p.E236K | Q8IWT6 | protein_coding | deleterious(0) | probably_damaging(0.993) | TCGA-3C-AALI-01 | Breast | breast invasive carcinoma | Female | <65 | I/II | Unspecific | Poly E | Complete Response |
| LRRC8A | SNV | Missense_Mutation | c.1826C>G | p.Ser609Cys | p.S609C | Q8IWT6 | protein_coding | deleterious(0) | probably_damaging(0.999) | TCGA-A1-A0SH-01 | Breast | breast invasive carcinoma | Female | <65 | I/II | Chemotherapy | tc | SD | |
| LRRC8A | SNV | Missense_Mutation | novel | c.1346A>G | p.Glu449Gly | p.E449G | Q8IWT6 | protein_coding | deleterious(0) | possibly_damaging(0.787) | TCGA-AO-A128-01 | Breast | breast invasive carcinoma | Female | <65 | I/II | Chemotherapy | doxorubicin | SD |
| LRRC8A | SNV | Missense_Mutation | c.1784A>C | p.Glu595Ala | p.E595A | Q8IWT6 | protein_coding | tolerated(0.18) | benign(0.195) | TCGA-AO-A128-01 | Breast | breast invasive carcinoma | Female | <65 | I/II | Chemotherapy | doxorubicin | SD | |
| LRRC8A | SNV | Missense_Mutation | c.1789N>C | p.Glu597Gln | p.E597Q | Q8IWT6 | protein_coding | deleterious(0) | benign(0.209) | TCGA-AR-A1AO-01 | Breast | breast invasive carcinoma | Female | <65 | I/II | Chemotherapy | doxorubicin | SD | |
| LRRC8A | insertion | Frame_Shift_Ins | novel | c.402_403insTTTT | p.Ile135PhefsTer70 | p.I135Ffs*70 | Q8IWT6 | protein_coding | TCGA-A8-A06Q-01 | Breast | breast invasive carcinoma | Female | <65 | III/IV | Unknown | Unknown | SD | ||
| LRRC8A | insertion | Frame_Shift_Ins | novel | c.403_404insGGCTGAGACTGAGGTTT | p.Ile135ArgfsTer33 | p.I135Rfs*33 | Q8IWT6 | protein_coding | TCGA-A8-A06Q-01 | Breast | breast invasive carcinoma | Female | <65 | III/IV | Unknown | Unknown | SD | ||
| LRRC8A | insertion | Frame_Shift_Ins | novel | c.110_111insTCCCA | p.Met37IlefsTer18 | p.M37Ifs*18 | Q8IWT6 | protein_coding | TCGA-BH-A0HX-01 | Breast | breast invasive carcinoma | Female | <65 | I/II | Chemotherapy | adrimycin | SD | ||
| LRRC8A | insertion | Nonsense_Mutation | novel | c.111_112insTGAACTGGGAGTTTTAAATGTGTCCCTCTGGTCA | p.Ile38Ter | p.I38* | Q8IWT6 | protein_coding | TCGA-BH-A0HX-01 | Breast | breast invasive carcinoma | Female | <65 | I/II | Chemotherapy | adrimycin | SD | ||
| LRRC8A | SNV | Missense_Mutation | c.1416N>T | p.Lys472Asn | p.K472N | Q8IWT6 | protein_coding | deleterious(0.01) | benign(0.006) | TCGA-C5-A7UE-01 | Cervix | cervical & endocervical cancer | Female | <65 | I/II | Chemotherapy | cisplatin | SD |
| Page: 1 2 3 4 5 6 7 8 9 10 |
Top |
Related drugs of malignant transformation related genes |
| Identification of chemicals and drugs interact with genes involved in malignant transfromation |
| (DGIdb 4.0) |
| Entrez ID | Symbol | Category | Interaction Types | Drug Claim Name | Drug Name | PMIDs |
| Page: 1 |

Copyright 2023-Present -The University of Texas Health Science Center at Houston |