
|
|||||
|
 | |
| |
| |
| |
| |
| |
|
Gene: KLF9 |
Gene summary for KLF9 |
| Gene information | Species | Human | Gene symbol | KLF9 | Gene ID | 687 |
| Gene name | Kruppel like factor 9 | |
| Gene Alias | BTEB | |
| Cytomap | 9q21.12 | |
| Gene Type | protein-coding | GO ID | GO:0006139 | UniProtAcc | A0A024R260 |
Top |
Malignant transformation analysis |
| Identification of the aberrant gene expression in precancerous and cancerous lesions by comparing the gene expression of stem-like cells in diseased tissues with normal stem cells |
| Entrez ID | Symbol | Replicates | Species | Organ | Tissue | Adj P-value | Log2FC | Malignancy |
| 687 | KLF9 | LZE24T | Human | Esophagus | ESCC | 2.62e-14 | 5.41e-01 | 0.0596 |
| 687 | KLF9 | P1T-E | Human | Esophagus | ESCC | 1.08e-04 | 7.06e-02 | 0.0875 |
| 687 | KLF9 | P2T-E | Human | Esophagus | ESCC | 9.78e-19 | 3.27e-01 | 0.1177 |
| 687 | KLF9 | P4T-E | Human | Esophagus | ESCC | 2.33e-04 | 1.38e-01 | 0.1323 |
| 687 | KLF9 | P5T-E | Human | Esophagus | ESCC | 1.18e-04 | -1.13e-01 | 0.1327 |
| 687 | KLF9 | P8T-E | Human | Esophagus | ESCC | 2.81e-08 | 1.04e-01 | 0.0889 |
| 687 | KLF9 | P9T-E | Human | Esophagus | ESCC | 3.33e-03 | 1.37e-01 | 0.1131 |
| 687 | KLF9 | P10T-E | Human | Esophagus | ESCC | 1.67e-13 | -8.39e-02 | 0.116 |
| 687 | KLF9 | P11T-E | Human | Esophagus | ESCC | 3.55e-07 | 3.65e-01 | 0.1426 |
| 687 | KLF9 | P12T-E | Human | Esophagus | ESCC | 6.53e-22 | 4.66e-01 | 0.1122 |
| 687 | KLF9 | P16T-E | Human | Esophagus | ESCC | 1.75e-11 | -6.37e-02 | 0.1153 |
| 687 | KLF9 | P19T-E | Human | Esophagus | ESCC | 2.67e-02 | 5.70e-01 | 0.1662 |
| 687 | KLF9 | P20T-E | Human | Esophagus | ESCC | 3.31e-03 | 1.21e-01 | 0.1124 |
| 687 | KLF9 | P23T-E | Human | Esophagus | ESCC | 4.36e-09 | 3.99e-01 | 0.108 |
| 687 | KLF9 | P24T-E | Human | Esophagus | ESCC | 9.50e-12 | 1.38e-01 | 0.1287 |
| 687 | KLF9 | P26T-E | Human | Esophagus | ESCC | 1.11e-19 | 1.51e-01 | 0.1276 |
| 687 | KLF9 | P27T-E | Human | Esophagus | ESCC | 4.35e-22 | 2.92e-01 | 0.1055 |
| 687 | KLF9 | P28T-E | Human | Esophagus | ESCC | 3.49e-06 | 1.04e-02 | 0.1149 |
| 687 | KLF9 | P30T-E | Human | Esophagus | ESCC | 2.81e-04 | 5.58e-01 | 0.137 |
| 687 | KLF9 | P32T-E | Human | Esophagus | ESCC | 1.98e-09 | 1.29e-01 | 0.1666 |
| Page: 1 2 3 4 5 |
| Tissue | Expression Dynamics | Abbreviation |
| Esophagus | 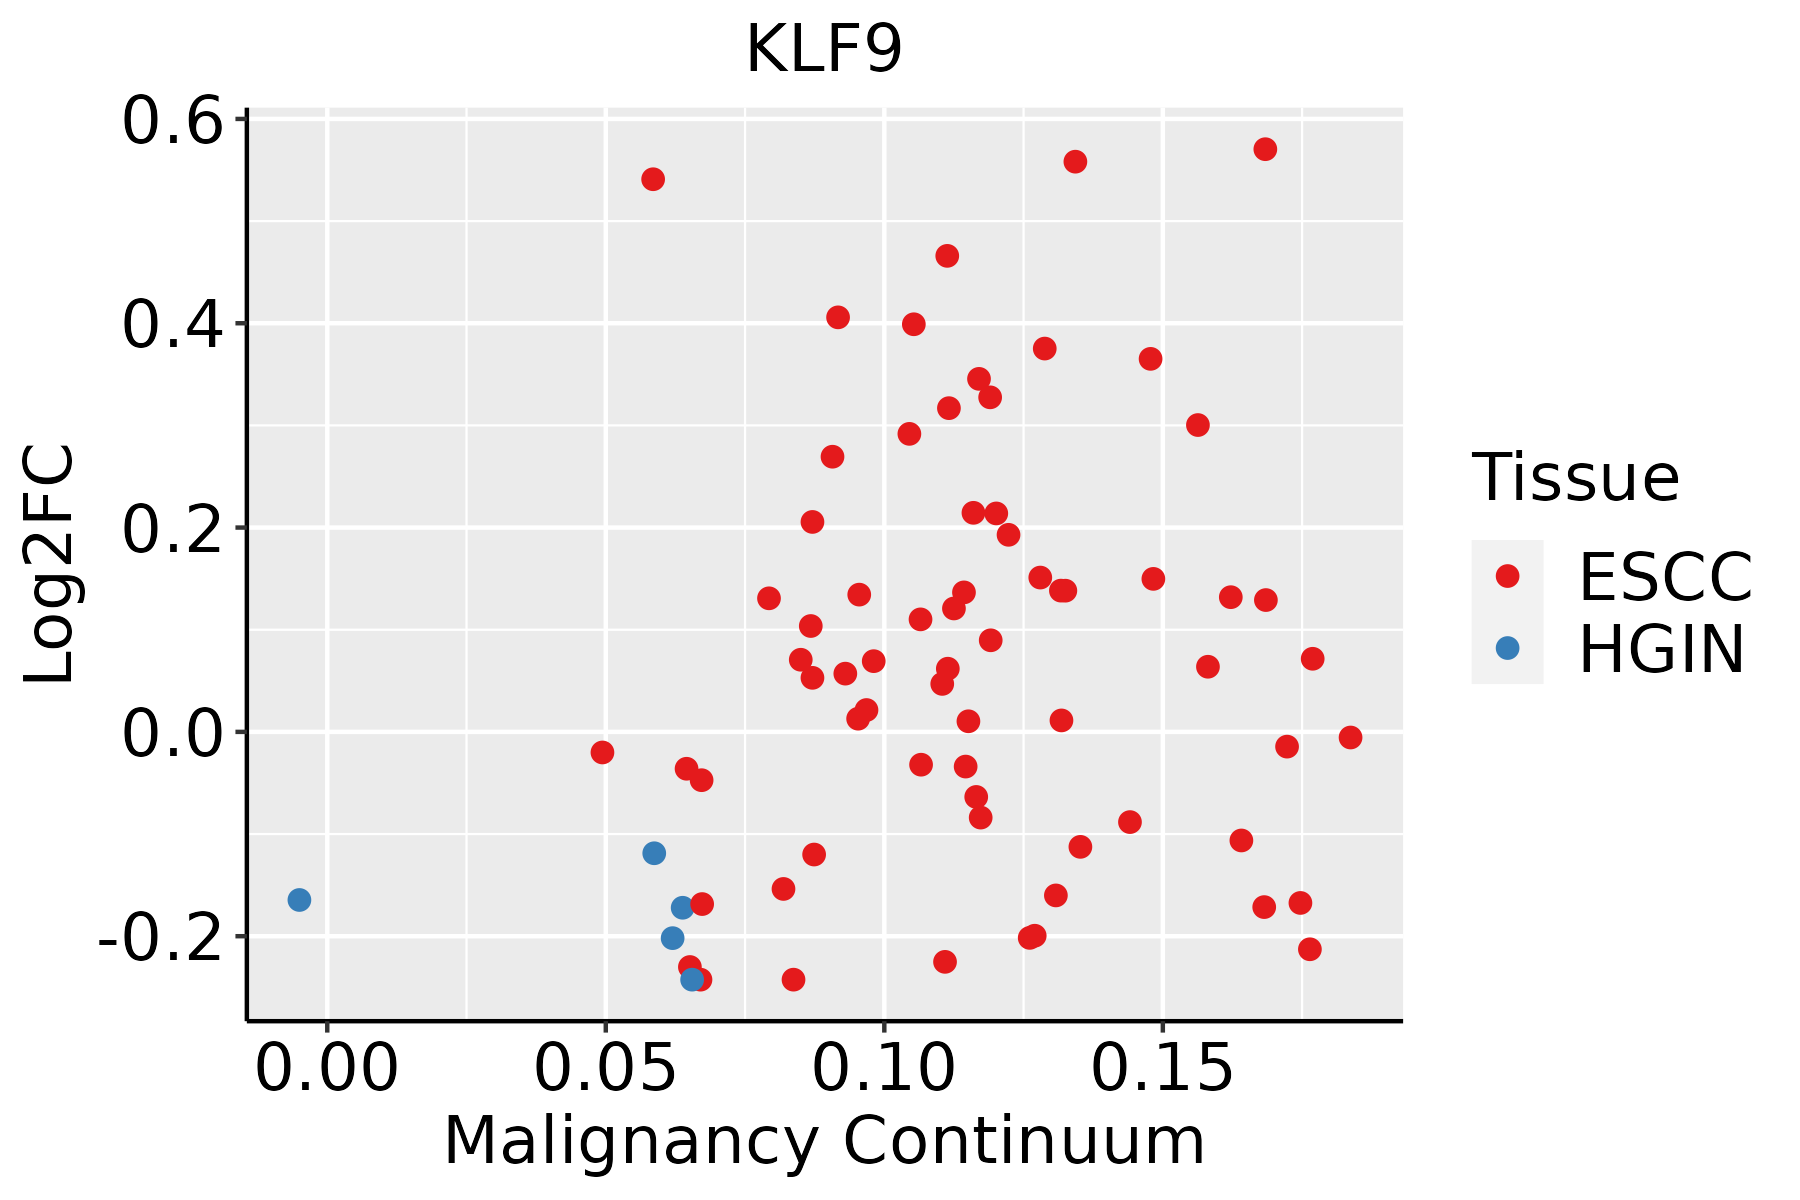 | ESCC: Esophageal squamous cell carcinoma |
| HGIN: High-grade intraepithelial neoplasias | ||
| LGIN: Low-grade intraepithelial neoplasias | ||
| Liver | 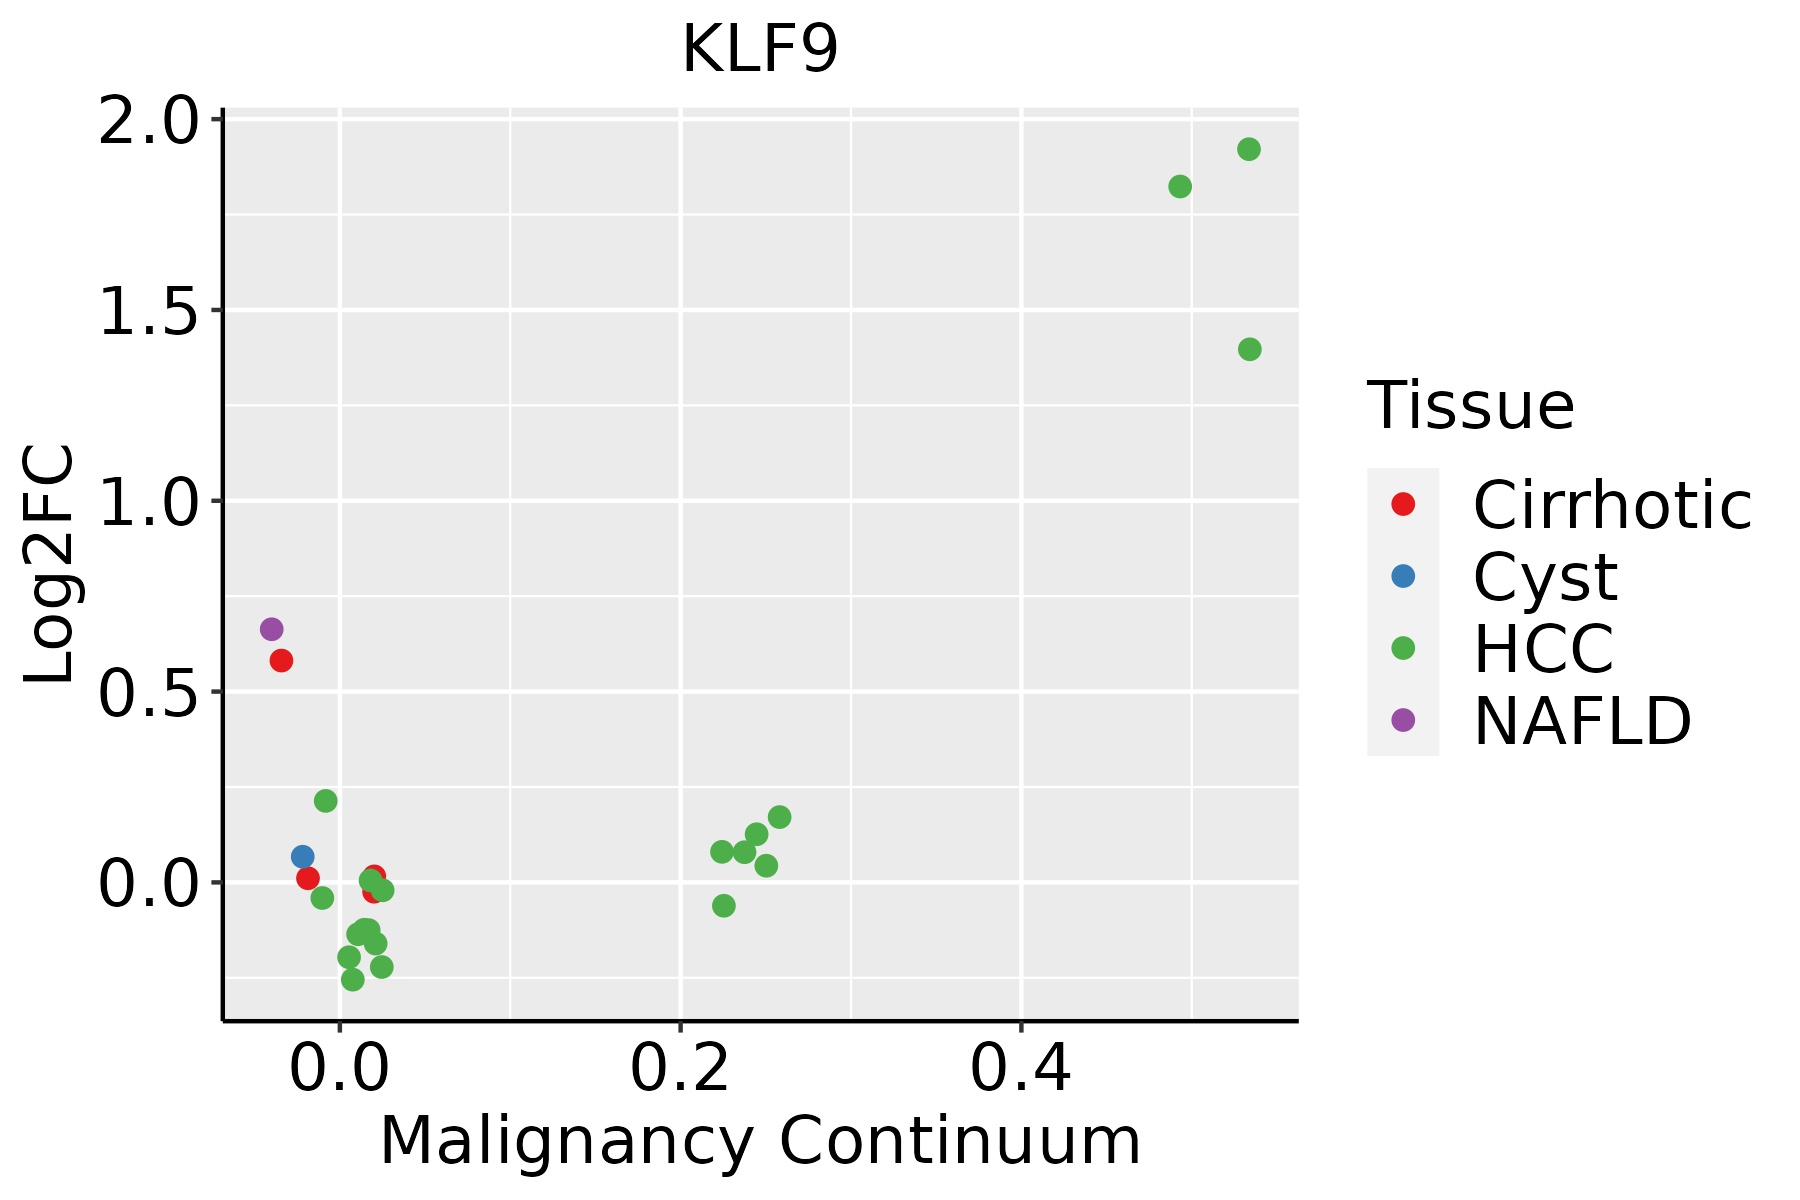 | HCC: Hepatocellular carcinoma |
| NAFLD: Non-alcoholic fatty liver disease | ||
| Prostate | 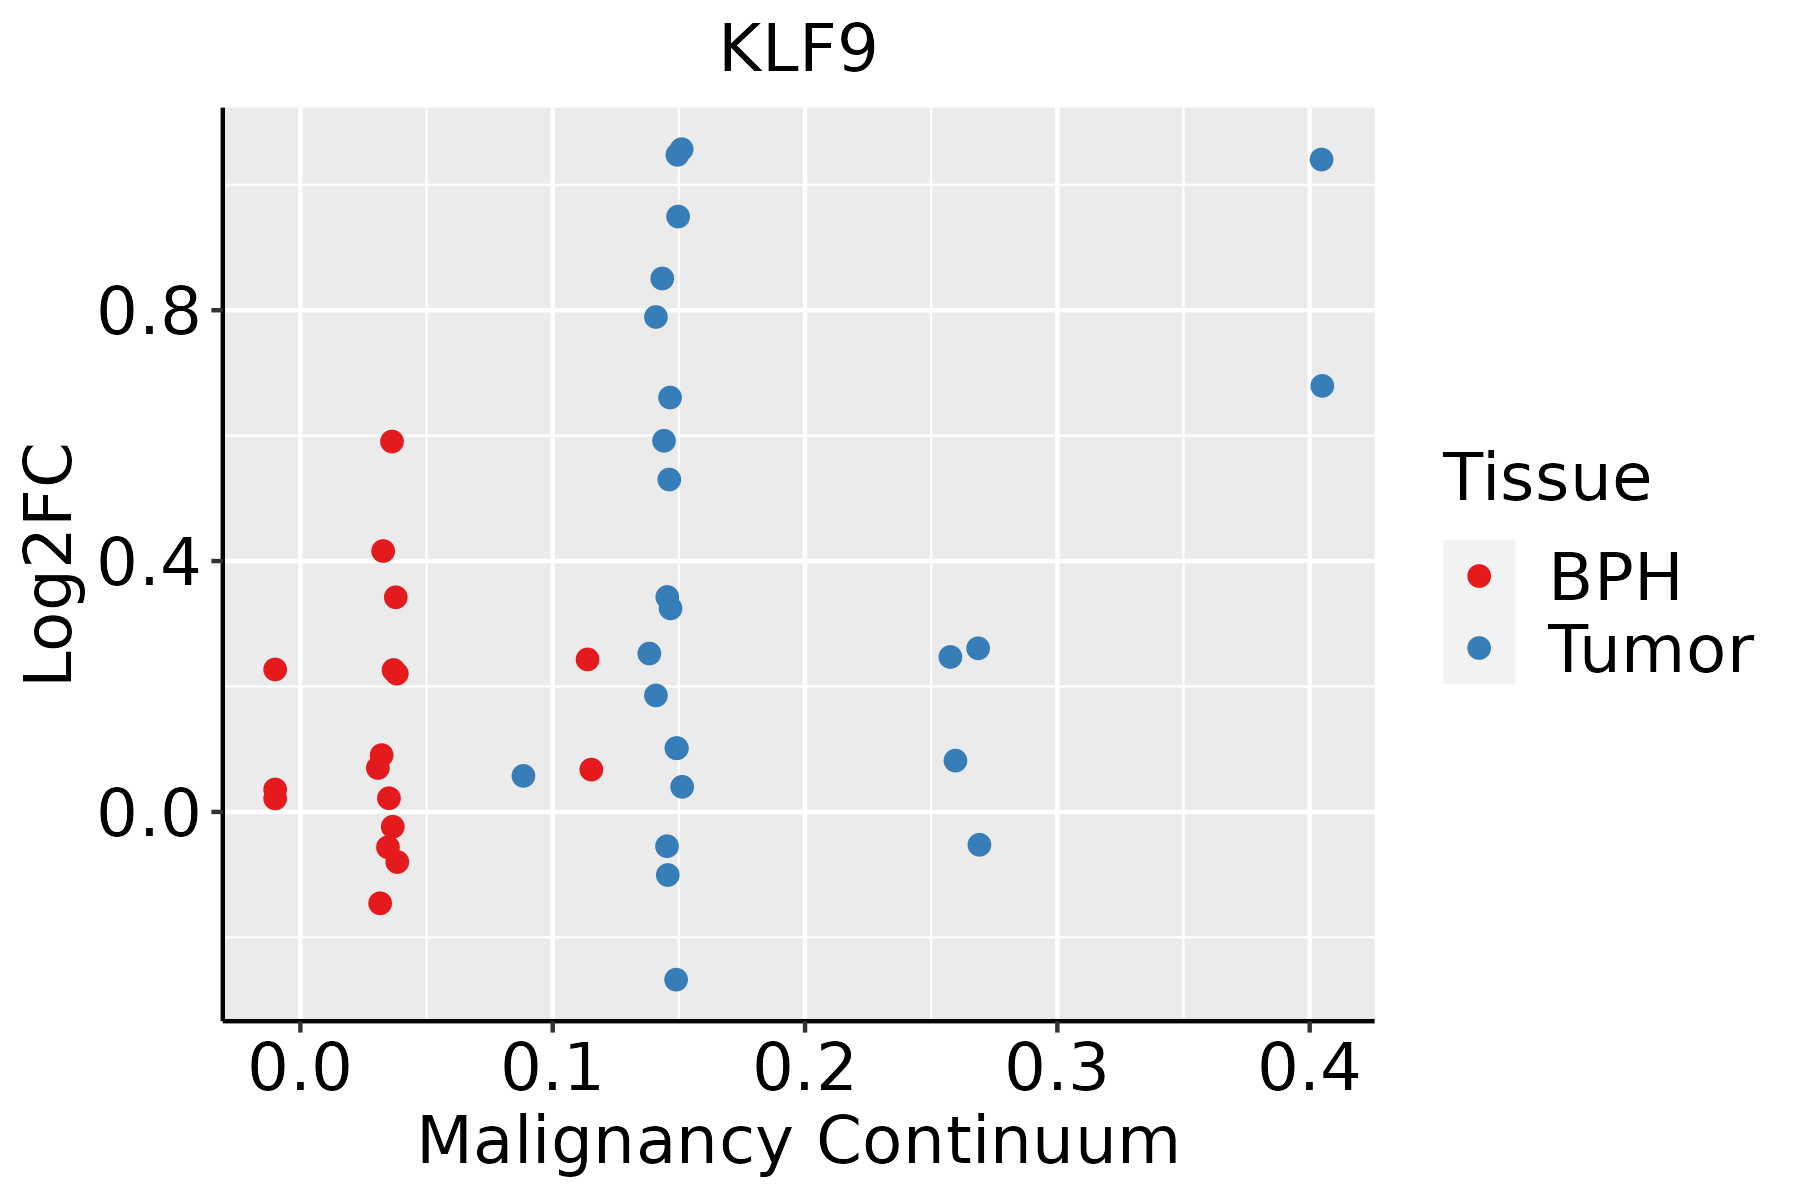 | BPH: Benign Prostatic Hyperplasia |
| Thyroid | 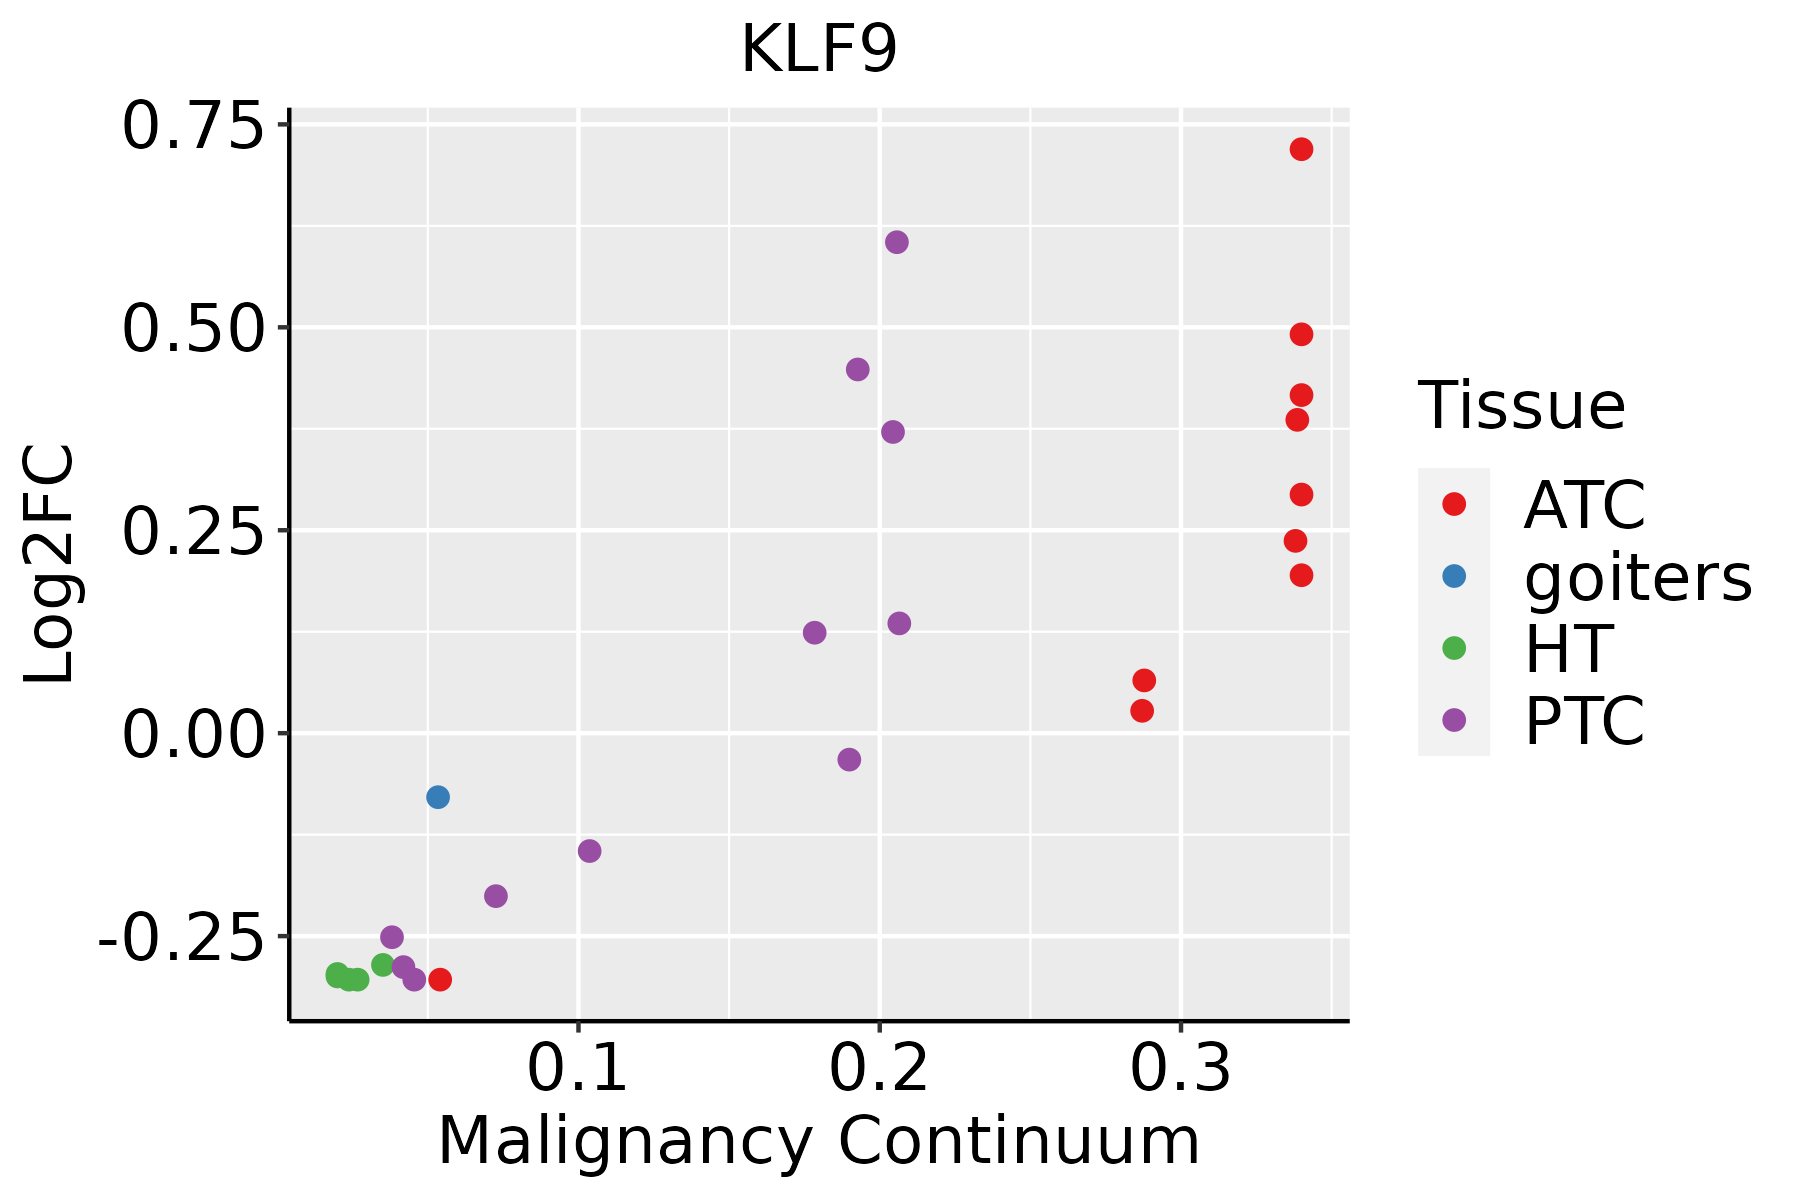 | ATC: Anaplastic thyroid cancer |
| HT: Hashimoto's thyroiditis | ||
| PTC: Papillary thyroid cancer |
| ∗log2FC in expression of this searched gene in stem-like cells from each diseased tissue sample relative to stem-like cells in normal samples in each tissue plotted against the malignancy continuum. Samples are colored based on if they are from different disease stage. |
Top |
Malignant transformation related pathway analysis |
| Find out the enriched GO biological processes and KEGG pathways involved in transition from healthy to precancer to cancer |
| Tissue | Disease Stage | Enriched GO biological Processes |
| Colorectum | AD |  |
| Colorectum | SER |  |
| Colorectum | MSS |  |
| Colorectum | MSI-H |  |
| Colorectum | FAP |  |
| ∗Top 15 enriched GO BP terms are showed in the bar plot of each disease state in each tissue. Each row represents a significant GO biological process which is colored according to the -log10(p.adjust). |
| Page: 1 2 3 4 5 6 7 8 9 |
| GO ID | Tissue | Disease Stage | Description | Gene Ratio | Bg Ratio | pvalue | p.adjust | Count |
| GO:009730518 | Prostate | Tumor | response to alcohol | 68/3246 | 253/18723 | 9.02e-05 | 8.88e-04 | 68 |
| GO:001083714 | Prostate | Tumor | regulation of keratinocyte proliferation | 15/3246 | 35/18723 | 3.66e-04 | 2.86e-03 | 15 |
| GO:004361611 | Prostate | Tumor | keratinocyte proliferation | 16/3246 | 46/18723 | 3.34e-03 | 1.73e-02 | 16 |
| GO:009730611 | Prostate | Tumor | cellular response to alcohol | 27/3246 | 93/18723 | 3.59e-03 | 1.85e-02 | 27 |
| GO:0010839 | Prostate | Tumor | negative regulation of keratinocyte proliferation | 7/3246 | 14/18723 | 5.15e-03 | 2.48e-02 | 7 |
| GO:00970663 | Prostate | Tumor | response to thyroid hormone | 10/3246 | 26/18723 | 8.67e-03 | 3.76e-02 | 10 |
| GO:004854530 | Thyroid | HT | response to steroid hormone | 54/1272 | 339/18723 | 3.80e-09 | 3.52e-07 | 54 |
| GO:005138426 | Thyroid | HT | response to glucocorticoid | 29/1272 | 148/18723 | 1.95e-07 | 1.02e-05 | 29 |
| GO:003196026 | Thyroid | HT | response to corticosteroid | 31/1272 | 167/18723 | 2.67e-07 | 1.28e-05 | 31 |
| GO:007138327 | Thyroid | HT | cellular response to steroid hormone stimulus | 34/1272 | 204/18723 | 1.00e-06 | 3.99e-05 | 34 |
| GO:007138515 | Thyroid | HT | cellular response to glucocorticoid stimulus | 15/1272 | 56/18723 | 3.21e-06 | 1.10e-04 | 15 |
| GO:000762324 | Thyroid | HT | circadian rhythm | 33/1272 | 210/18723 | 5.38e-06 | 1.66e-04 | 33 |
| GO:00970673 | Thyroid | HT | cellular response to thyroid hormone stimulus | 8/1272 | 17/18723 | 6.20e-06 | 1.86e-04 | 8 |
| GO:007138416 | Thyroid | HT | cellular response to corticosteroid stimulus | 15/1272 | 61/18723 | 1.01e-05 | 2.77e-04 | 15 |
| GO:004851120 | Thyroid | HT | rhythmic process | 41/1272 | 298/18723 | 1.26e-05 | 3.27e-04 | 41 |
| GO:00970664 | Thyroid | HT | response to thyroid hormone | 9/1272 | 26/18723 | 3.25e-05 | 6.90e-04 | 9 |
| GO:190165426 | Thyroid | HT | response to ketone | 29/1272 | 194/18723 | 5.04e-05 | 9.95e-04 | 29 |
| GO:009730527 | Thyroid | HT | response to alcohol | 33/1272 | 253/18723 | 2.37e-04 | 3.34e-03 | 33 |
| GO:005067320 | Thyroid | HT | epithelial cell proliferation | 48/1272 | 437/18723 | 6.86e-04 | 7.77e-03 | 48 |
| GO:005067820 | Thyroid | HT | regulation of epithelial cell proliferation | 43/1272 | 381/18723 | 7.38e-04 | 8.23e-03 | 43 |
| Page: 1 2 3 4 5 6 7 |
| Pathway ID | Tissue | Disease Stage | Description | Gene Ratio | Bg Ratio | pvalue | p.adjust | qvalue | Count |
| Page: 1 |
Top |
Cell-cell communication analysis |
| Identification of potential cell-cell interactions between two cell types and their ligand-receptor pairs for different disease states |
| Ligand | Receptor | LRpair | Pathway | Tissue | Disease Stage |
| Page: 1 |
Top |
Single-cell gene regulatory network inference analysis |
| Find out the significant the regulons (TFs) and the target genes of each regulon across cell types for different disease states |
| TF | Cell Type | Tissue | Disease Stage | Target Gene | RSS | Regulon Activity |
| KLF9 | DC | Cervix | ADJ | ADIRF,C1R,TM4SF1, etc. | 1.54e-01 |  |
| KLF9 | M1MAC | Cervix | Healthy | ADIRF,C1R,TM4SF1, etc. | 1.99e-01 |  |
| KLF9 | GDT | Oral cavity | NEOLP | GREM1,COL15A1,MXRA7, etc. | 1.92e-01 |  |
| KLF9 | pDC | Prostate | BPH | C11orf96,ADAMTS4,ZNF430, etc. | 2.09e-01 |  |
| KLF9 | pDC | Prostate | Healthy | C11orf96,ADAMTS4,ZNF430, etc. | 2.57e-01 |  |
| KLF9 | pDC | Prostate | Tumor | C11orf96,ADAMTS4,ZNF430, etc. | 1.15e-01 |  |
| ∗The dot plots of a searched regulon are shown for all cell subpopulations in each disease state of each tissue based on the regulon specific score inferred using pySCENIC and by calculating the average expression. |
| Page: 1 |
Top |
Somatic mutation of malignant transformation related genes |
| Annotation of somatic variants for genes involved in malignant transformation |
| Hugo Symbol | Variant Class | Variant Classification | dbSNP RS | HGVSc | HGVSp | HGVSp Short | SWISSPROT | BIOTYPE | SIFT | PolyPhen | Tumor Sample Barcode | Tissue | Histology | Sex | Age | Stage | Therapy Types | Drugs | Outcome |
| KLF9 | deletion | In_Frame_Del | novel | c.557_571delNNNNNNNNNNNNNNN | p.Arg186_Thr191delinsPro | p.R186_T191delinsP | Q13886 | protein_coding | TCGA-A2-A0CS-01 | Breast | breast invasive carcinoma | Female | >=65 | III/IV | Hormone Therapy | anastrozole | SD | ||
| KLF9 | deletion | In_Frame_Del | novel | c.557_571delGCTCAGACGAGCTGA | p.Arg186_Thr191delinsPro | p.R186_T191delinsP | Q13886 | protein_coding | TCGA-E2-A15M-01 | Breast | breast invasive carcinoma | Female | >=65 | I/II | Hormone Therapy | arimidex | SD | ||
| KLF9 | SNV | Missense_Mutation | rs867125164 | c.290N>T | p.Ser97Ile | p.S97I | Q13886 | protein_coding | tolerated(0.13) | benign(0.017) | TCGA-2W-A8YY-01 | Cervix | cervical & endocervical cancer | Female | <65 | I/II | Chemotherapy | cisplatin | CR |
| KLF9 | SNV | Missense_Mutation | c.293A>C | p.Asp98Ala | p.D98A | Q13886 | protein_coding | tolerated(1) | benign(0.003) | TCGA-IR-A3LK-01 | Cervix | cervical & endocervical cancer | Female | >=65 | I/II | Chemotherapy | cisplatin | PD | |
| KLF9 | SNV | Missense_Mutation | novel | c.265C>T | p.Pro89Ser | p.P89S | Q13886 | protein_coding | tolerated(0.52) | benign(0) | TCGA-AA-3984-01 | Colorectum | colon adenocarcinoma | Female | <65 | I/II | Unknown | Unknown | SD |
| KLF9 | SNV | Missense_Mutation | novel | c.506N>C | p.Gly169Ala | p.G169A | Q13886 | protein_coding | deleterious(0.02) | probably_damaging(0.996) | TCGA-AM-5820-01 | Colorectum | colon adenocarcinoma | Female | <65 | I/II | Unknown | Unknown | SD |
| KLF9 | SNV | Missense_Mutation | c.266N>T | p.Pro89Leu | p.P89L | Q13886 | protein_coding | tolerated(0.66) | benign(0.001) | TCGA-CK-4951-01 | Colorectum | colon adenocarcinoma | Female | >=65 | I/II | Unknown | Unknown | PD | |
| KLF9 | SNV | Missense_Mutation | novel | c.467N>C | p.Lys156Thr | p.K156T | Q13886 | protein_coding | deleterious(0.04) | possibly_damaging(0.456) | TCGA-EI-6917-01 | Colorectum | rectum adenocarcinoma | Male | <65 | III/IV | Chemotherapy | 5fluorouracil+oxaciplatina+l-folinian | SD |
| KLF9 | deletion | Frame_Shift_Del | c.713delN | p.Lys238ArgfsTer32 | p.K238Rfs*32 | Q13886 | protein_coding | TCGA-DM-A1HB-01 | Colorectum | colon adenocarcinoma | Male | >=65 | III/IV | Unknown | Unknown | SD | |||
| KLF9 | SNV | Missense_Mutation | novel | c.190N>A | p.Ala64Thr | p.A64T | Q13886 | protein_coding | deleterious(0) | probably_damaging(0.967) | TCGA-A5-A0G2-01 | Endometrium | uterine corpus endometrioid carcinoma | Female | <65 | III/IV | Unknown | Unknown | SD |
| Page: 1 2 3 4 |
Top |
Related drugs of malignant transformation related genes |
| Identification of chemicals and drugs interact with genes involved in malignant transfromation |
| (DGIdb 4.0) |
| Entrez ID | Symbol | Category | Interaction Types | Drug Claim Name | Drug Name | PMIDs |
| Page: 1 |

Copyright 2023-Present -The University of Texas Health Science Center at Houston |