
|
|||||
|
 | |
| |
| |
| |
| |
| |
|
Gene: KAT5 |
Gene summary for KAT5 |
| Gene information | Species | Human | Gene symbol | KAT5 | Gene ID | 10524 |
| Gene name | lysine acetyltransferase 5 | |
| Gene Alias | ESA1 | |
| Cytomap | 11q13.1 | |
| Gene Type | protein-coding | GO ID | GO:0000122 | UniProtAcc | Q92993 |
Top |
Malignant transformation analysis |
| Identification of the aberrant gene expression in precancerous and cancerous lesions by comparing the gene expression of stem-like cells in diseased tissues with normal stem cells |
| Entrez ID | Symbol | Replicates | Species | Organ | Tissue | Adj P-value | Log2FC | Malignancy |
| 10524 | KAT5 | LZE4T | Human | Esophagus | ESCC | 1.76e-12 | 2.69e-01 | 0.0811 |
| 10524 | KAT5 | LZE7T | Human | Esophagus | ESCC | 9.45e-04 | 2.07e-01 | 0.0667 |
| 10524 | KAT5 | LZE8T | Human | Esophagus | ESCC | 6.36e-03 | 1.06e-01 | 0.067 |
| 10524 | KAT5 | LZE20T | Human | Esophagus | ESCC | 1.28e-09 | 5.32e-01 | 0.0662 |
| 10524 | KAT5 | LZE22T | Human | Esophagus | ESCC | 2.57e-04 | 1.86e-01 | 0.068 |
| 10524 | KAT5 | LZE24T | Human | Esophagus | ESCC | 2.33e-15 | 2.54e-01 | 0.0596 |
| 10524 | KAT5 | P1T-E | Human | Esophagus | ESCC | 1.71e-11 | 2.88e-01 | 0.0875 |
| 10524 | KAT5 | P2T-E | Human | Esophagus | ESCC | 4.06e-18 | 3.04e-01 | 0.1177 |
| 10524 | KAT5 | P4T-E | Human | Esophagus | ESCC | 4.81e-21 | 5.06e-01 | 0.1323 |
| 10524 | KAT5 | P5T-E | Human | Esophagus | ESCC | 1.80e-21 | 3.96e-01 | 0.1327 |
| 10524 | KAT5 | P8T-E | Human | Esophagus | ESCC | 7.49e-31 | 5.93e-01 | 0.0889 |
| 10524 | KAT5 | P9T-E | Human | Esophagus | ESCC | 1.16e-15 | 2.02e-01 | 0.1131 |
| 10524 | KAT5 | P10T-E | Human | Esophagus | ESCC | 1.78e-47 | 7.95e-01 | 0.116 |
| 10524 | KAT5 | P11T-E | Human | Esophagus | ESCC | 8.39e-18 | 6.12e-01 | 0.1426 |
| 10524 | KAT5 | P12T-E | Human | Esophagus | ESCC | 8.91e-26 | 4.42e-01 | 0.1122 |
| 10524 | KAT5 | P15T-E | Human | Esophagus | ESCC | 4.96e-22 | 5.72e-01 | 0.1149 |
| 10524 | KAT5 | P16T-E | Human | Esophagus | ESCC | 6.80e-30 | 5.43e-01 | 0.1153 |
| 10524 | KAT5 | P17T-E | Human | Esophagus | ESCC | 2.09e-03 | 1.90e-01 | 0.1278 |
| 10524 | KAT5 | P19T-E | Human | Esophagus | ESCC | 4.75e-03 | 3.40e-01 | 0.1662 |
| 10524 | KAT5 | P20T-E | Human | Esophagus | ESCC | 1.85e-13 | 2.58e-01 | 0.1124 |
| Page: 1 2 3 4 5 6 |
| Tissue | Expression Dynamics | Abbreviation |
| Esophagus | 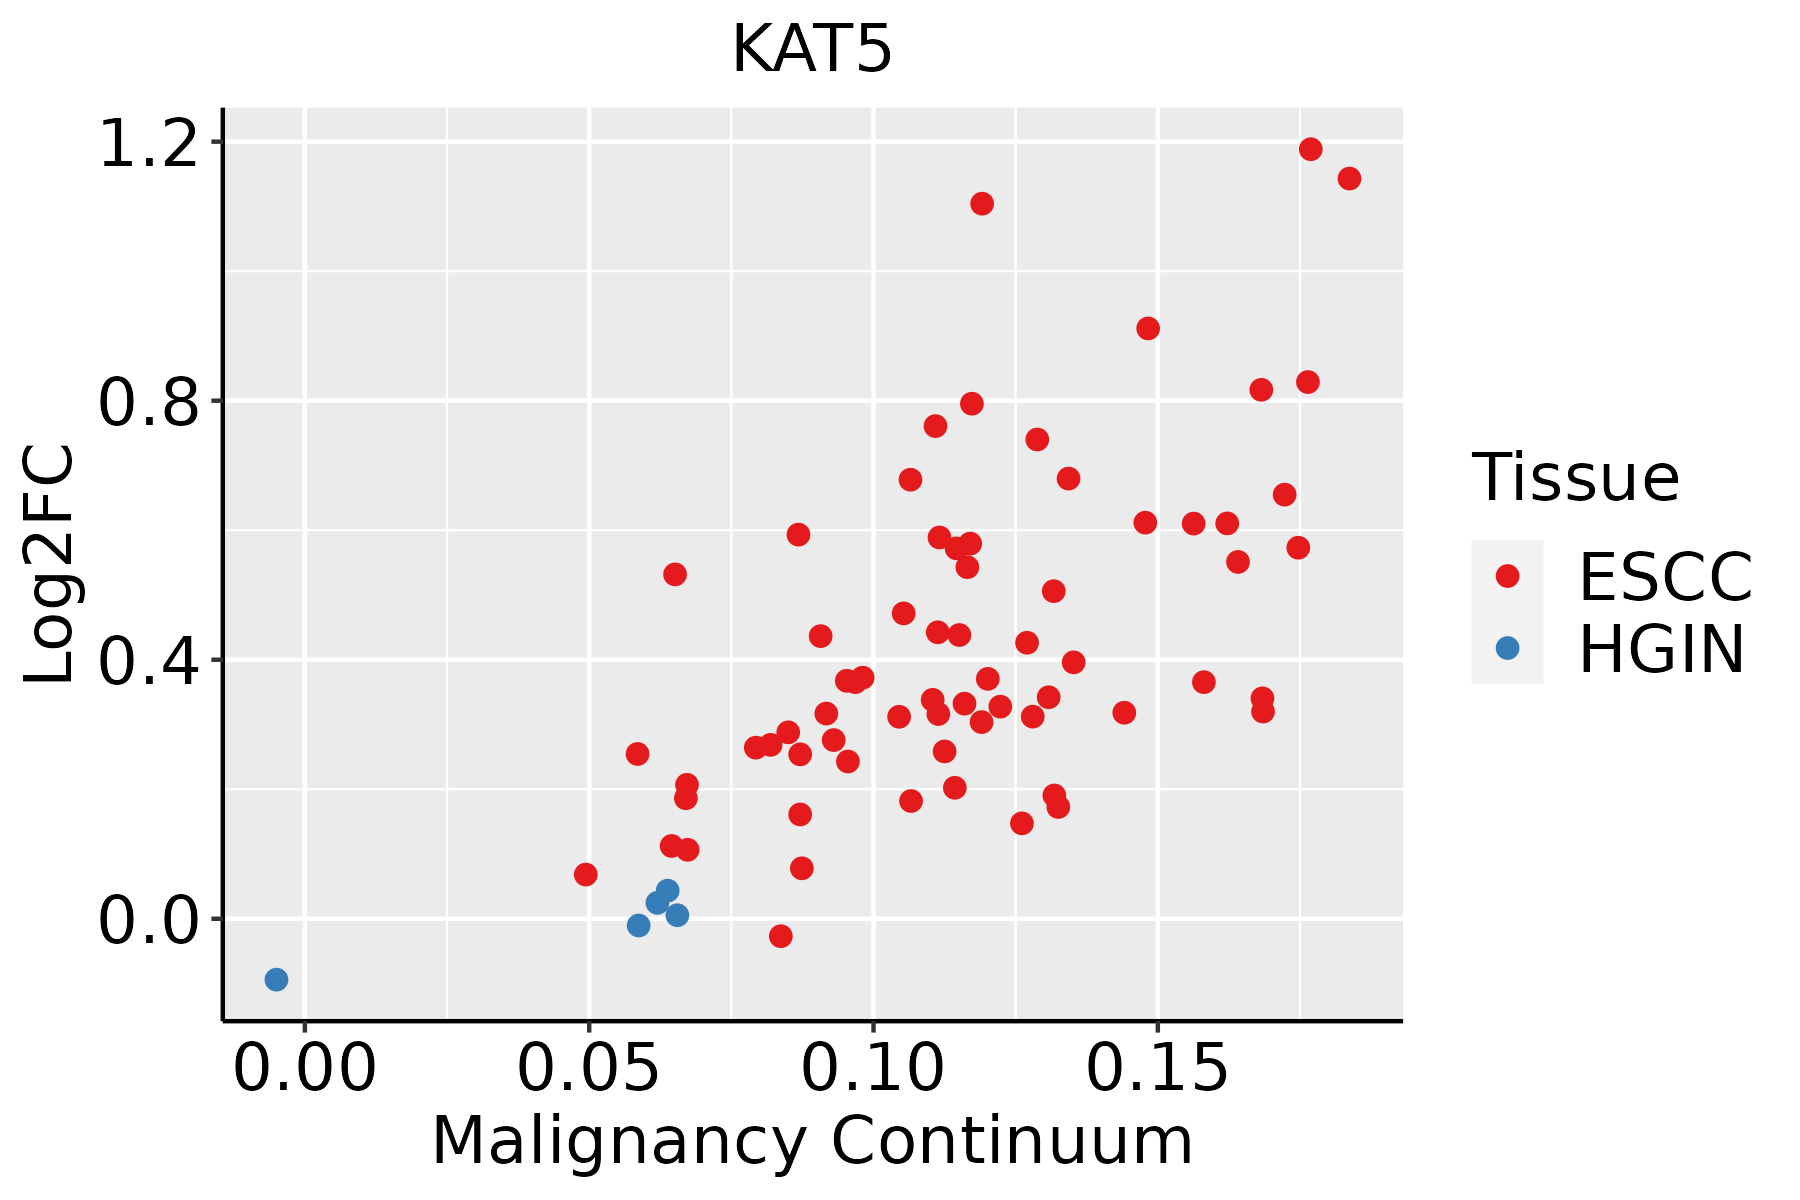 | ESCC: Esophageal squamous cell carcinoma |
| HGIN: High-grade intraepithelial neoplasias | ||
| LGIN: Low-grade intraepithelial neoplasias | ||
| Oral Cavity | 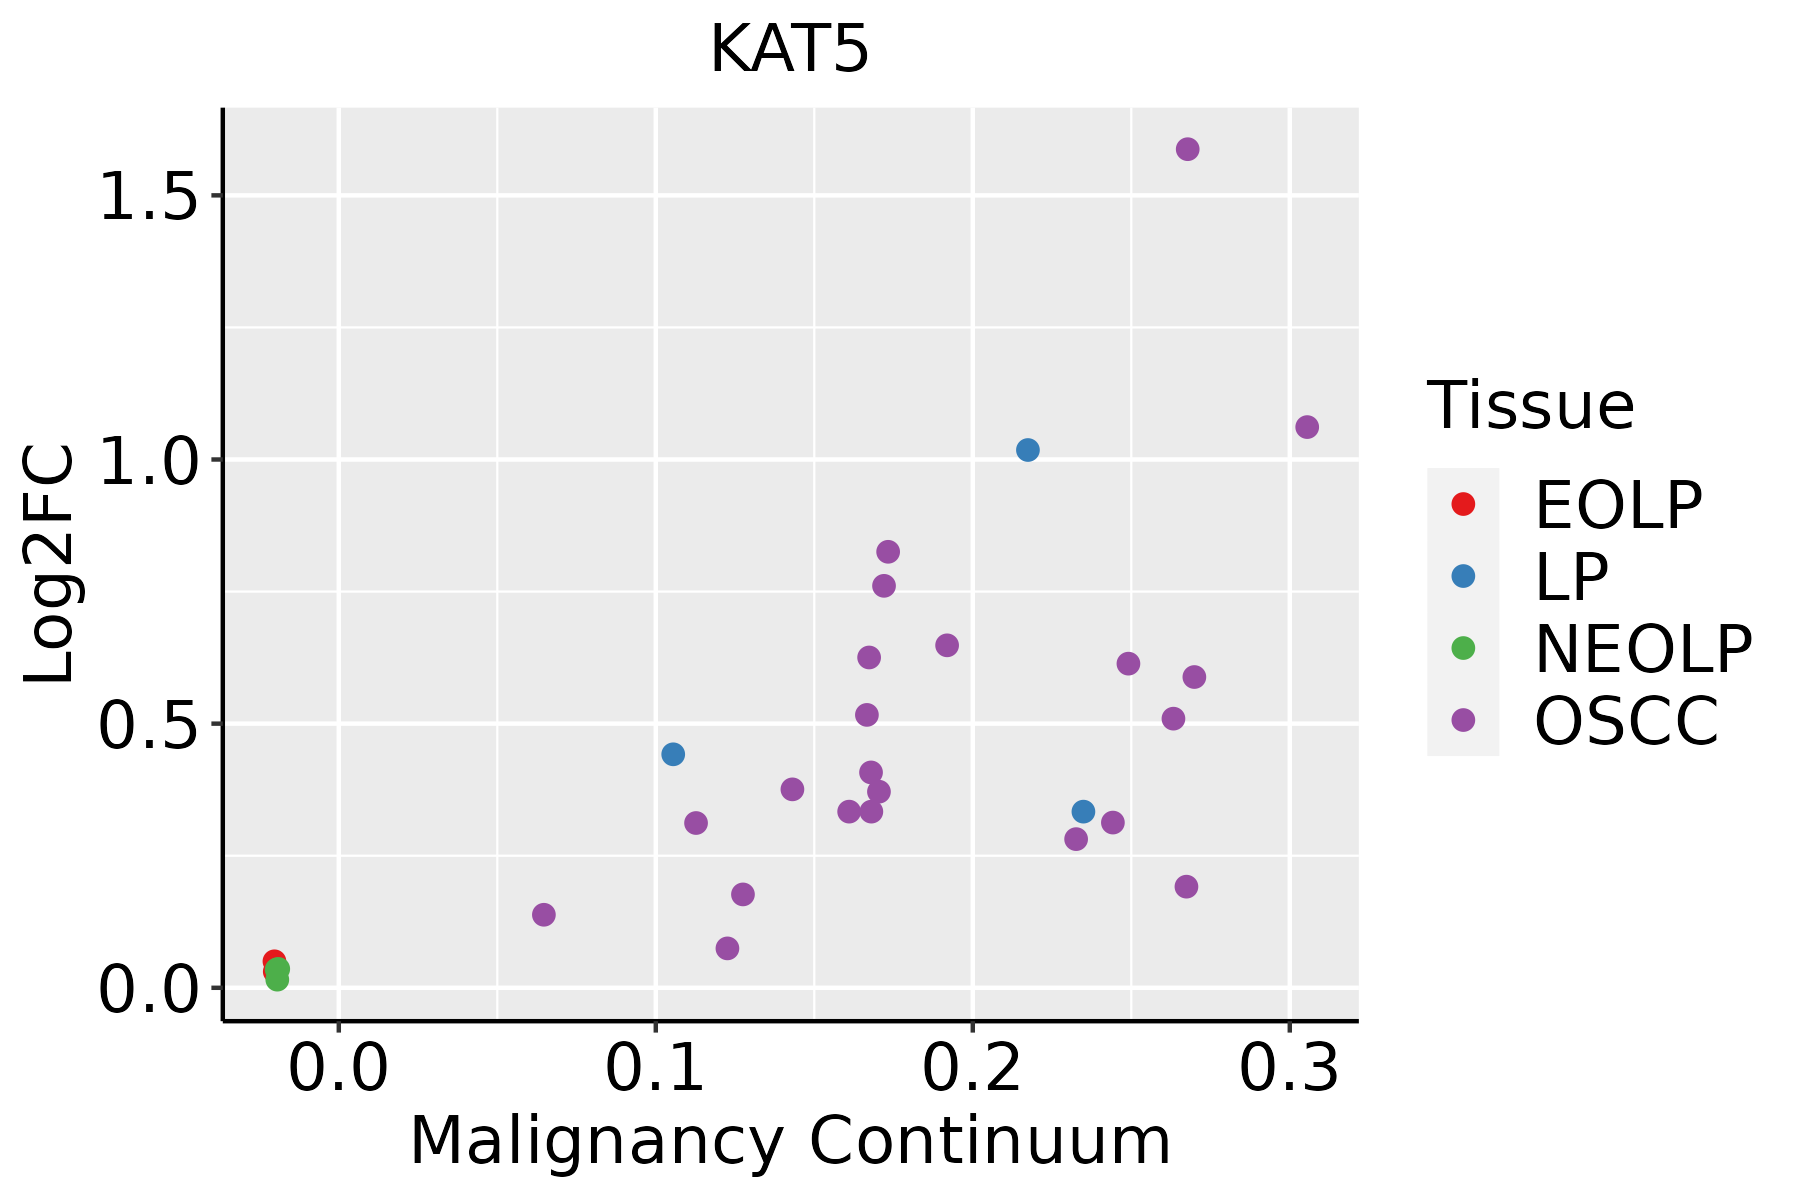 | EOLP: Erosive Oral lichen planus |
| LP: leukoplakia | ||
| NEOLP: Non-erosive oral lichen planus | ||
| OSCC: Oral squamous cell carcinoma | ||
| Skin | 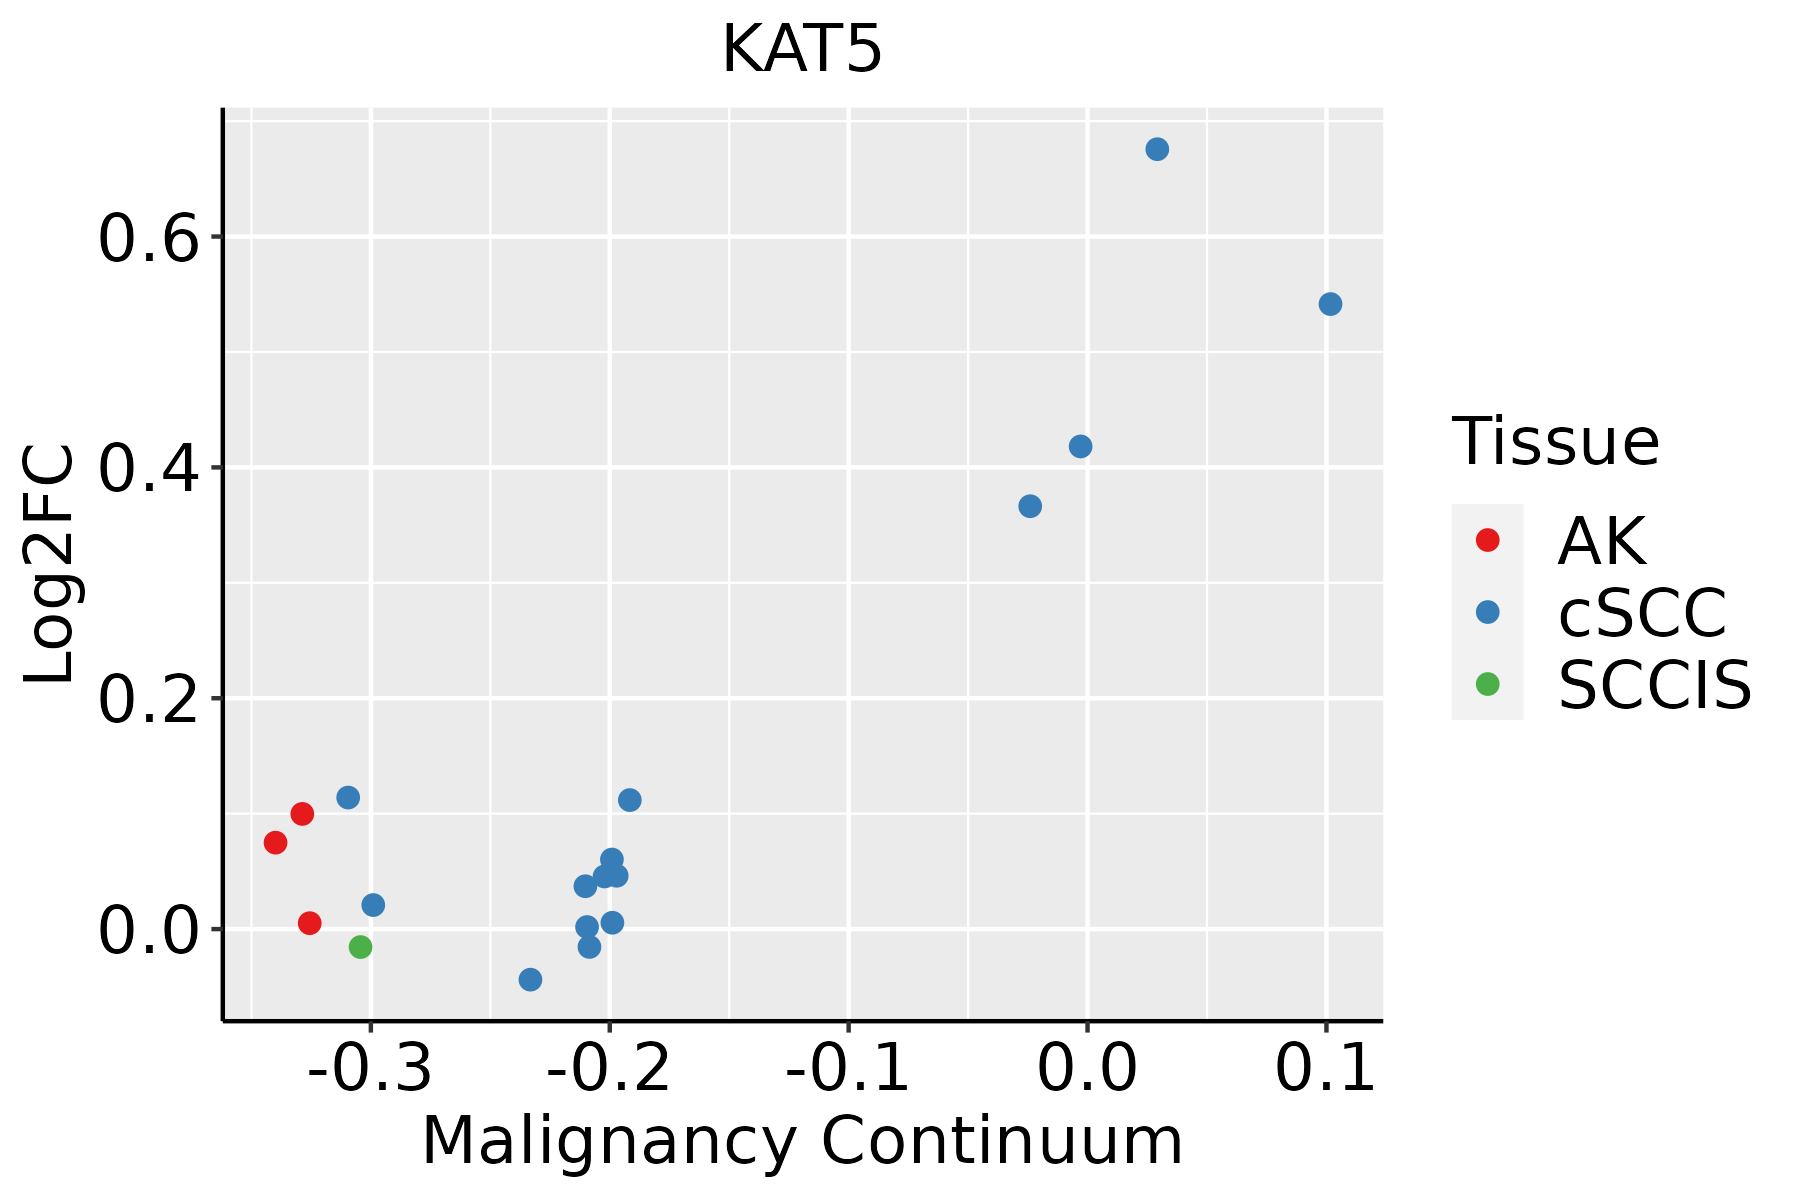 | AK: Actinic keratosis |
| cSCC: Cutaneous squamous cell carcinoma | ||
| SCCIS:squamous cell carcinoma in situ | ||
| Thyroid | 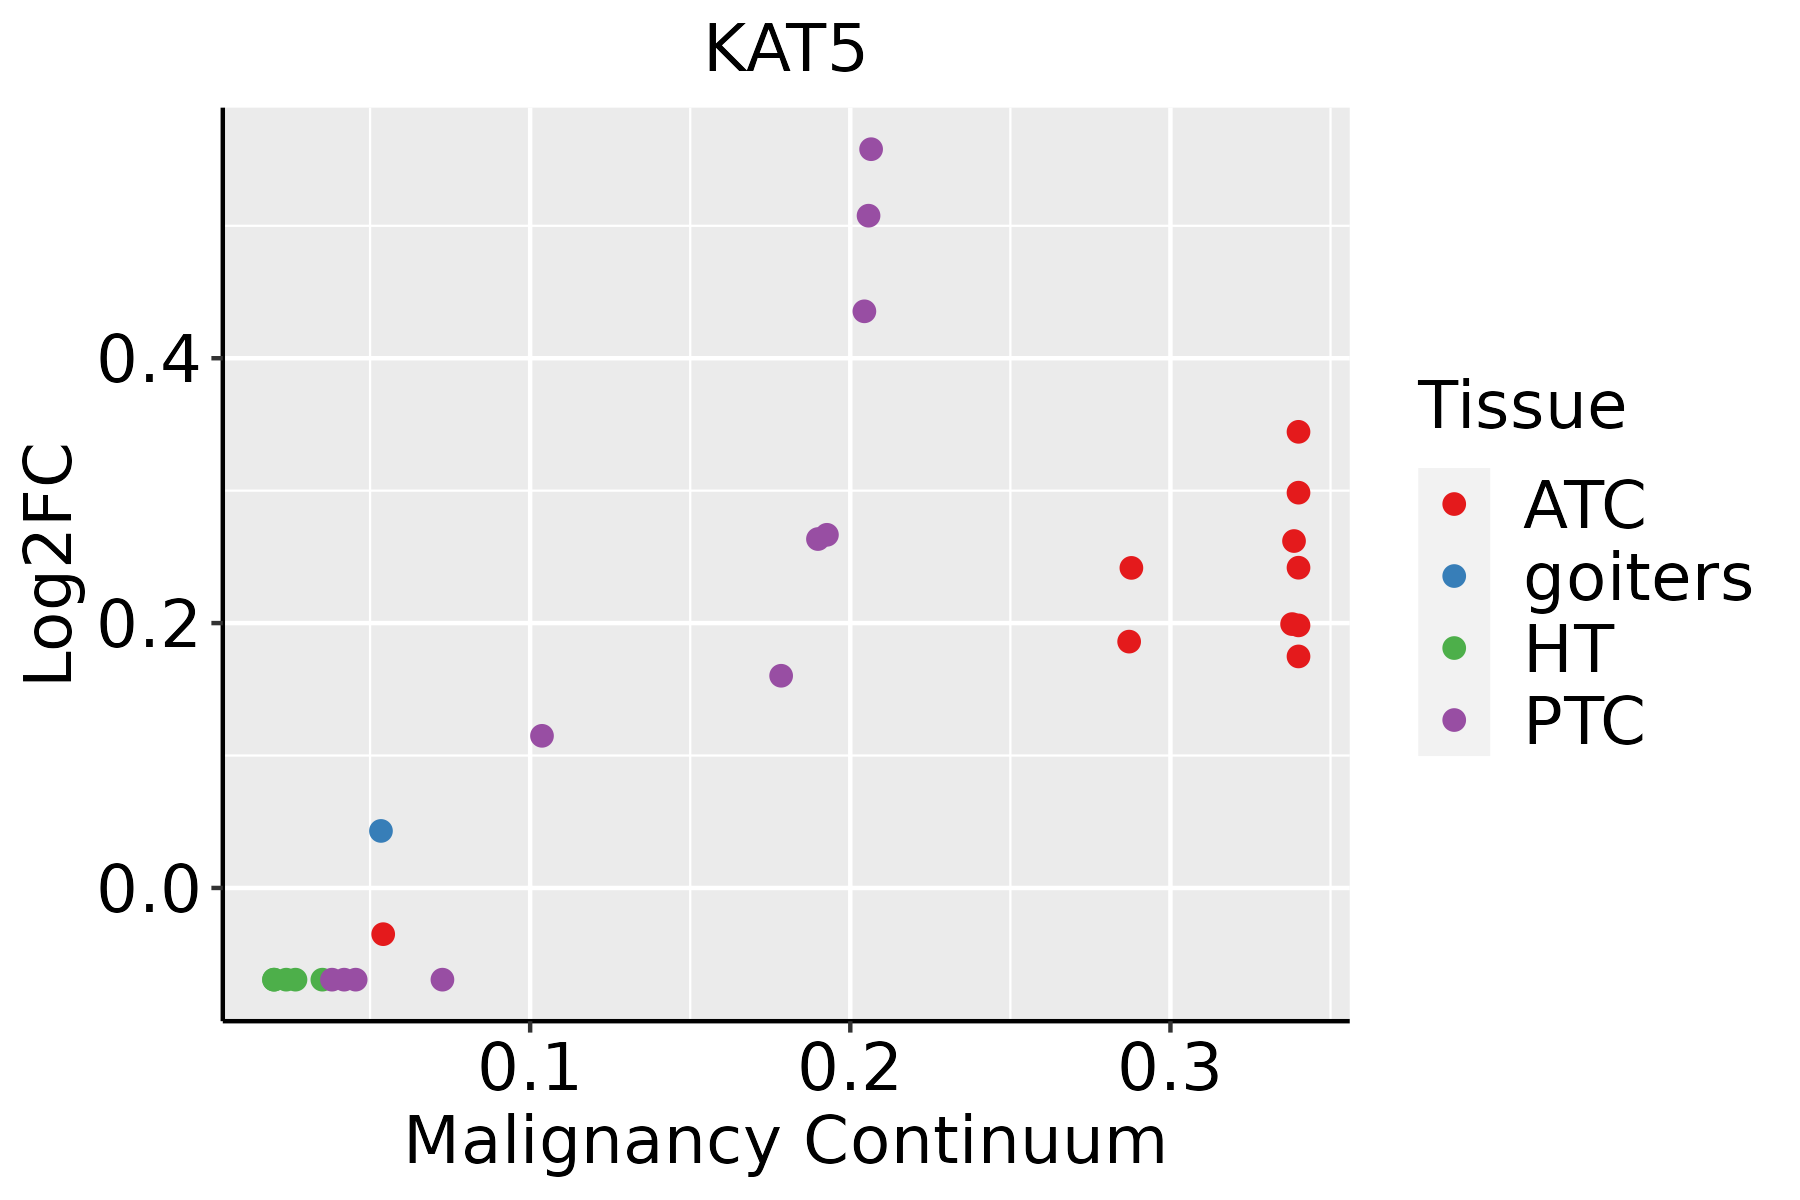 | ATC: Anaplastic thyroid cancer |
| HT: Hashimoto's thyroiditis | ||
| PTC: Papillary thyroid cancer |
| ∗log2FC in expression of this searched gene in stem-like cells from each diseased tissue sample relative to stem-like cells in normal samples in each tissue plotted against the malignancy continuum. Samples are colored based on if they are from different disease stage. |
Top |
Malignant transformation related pathway analysis |
| Find out the enriched GO biological processes and KEGG pathways involved in transition from healthy to precancer to cancer |
| Tissue | Disease Stage | Enriched GO biological Processes |
| Colorectum | AD |  |
| Colorectum | SER |  |
| Colorectum | MSS |  |
| Colorectum | MSI-H |  |
| Colorectum | FAP |  |
| ∗Top 15 enriched GO BP terms are showed in the bar plot of each disease state in each tissue. Each row represents a significant GO biological process which is colored according to the -log10(p.adjust). |
| Page: 1 2 3 4 5 6 7 8 9 |
| GO ID | Tissue | Disease Stage | Description | Gene Ratio | Bg Ratio | pvalue | p.adjust | Count |
| GO:004316127 | Skin | AK | proteasome-mediated ubiquitin-dependent protein catabolic process | 84/1910 | 412/18723 | 3.96e-10 | 4.88e-08 | 84 |
| GO:000989627 | Skin | AK | positive regulation of catabolic process | 94/1910 | 492/18723 | 1.32e-09 | 1.26e-07 | 94 |
| GO:007233128 | Skin | AK | signal transduction by p53 class mediator | 41/1910 | 163/18723 | 3.41e-08 | 1.80e-06 | 41 |
| GO:003133127 | Skin | AK | positive regulation of cellular catabolic process | 80/1910 | 427/18723 | 5.42e-08 | 2.76e-06 | 80 |
| GO:00165709 | Skin | AK | histone modification | 84/1910 | 463/18723 | 1.10e-07 | 4.95e-06 | 84 |
| GO:000756826 | Skin | AK | aging | 63/1910 | 339/18723 | 1.83e-06 | 5.42e-05 | 63 |
| GO:000931420 | Skin | AK | response to radiation | 78/1910 | 456/18723 | 3.32e-06 | 8.59e-05 | 78 |
| GO:00182058 | Skin | AK | peptidyl-lysine modification | 66/1910 | 376/18723 | 7.80e-06 | 1.72e-04 | 66 |
| GO:00427709 | Skin | AK | signal transduction in response to DNA damage | 35/1910 | 172/18723 | 5.20e-05 | 8.05e-04 | 35 |
| GO:00064736 | Skin | AK | protein acetylation | 39/1910 | 201/18723 | 6.08e-05 | 9.02e-04 | 39 |
| GO:003235510 | Skin | AK | response to estradiol | 30/1910 | 141/18723 | 7.41e-05 | 1.06e-03 | 30 |
| GO:003033025 | Skin | AK | DNA damage response, signal transduction by p53 class mediator | 18/1910 | 72/18723 | 2.51e-04 | 2.72e-03 | 18 |
| GO:000756910 | Skin | AK | cell aging | 27/1910 | 132/18723 | 3.26e-04 | 3.33e-03 | 27 |
| GO:00183946 | Skin | AK | peptidyl-lysine acetylation | 32/1910 | 169/18723 | 4.20e-04 | 4.00e-03 | 32 |
| GO:001021210 | Skin | AK | response to ionizing radiation | 29/1910 | 148/18723 | 4.27e-04 | 4.05e-03 | 29 |
| GO:00435436 | Skin | AK | protein acylation | 42/1910 | 243/18723 | 4.59e-04 | 4.28e-03 | 42 |
| GO:001050618 | Skin | AK | regulation of autophagy | 51/1910 | 317/18723 | 6.97e-04 | 5.96e-03 | 51 |
| GO:00903985 | Skin | AK | cellular senescence | 20/1910 | 93/18723 | 9.64e-04 | 7.68e-03 | 20 |
| GO:00183936 | Skin | AK | internal peptidyl-lysine acetylation | 29/1910 | 158/18723 | 1.27e-03 | 9.63e-03 | 29 |
| GO:00165736 | Skin | AK | histone acetylation | 28/1910 | 152/18723 | 1.44e-03 | 1.06e-02 | 28 |
| Page: 1 2 3 4 5 6 7 8 9 10 |
| Pathway ID | Tissue | Disease Stage | Description | Gene Ratio | Bg Ratio | pvalue | p.adjust | qvalue | Count |
| hsa05166211 | Esophagus | ESCC | Human T-cell leukemia virus 1 infection | 164/4205 | 222/8465 | 8.13e-14 | 2.09e-12 | 1.07e-12 | 164 |
| hsa0501728 | Esophagus | ESCC | Spinocerebellar ataxia | 94/4205 | 143/8465 | 6.77e-05 | 2.90e-04 | 1.48e-04 | 94 |
| hsa05166310 | Esophagus | ESCC | Human T-cell leukemia virus 1 infection | 164/4205 | 222/8465 | 8.13e-14 | 2.09e-12 | 1.07e-12 | 164 |
| hsa0501736 | Esophagus | ESCC | Spinocerebellar ataxia | 94/4205 | 143/8465 | 6.77e-05 | 2.90e-04 | 1.48e-04 | 94 |
| hsa0516630 | Oral cavity | OSCC | Human T-cell leukemia virus 1 infection | 150/3704 | 222/8465 | 3.68e-13 | 7.26e-12 | 3.70e-12 | 150 |
| hsa0501725 | Oral cavity | OSCC | Spinocerebellar ataxia | 86/3704 | 143/8465 | 5.21e-05 | 2.08e-04 | 1.06e-04 | 86 |
| hsa05166113 | Oral cavity | OSCC | Human T-cell leukemia virus 1 infection | 150/3704 | 222/8465 | 3.68e-13 | 7.26e-12 | 3.70e-12 | 150 |
| hsa05017111 | Oral cavity | OSCC | Spinocerebellar ataxia | 86/3704 | 143/8465 | 5.21e-05 | 2.08e-04 | 1.06e-04 | 86 |
| hsa05166210 | Oral cavity | LP | Human T-cell leukemia virus 1 infection | 100/2418 | 222/8465 | 8.94e-08 | 1.29e-06 | 8.35e-07 | 100 |
| hsa0501726 | Oral cavity | LP | Spinocerebellar ataxia | 59/2418 | 143/8465 | 6.97e-04 | 3.46e-03 | 2.23e-03 | 59 |
| hsa0516638 | Oral cavity | LP | Human T-cell leukemia virus 1 infection | 100/2418 | 222/8465 | 8.94e-08 | 1.29e-06 | 8.35e-07 | 100 |
| hsa0501735 | Oral cavity | LP | Spinocerebellar ataxia | 59/2418 | 143/8465 | 6.97e-04 | 3.46e-03 | 2.23e-03 | 59 |
| Page: 1 |
Top |
Cell-cell communication analysis |
| Identification of potential cell-cell interactions between two cell types and their ligand-receptor pairs for different disease states |
| Ligand | Receptor | LRpair | Pathway | Tissue | Disease Stage |
| Page: 1 |
Top |
Single-cell gene regulatory network inference analysis |
| Find out the significant the regulons (TFs) and the target genes of each regulon across cell types for different disease states |
| TF | Cell Type | Tissue | Disease Stage | Target Gene | RSS | Regulon Activity |
| ∗The dot plots of a searched regulon are shown for all cell subpopulations in each disease state of each tissue based on the regulon specific score inferred using pySCENIC and by calculating the average expression. |
| Page: 1 |
Top |
Somatic mutation of malignant transformation related genes |
| Annotation of somatic variants for genes involved in malignant transformation |
| Hugo Symbol | Variant Class | Variant Classification | dbSNP RS | HGVSc | HGVSp | HGVSp Short | SWISSPROT | BIOTYPE | SIFT | PolyPhen | Tumor Sample Barcode | Tissue | Histology | Sex | Age | Stage | Therapy Types | Drugs | Outcome |
| KAT5 | SNV | Missense_Mutation | novel | c.758N>A | p.Arg253Gln | p.R253Q | Q92993 | protein_coding | tolerated(0.61) | benign(0.206) | TCGA-A2-A0D1-01 | Breast | breast invasive carcinoma | Female | >=65 | I/II | Chemotherapy | taxotere | SD |
| KAT5 | SNV | Missense_Mutation | c.1469N>A | p.Ser490Tyr | p.S490Y | Q92993 | protein_coding | tolerated(0.06) | possibly_damaging(0.689) | TCGA-C5-A1BQ-01 | Cervix | cervical & endocervical cancer | Female | >=65 | III/IV | Chemotherapy | cisplatin | CR | |
| KAT5 | SNV | Missense_Mutation | c.563N>T | p.Ser188Leu | p.S188L | Q92993 | protein_coding | tolerated(0.12) | benign(0.009) | TCGA-C5-A7CL-01 | Cervix | cervical & endocervical cancer | Female | <65 | III/IV | Chemotherapy | cisplatin | PD | |
| KAT5 | SNV | Missense_Mutation | c.629G>A | p.Arg210His | p.R210H | Q92993 | protein_coding | tolerated(0.13) | benign(0.017) | TCGA-EK-A2RJ-01 | Cervix | cervical & endocervical cancer | Female | <65 | I/II | Unknown | Unknown | SD | |
| KAT5 | SNV | Missense_Mutation | c.766G>A | p.Asp256Asn | p.D256N | Q92993 | protein_coding | deleterious(0.04) | possibly_damaging(0.479) | TCGA-IR-A3LA-01 | Cervix | cervical & endocervical cancer | Female | <65 | I/II | Chemotherapy | cisplatin | CR | |
| KAT5 | SNV | Missense_Mutation | c.1023G>C | p.Lys341Asn | p.K341N | Q92993 | protein_coding | deleterious(0) | probably_damaging(0.993) | TCGA-IR-A3LA-01 | Cervix | cervical & endocervical cancer | Female | <65 | I/II | Chemotherapy | cisplatin | CR | |
| KAT5 | SNV | Missense_Mutation | rs199674306 | c.1585N>A | p.Asp529Asn | p.D529N | Q92993 | protein_coding | tolerated(0.09) | possibly_damaging(0.829) | TCGA-AA-3510-01 | Colorectum | colon adenocarcinoma | Male | >=65 | I/II | Unknown | Unknown | SD |
| KAT5 | SNV | Missense_Mutation | c.283N>T | p.Arg95Trp | p.R95W | Q92993 | protein_coding | deleterious(0.04) | probably_damaging(0.975) | TCGA-AA-3663-01 | Colorectum | colon adenocarcinoma | Male | <65 | I/II | Unknown | Unknown | SD | |
| KAT5 | SNV | Missense_Mutation | c.328N>G | p.Thr110Ala | p.T110A | Q92993 | protein_coding | tolerated(0.24) | benign(0.108) | TCGA-AA-3715-01 | Colorectum | colon adenocarcinoma | Male | >=65 | I/II | Unknown | Unknown | PD | |
| KAT5 | SNV | Missense_Mutation | rs760709797 | c.911G>A | p.Arg304His | p.R304H | Q92993 | protein_coding | deleterious(0.03) | benign(0.009) | TCGA-AA-3947-01 | Colorectum | colon adenocarcinoma | Female | <65 | I/II | Unknown | Unknown | SD |
| Page: 1 2 3 4 5 6 7 |
Top |
Related drugs of malignant transformation related genes |
| Identification of chemicals and drugs interact with genes involved in malignant transfromation |
| (DGIdb 4.0) |
| Entrez ID | Symbol | Category | Interaction Types | Drug Claim Name | Drug Name | PMIDs |
| 10524 | KAT5 | TRANSCRIPTION FACTOR COMPLEX, TUMOR SUPPRESSOR, ENZYME | inhibitor | 187051791 | ||
| 10524 | KAT5 | TRANSCRIPTION FACTOR COMPLEX, TUMOR SUPPRESSOR, ENZYME | ANACARDIC ACID | 22100137 | ||
| 10524 | KAT5 | TRANSCRIPTION FACTOR COMPLEX, TUMOR SUPPRESSOR, ENZYME | 6-DECYLSALICYLIC ACID | CHEMBL416038 | 22100137 |
| Page: 1 |

Copyright 2023-Present -The University of Texas Health Science Center at Houston |