
|
|||||
|
 | |
| |
| |
| |
| |
| |
|
Gene: ITSN1 |
Gene summary for ITSN1 |
| Gene information | Species | Human | Gene symbol | ITSN1 | Gene ID | 6453 |
| Gene name | intersectin 1 | |
| Gene Alias | ITSN | |
| Cytomap | 21q22.11 | |
| Gene Type | protein-coding | GO ID | GO:0002790 | UniProtAcc | Q15811 |
Top |
Malignant transformation analysis |
| Identification of the aberrant gene expression in precancerous and cancerous lesions by comparing the gene expression of stem-like cells in diseased tissues with normal stem cells |
| Entrez ID | Symbol | Replicates | Species | Organ | Tissue | Adj P-value | Log2FC | Malignancy |
| 6453 | ITSN1 | CCI_1 | Human | Cervix | CC | 3.99e-04 | 5.60e-01 | 0.528 |
| 6453 | ITSN1 | CCI_2 | Human | Cervix | CC | 1.80e-09 | 1.09e+00 | 0.5249 |
| 6453 | ITSN1 | HTA11_3410_2000001011 | Human | Colorectum | AD | 9.82e-20 | -5.77e-01 | 0.0155 |
| 6453 | ITSN1 | HTA11_2487_2000001011 | Human | Colorectum | SER | 3.16e-07 | -4.96e-01 | -0.1808 |
| 6453 | ITSN1 | HTA11_1938_2000001011 | Human | Colorectum | AD | 5.68e-04 | -4.47e-01 | -0.0811 |
| 6453 | ITSN1 | HTA11_78_2000001011 | Human | Colorectum | AD | 6.38e-06 | -4.46e-01 | -0.1088 |
| 6453 | ITSN1 | HTA11_347_2000001011 | Human | Colorectum | AD | 8.37e-12 | -4.08e-01 | -0.1954 |
| 6453 | ITSN1 | HTA11_2112_2000001011 | Human | Colorectum | SER | 5.87e-03 | -6.22e-01 | -0.2196 |
| 6453 | ITSN1 | HTA11_3361_2000001011 | Human | Colorectum | AD | 2.10e-08 | -5.71e-01 | -0.1207 |
| 6453 | ITSN1 | HTA11_696_2000001011 | Human | Colorectum | AD | 2.18e-16 | -5.11e-01 | -0.1464 |
| 6453 | ITSN1 | HTA11_866_2000001011 | Human | Colorectum | AD | 8.90e-14 | -5.07e-01 | -0.1001 |
| 6453 | ITSN1 | HTA11_1391_2000001011 | Human | Colorectum | AD | 3.62e-07 | -4.27e-01 | -0.059 |
| 6453 | ITSN1 | HTA11_7862_2000001011 | Human | Colorectum | AD | 2.38e-02 | -5.00e-01 | -0.0179 |
| 6453 | ITSN1 | HTA11_866_3004761011 | Human | Colorectum | AD | 2.11e-16 | -5.70e-01 | 0.096 |
| 6453 | ITSN1 | HTA11_8622_2000001021 | Human | Colorectum | SER | 3.62e-03 | -5.73e-01 | 0.0528 |
| 6453 | ITSN1 | HTA11_10711_2000001011 | Human | Colorectum | AD | 5.88e-10 | -5.68e-01 | 0.0338 |
| 6453 | ITSN1 | HTA11_7696_3000711011 | Human | Colorectum | AD | 4.31e-18 | -5.34e-01 | 0.0674 |
| 6453 | ITSN1 | HTA11_6818_2000001011 | Human | Colorectum | AD | 8.49e-03 | -5.38e-01 | 0.0112 |
| 6453 | ITSN1 | HTA11_6818_2000001021 | Human | Colorectum | AD | 8.14e-07 | -5.54e-01 | 0.0588 |
| 6453 | ITSN1 | HTA11_99999970781_79442 | Human | Colorectum | MSS | 1.01e-17 | -5.09e-01 | 0.294 |
| Page: 1 2 3 4 5 6 7 |
| Tissue | Expression Dynamics | Abbreviation |
| Cervix |  | CC: Cervix cancer |
| HSIL_HPV: HPV-infected high-grade squamous intraepithelial lesions | ||
| N_HPV: HPV-infected normal cervix | ||
| Colorectum (GSE201348) | 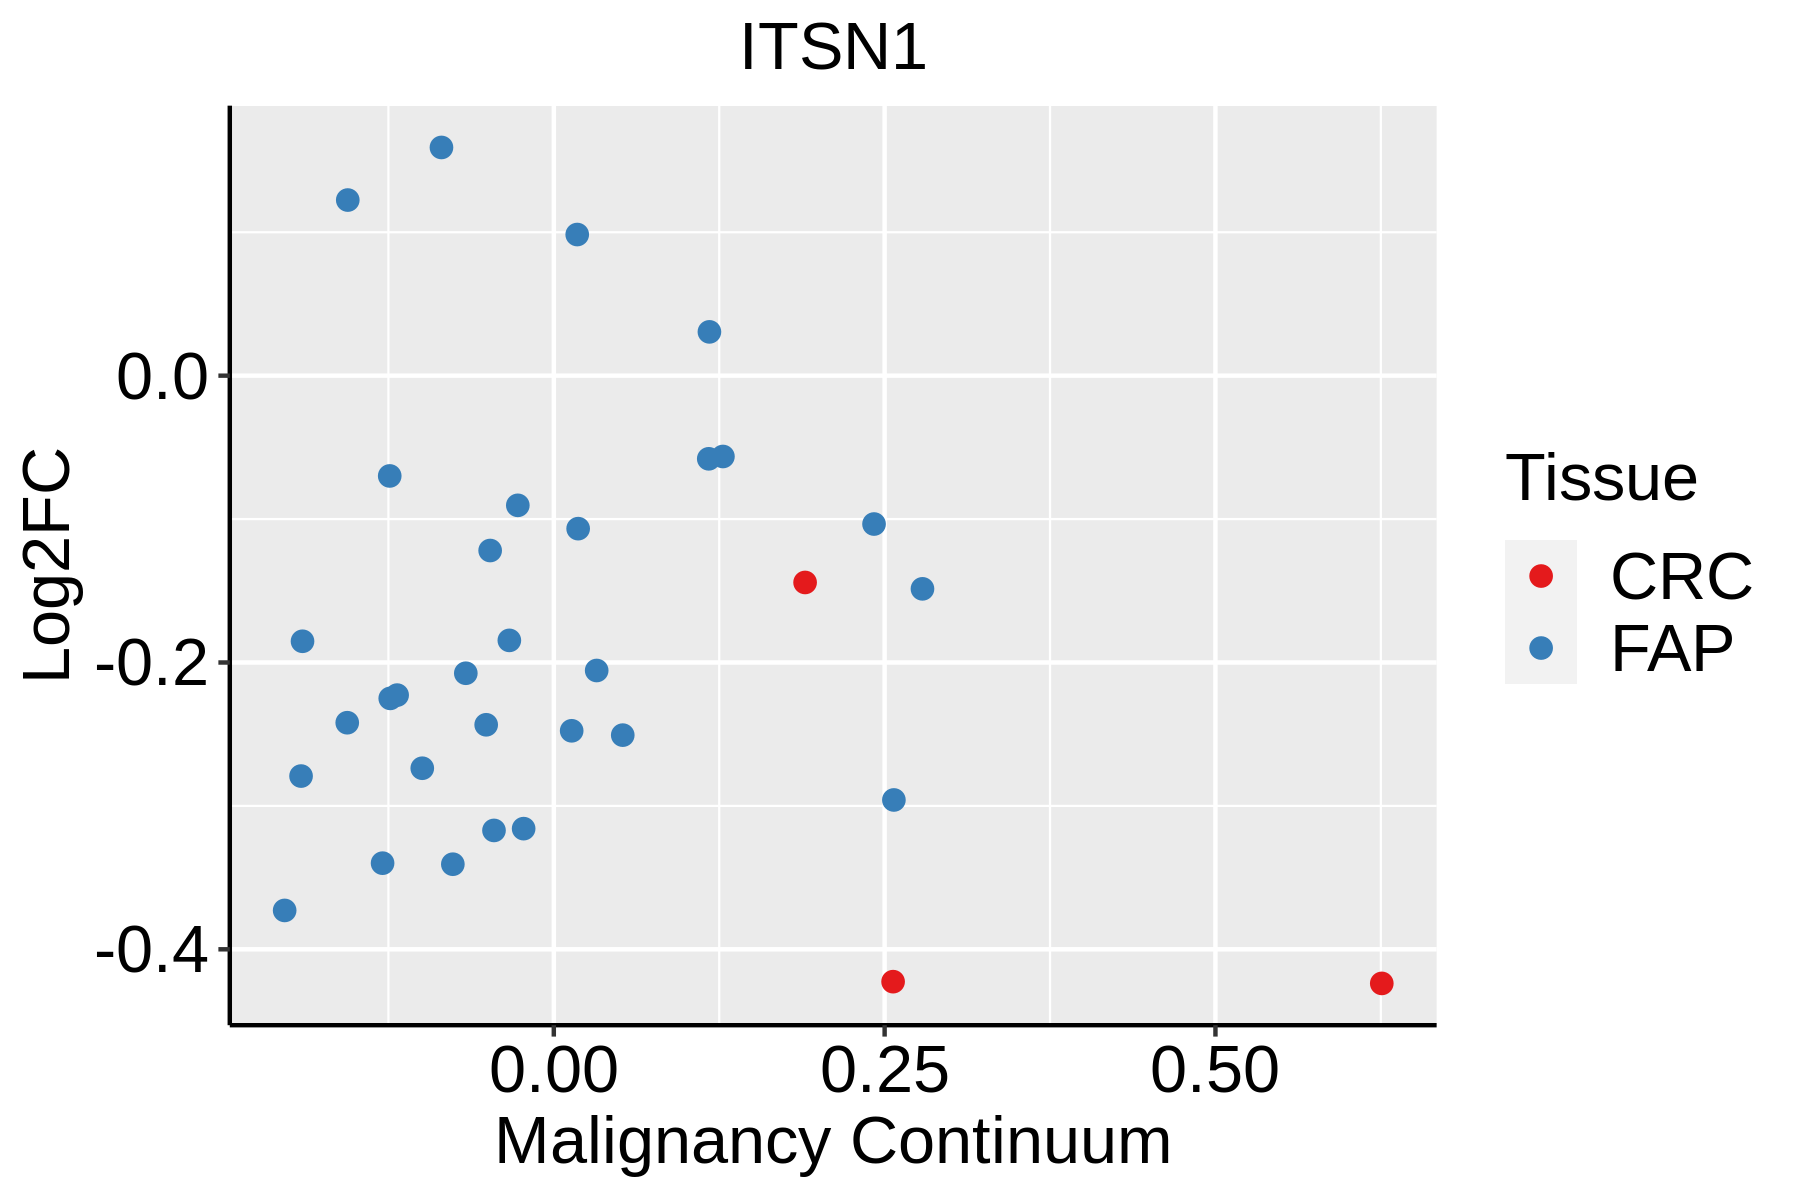 | FAP: Familial adenomatous polyposis |
| CRC: Colorectal cancer | ||
| Colorectum (HTA11) | 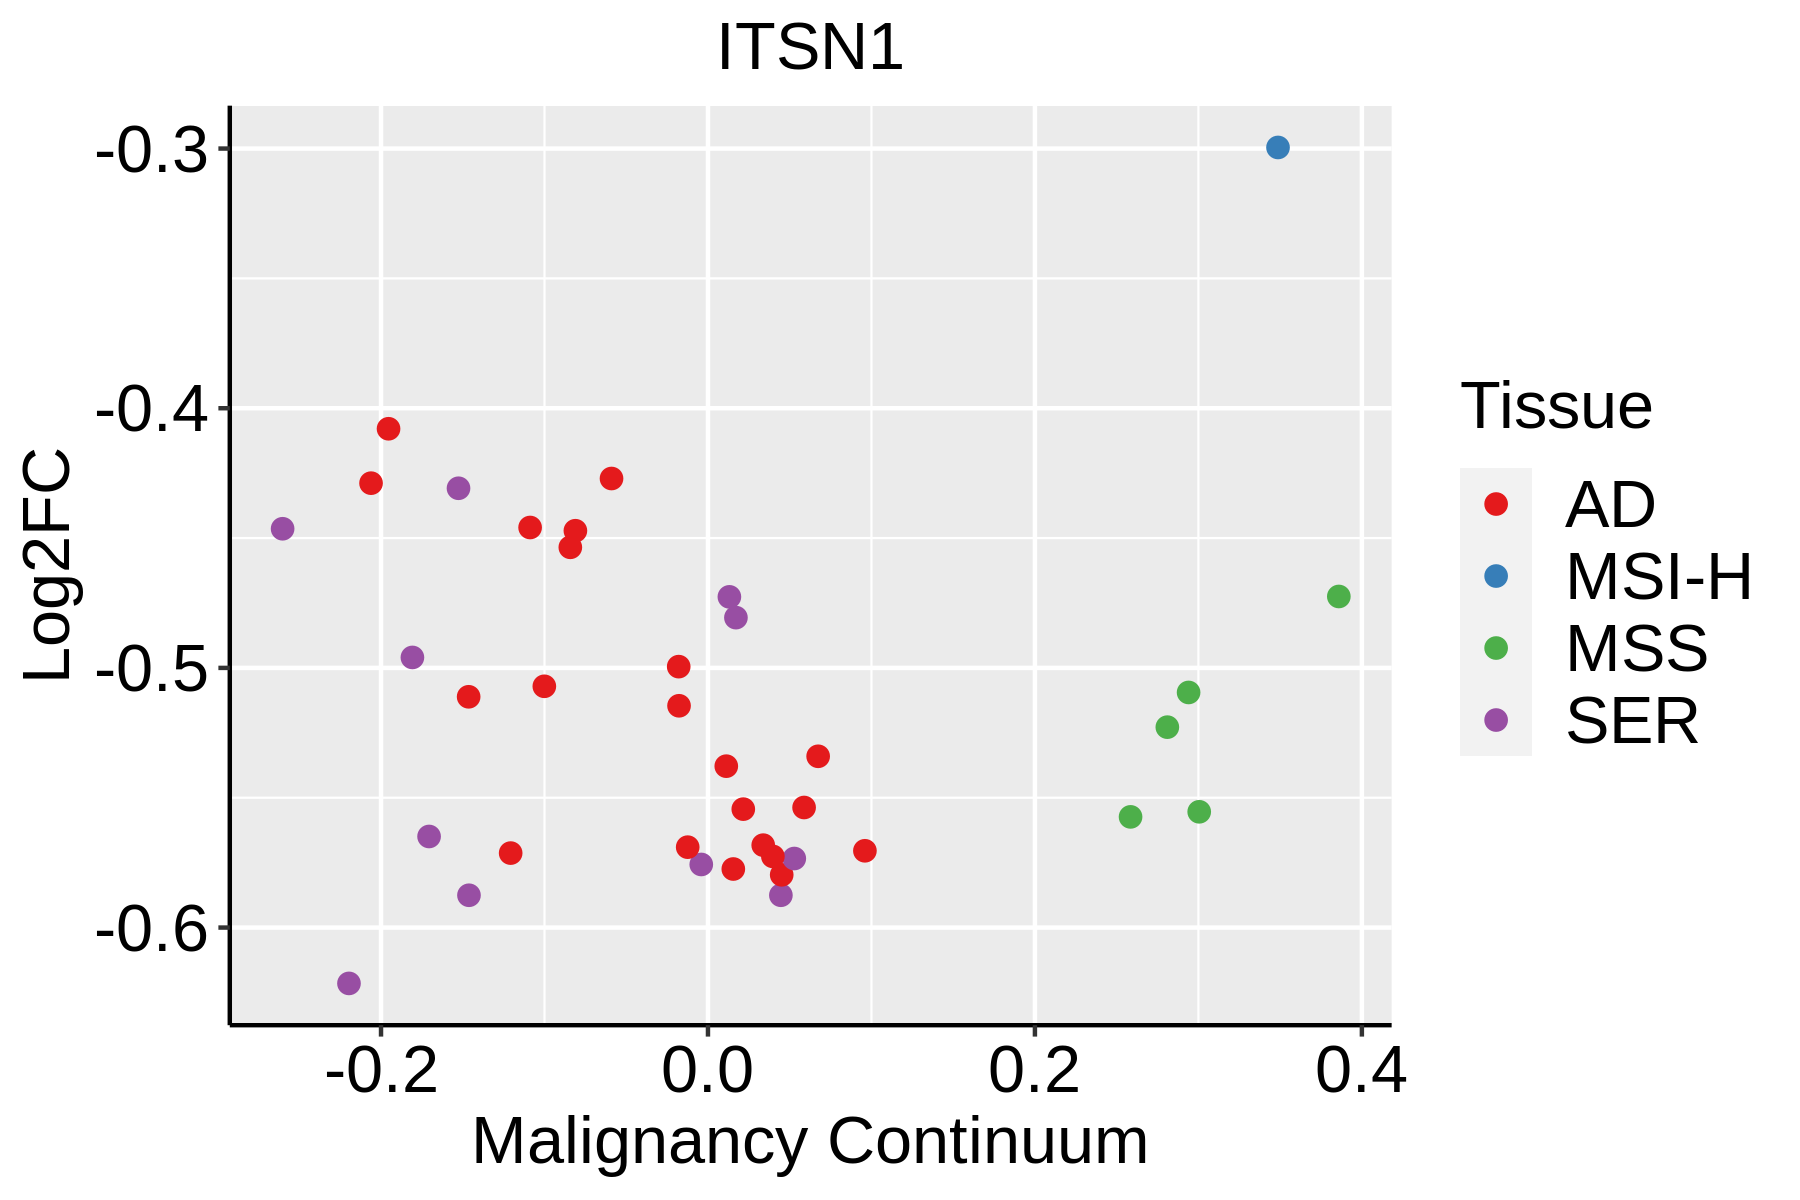 | AD: Adenomas |
| SER: Sessile serrated lesions | ||
| MSI-H: Microsatellite-high colorectal cancer | ||
| MSS: Microsatellite stable colorectal cancer | ||
| Esophagus | 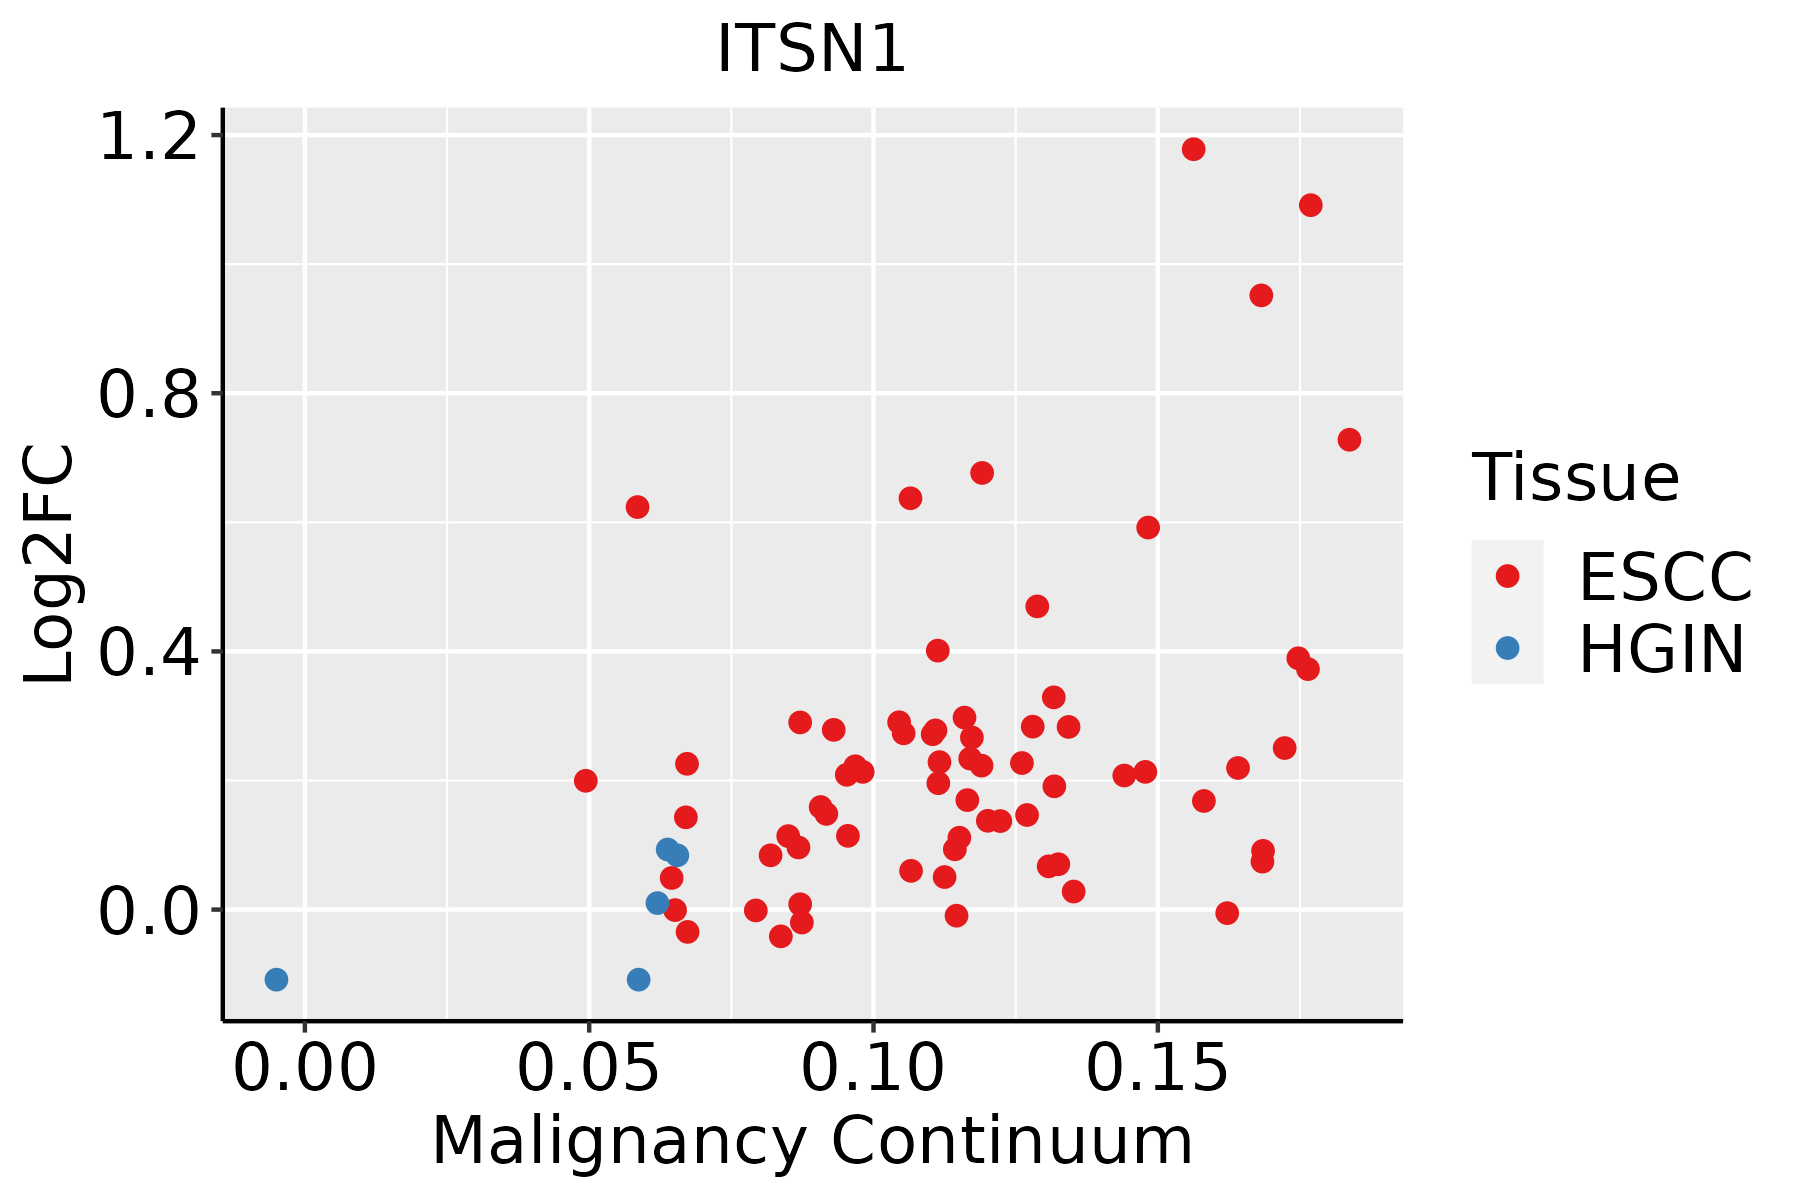 | ESCC: Esophageal squamous cell carcinoma |
| HGIN: High-grade intraepithelial neoplasias | ||
| LGIN: Low-grade intraepithelial neoplasias | ||
| Liver | 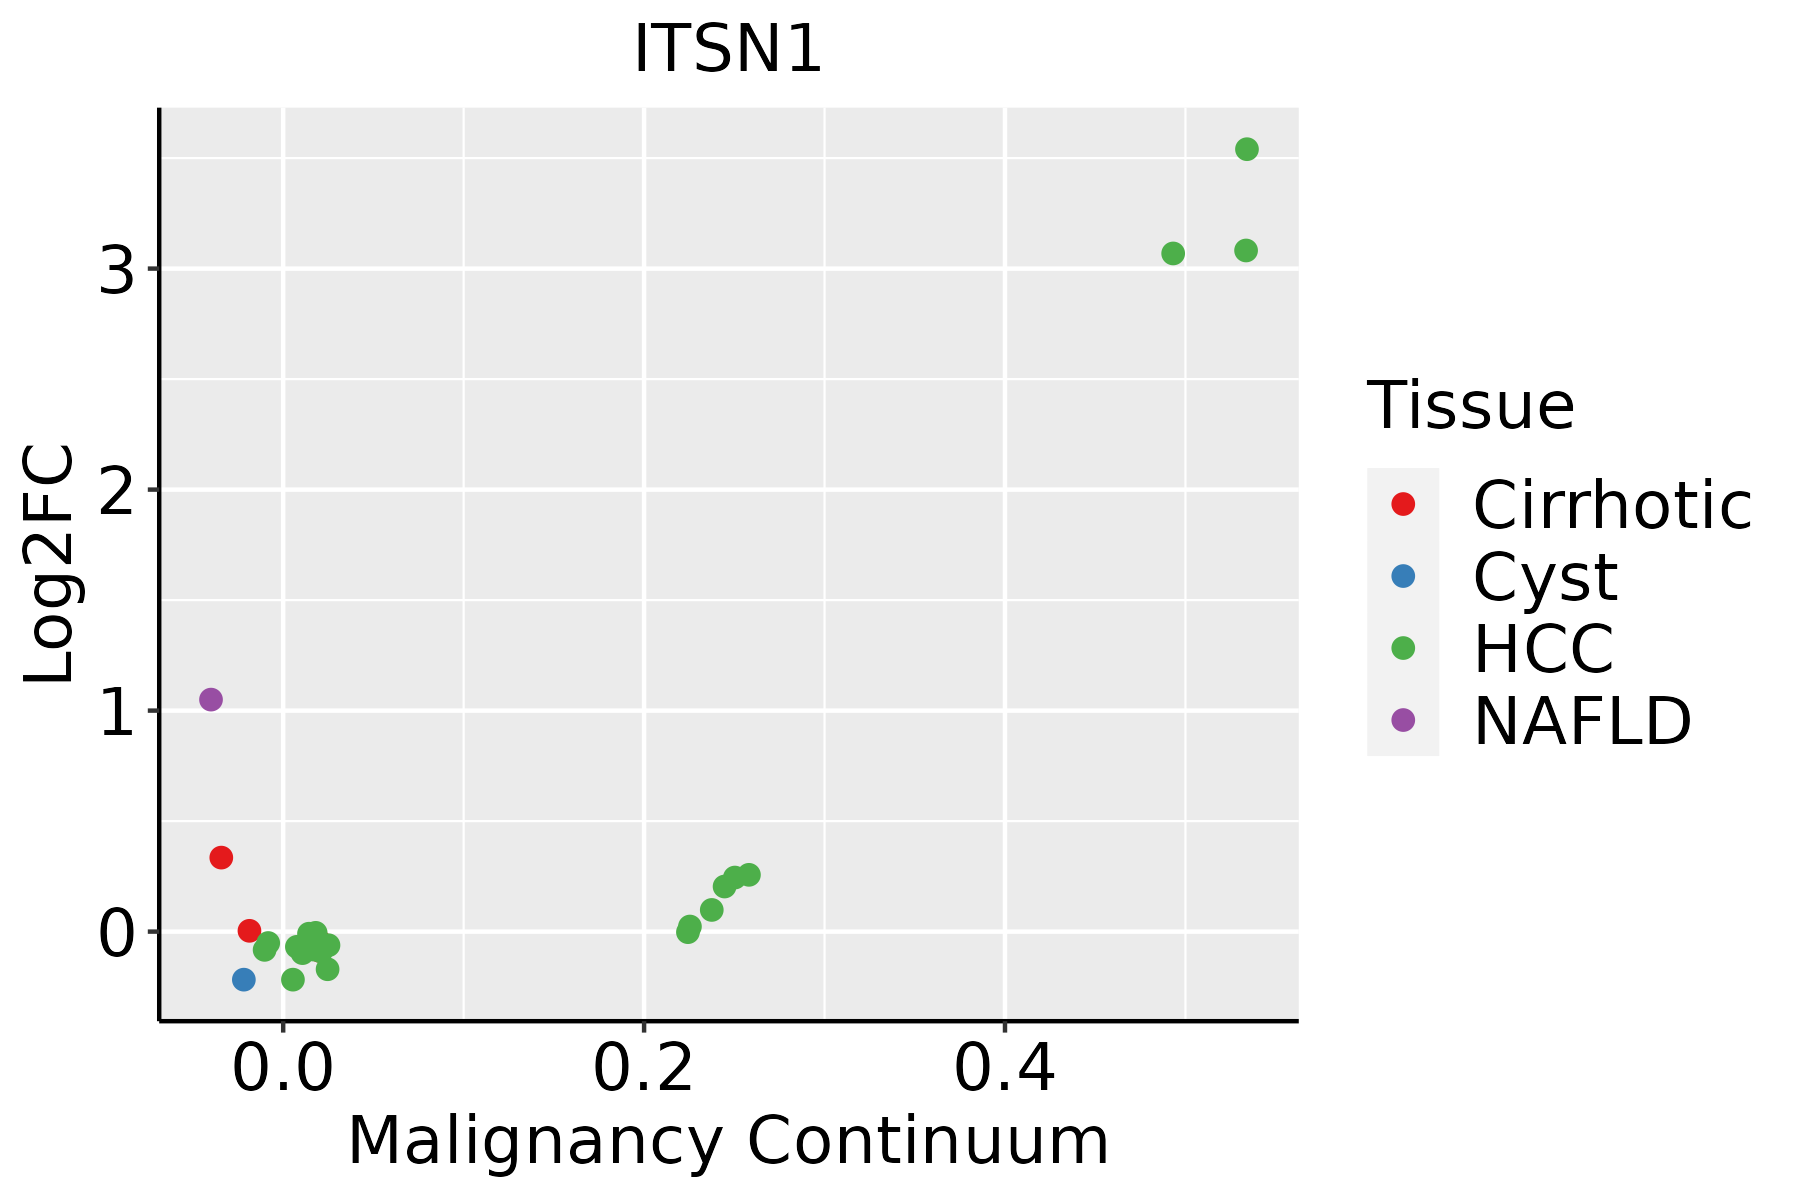 | HCC: Hepatocellular carcinoma |
| NAFLD: Non-alcoholic fatty liver disease | ||
| Lung | 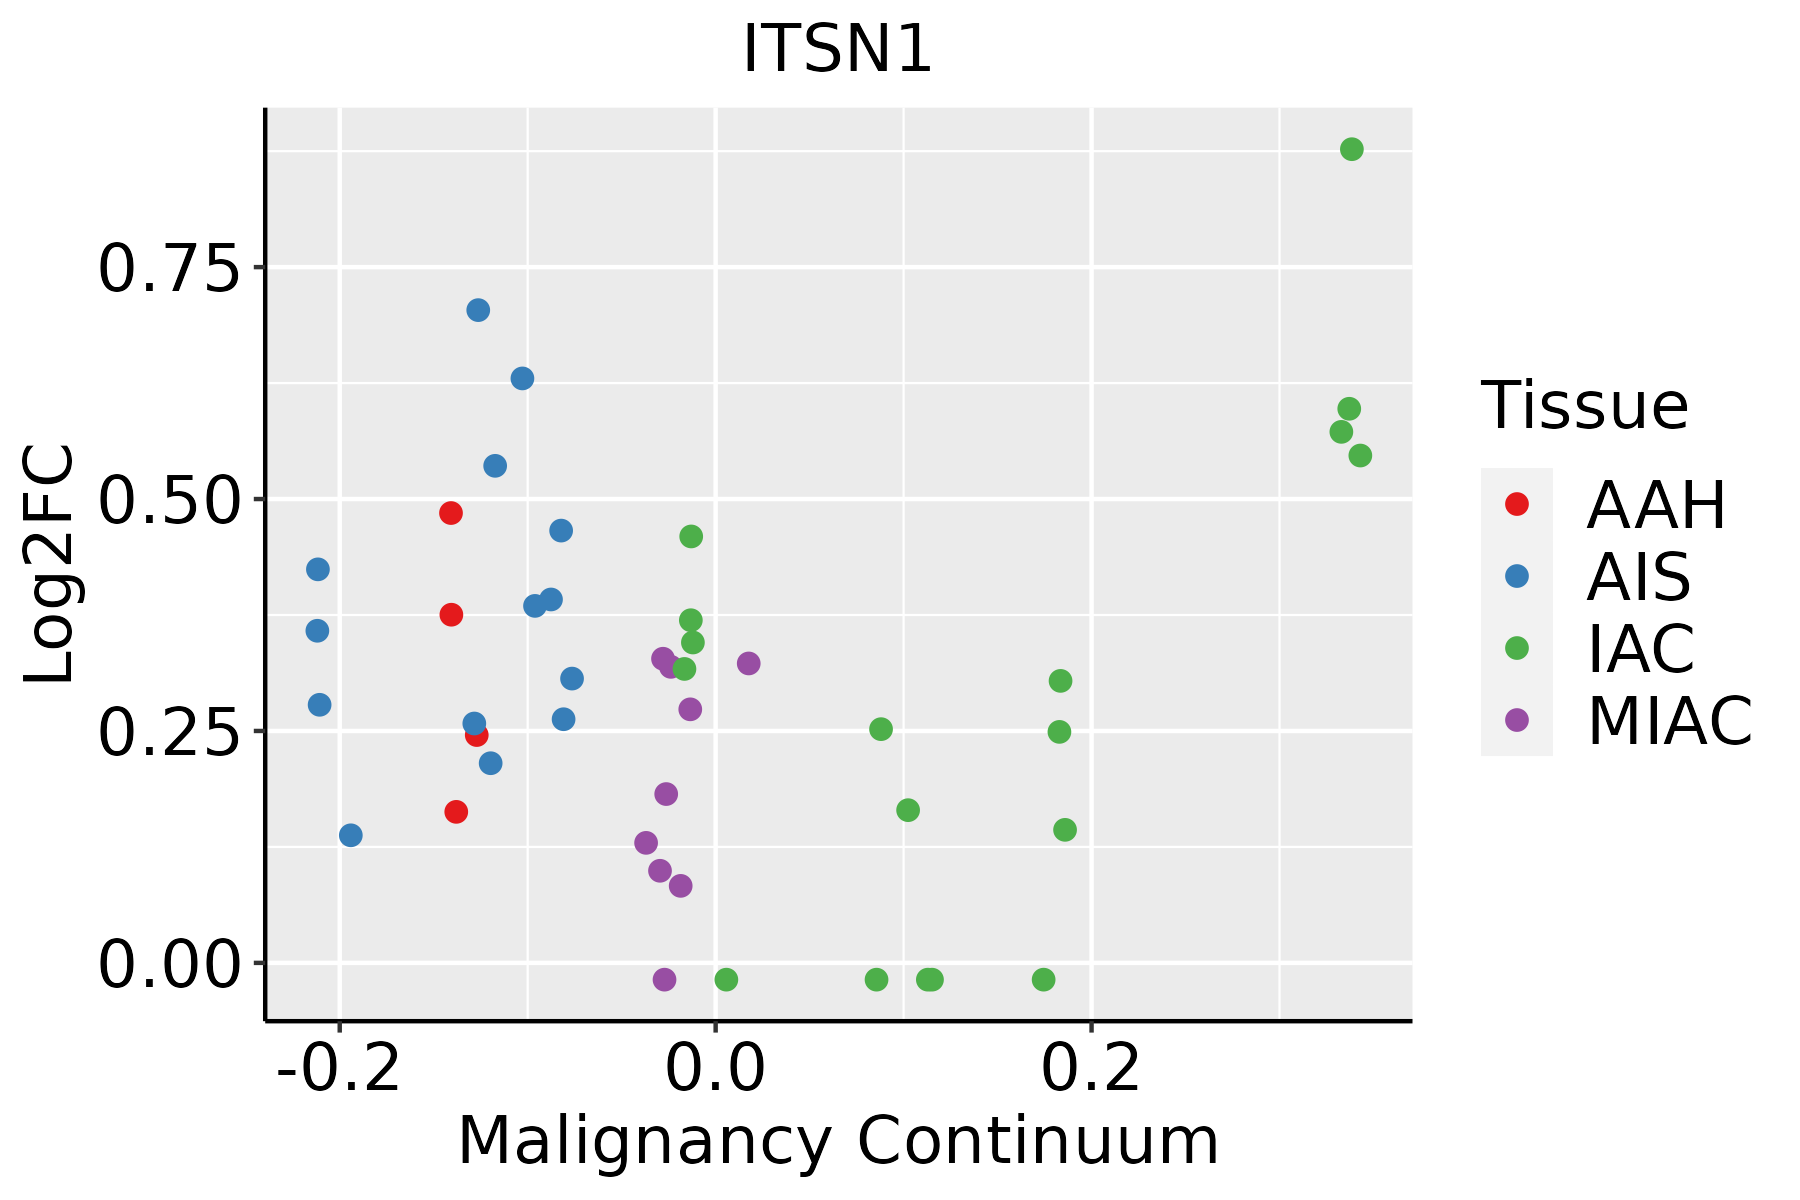 | AAH: Atypical adenomatous hyperplasia |
| AIS: Adenocarcinoma in situ | ||
| IAC: Invasive lung adenocarcinoma | ||
| MIA: Minimally invasive adenocarcinoma | ||
| Thyroid | 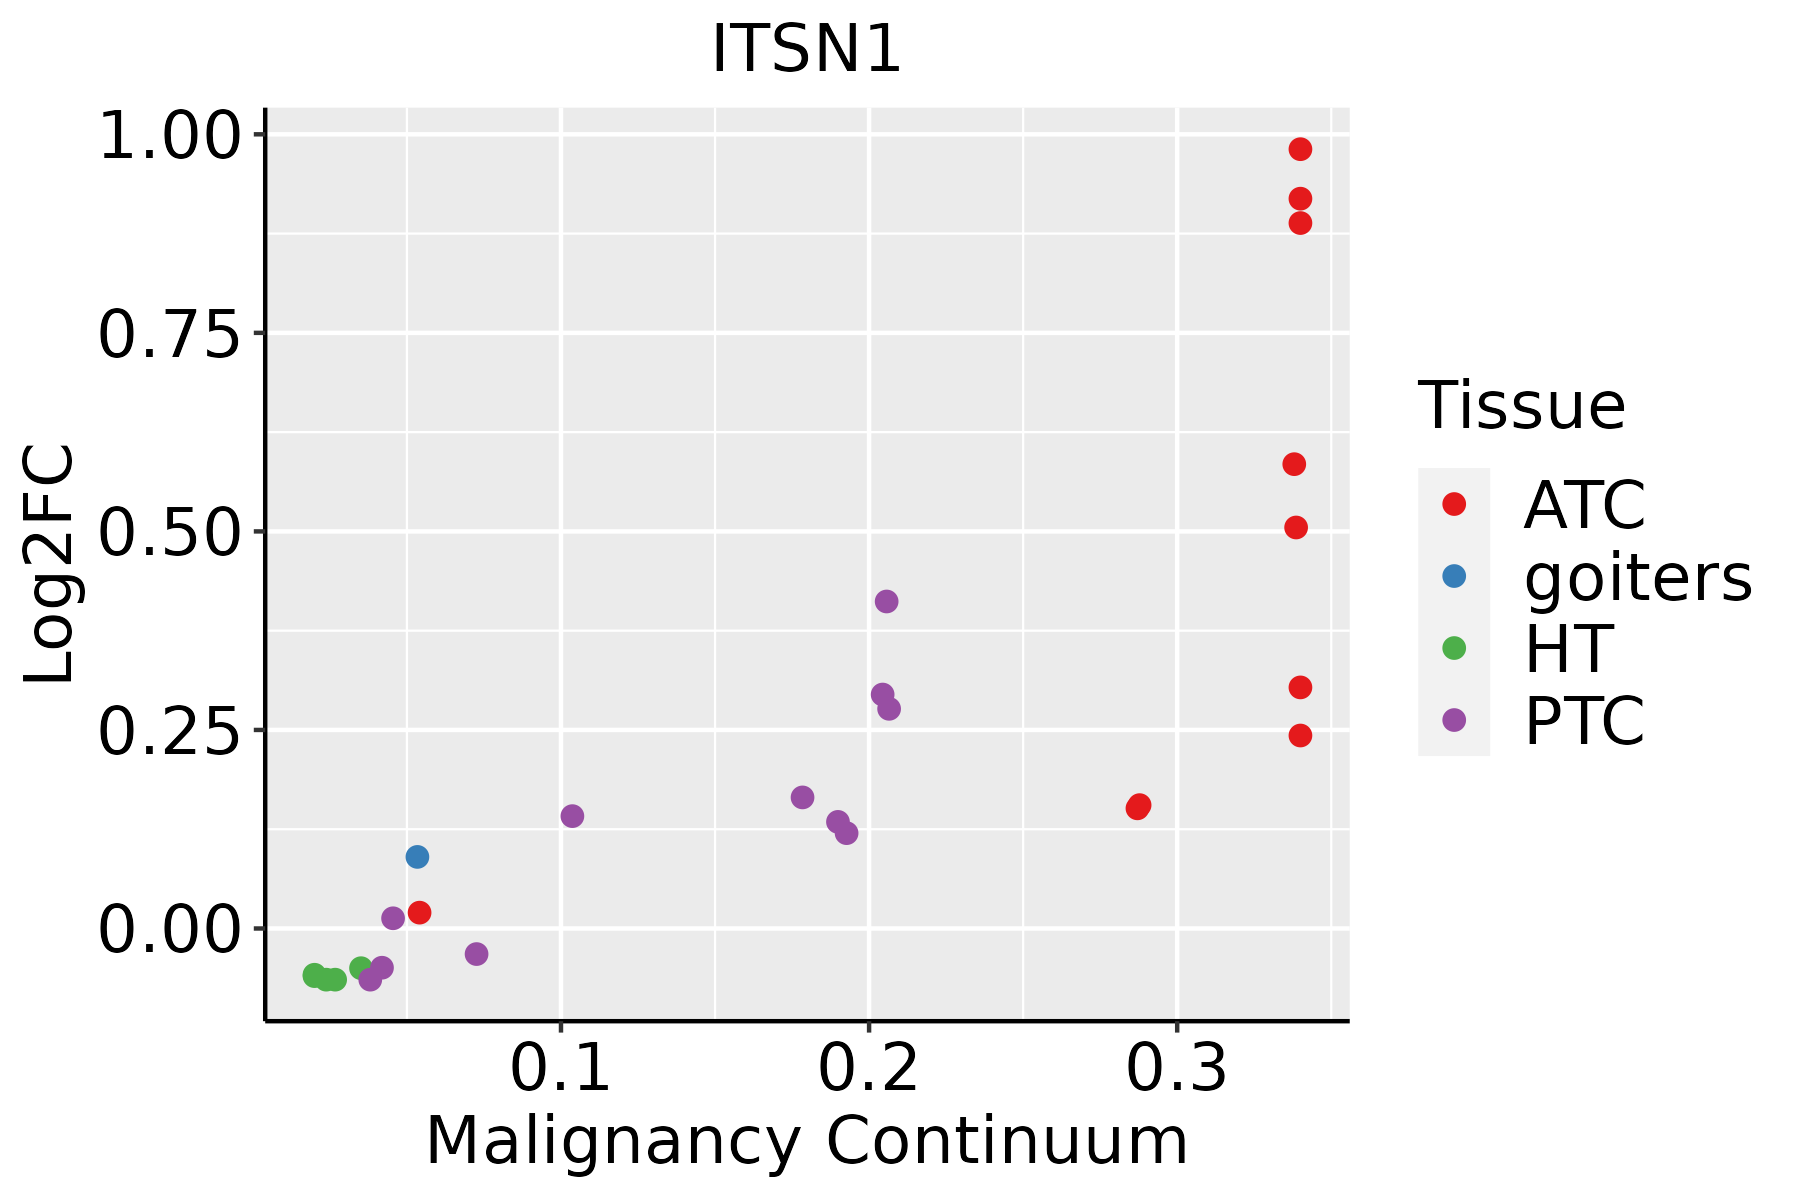 | ATC: Anaplastic thyroid cancer |
| HT: Hashimoto's thyroiditis | ||
| PTC: Papillary thyroid cancer |
| ∗log2FC in expression of this searched gene in stem-like cells from each diseased tissue sample relative to stem-like cells in normal samples in each tissue plotted against the malignancy continuum. Samples are colored based on if they are from different disease stage. |
Top |
Malignant transformation related pathway analysis |
| Find out the enriched GO biological processes and KEGG pathways involved in transition from healthy to precancer to cancer |
| Tissue | Disease Stage | Enriched GO biological Processes |
| Colorectum | AD |  |
| Colorectum | SER |  |
| Colorectum | MSS |  |
| Colorectum | MSI-H |  |
| Colorectum | FAP |  |
| ∗Top 15 enriched GO BP terms are showed in the bar plot of each disease state in each tissue. Each row represents a significant GO biological process which is colored according to the -log10(p.adjust). |
| Page: 1 2 3 4 5 6 7 8 9 |
| GO ID | Tissue | Disease Stage | Description | Gene Ratio | Bg Ratio | pvalue | p.adjust | Count |
| GO:00995631 | Colorectum | FAP | modification of synaptic structure | 11/2622 | 22/18723 | 6.30e-05 | 1.22e-03 | 11 |
| GO:00995041 | Colorectum | FAP | synaptic vesicle cycle | 45/2622 | 181/18723 | 6.73e-05 | 1.28e-03 | 45 |
| GO:00990101 | Colorectum | FAP | modification of postsynaptic structure | 9/2622 | 16/18723 | 9.19e-05 | 1.59e-03 | 9 |
| GO:0023061 | Colorectum | FAP | signal release | 94/2622 | 463/18723 | 1.06e-04 | 1.76e-03 | 94 |
| GO:00510473 | Colorectum | FAP | positive regulation of secretion | 67/2622 | 310/18723 | 1.59e-04 | 2.43e-03 | 67 |
| GO:19035322 | Colorectum | FAP | positive regulation of secretion by cell | 62/2622 | 282/18723 | 1.67e-04 | 2.52e-03 | 62 |
| GO:00158333 | Colorectum | FAP | peptide transport | 58/2622 | 264/18723 | 2.71e-04 | 3.64e-03 | 58 |
| GO:00609961 | Colorectum | FAP | dendritic spine development | 27/2622 | 99/18723 | 3.87e-04 | 4.75e-03 | 27 |
| GO:00902763 | Colorectum | FAP | regulation of peptide hormone secretion | 45/2622 | 196/18723 | 4.66e-04 | 5.41e-03 | 45 |
| GO:00900873 | Colorectum | FAP | regulation of peptide transport | 46/2622 | 202/18723 | 4.91e-04 | 5.66e-03 | 46 |
| GO:00027913 | Colorectum | FAP | regulation of peptide secretion | 45/2622 | 200/18723 | 7.36e-04 | 7.83e-03 | 45 |
| GO:1905244 | Colorectum | FAP | regulation of modification of synaptic structure | 7/2622 | 13/18723 | 8.27e-04 | 8.64e-03 | 7 |
| GO:00300722 | Colorectum | FAP | peptide hormone secretion | 51/2622 | 236/18723 | 9.09e-04 | 9.19e-03 | 51 |
| GO:00428862 | Colorectum | FAP | amide transport | 62/2622 | 301/18723 | 1.01e-03 | 9.93e-03 | 62 |
| GO:00508071 | Colorectum | FAP | regulation of synapse organization | 46/2622 | 211/18723 | 1.30e-03 | 1.20e-02 | 46 |
| GO:00027902 | Colorectum | FAP | peptide secretion | 51/2622 | 242/18723 | 1.62e-03 | 1.43e-02 | 51 |
| GO:0050803 | Colorectum | FAP | regulation of synapse structure or activity | 46/2622 | 218/18723 | 2.59e-03 | 2.03e-02 | 46 |
| GO:0046883 | Colorectum | FAP | regulation of hormone secretion | 50/2622 | 249/18723 | 4.97e-03 | 3.32e-02 | 50 |
| GO:00364651 | Colorectum | FAP | synaptic vesicle recycling | 19/2622 | 75/18723 | 6.44e-03 | 4.01e-02 | 19 |
| GO:0046879 | Colorectum | FAP | hormone secretion | 57/2622 | 295/18723 | 6.67e-03 | 4.12e-02 | 57 |
| Page: 1 2 3 4 5 6 7 8 9 10 11 12 |
| Pathway ID | Tissue | Disease Stage | Description | Gene Ratio | Bg Ratio | pvalue | p.adjust | qvalue | Count |
| Page: 1 |
Top |
Cell-cell communication analysis |
| Identification of potential cell-cell interactions between two cell types and their ligand-receptor pairs for different disease states |
| Ligand | Receptor | LRpair | Pathway | Tissue | Disease Stage |
| Page: 1 |
Top |
Single-cell gene regulatory network inference analysis |
| Find out the significant the regulons (TFs) and the target genes of each regulon across cell types for different disease states |
| TF | Cell Type | Tissue | Disease Stage | Target Gene | RSS | Regulon Activity |
| ∗The dot plots of a searched regulon are shown for all cell subpopulations in each disease state of each tissue based on the regulon specific score inferred using pySCENIC and by calculating the average expression. |
| Page: 1 |
Top |
Somatic mutation of malignant transformation related genes |
| Annotation of somatic variants for genes involved in malignant transformation |
| Hugo Symbol | Variant Class | Variant Classification | dbSNP RS | HGVSc | HGVSp | HGVSp Short | SWISSPROT | BIOTYPE | SIFT | PolyPhen | Tumor Sample Barcode | Tissue | Histology | Sex | Age | Stage | Therapy Types | Drugs | Outcome |
| ITSN1 | SNV | Missense_Mutation | rs759839079 | c.4639C>T | p.Arg1547Cys | p.R1547C | Q15811 | protein_coding | deleterious(0) | probably_damaging(0.998) | TCGA-A8-A09D-01 | Breast | breast invasive carcinoma | Female | <65 | I/II | Chemotherapy | doxorubicin | CR |
| ITSN1 | SNV | Missense_Mutation | c.1762G>A | p.Glu588Lys | p.E588K | Q15811 | protein_coding | tolerated(0.45) | possibly_damaging(0.585) | TCGA-AC-A23H-01 | Breast | breast invasive carcinoma | Female | >=65 | I/II | Unknown | Unknown | PD | |
| ITSN1 | SNV | Missense_Mutation | rs772284990 | c.3008N>T | p.Ser1003Leu | p.S1003L | Q15811 | protein_coding | tolerated(0.22) | benign(0.005) | TCGA-AN-A046-01 | Breast | breast invasive carcinoma | Female | >=65 | I/II | Unknown | Unknown | SD |
| ITSN1 | SNV | Missense_Mutation | novel | c.4542N>C | p.Lys1514Asn | p.K1514N | Q15811 | protein_coding | deleterious(0) | possibly_damaging(0.782) | TCGA-AN-A046-01 | Breast | breast invasive carcinoma | Female | >=65 | I/II | Unknown | Unknown | SD |
| ITSN1 | SNV | Missense_Mutation | rs187930521 | c.4273N>T | p.Arg1425Trp | p.R1425W | Q15811 | protein_coding | deleterious(0) | probably_damaging(0.965) | TCGA-AR-A0TR-01 | Breast | breast invasive carcinoma | Female | >=65 | I/II | Hormone Therapy | tamoxiphen | SD |
| ITSN1 | SNV | Missense_Mutation | c.255N>G | p.Ile85Met | p.I85M | Q15811 | protein_coding | deleterious(0) | probably_damaging(0.998) | TCGA-BH-A0EE-01 | Breast | breast invasive carcinoma | Female | >=65 | I/II | Chemotherapy | docetaxel | SD | |
| ITSN1 | SNV | Missense_Mutation | c.2551G>A | p.Ala851Thr | p.A851T | Q15811 | protein_coding | tolerated(0.17) | probably_damaging(0.996) | TCGA-BH-A18G-01 | Breast | breast invasive carcinoma | Female | >=65 | I/II | Unknown | Unknown | SD | |
| ITSN1 | SNV | Missense_Mutation | c.2369N>G | p.Lys790Arg | p.K790R | Q15811 | protein_coding | tolerated(0.77) | benign(0.268) | TCGA-D8-A1XQ-01 | Breast | breast invasive carcinoma | Female | >=65 | I/II | Unknown | Unknown | SD | |
| ITSN1 | SNV | Missense_Mutation | c.443N>G | p.Ser148Cys | p.S148C | Q15811 | protein_coding | deleterious(0.02) | benign(0.439) | TCGA-D8-A27G-01 | Breast | breast invasive carcinoma | Female | >=65 | I/II | Unknown | Unknown | SD | |
| ITSN1 | SNV | Missense_Mutation | rs765293456 | c.2500G>A | p.Ala834Thr | p.A834T | Q15811 | protein_coding | tolerated(0.62) | benign(0.029) | TCGA-E2-A14T-01 | Breast | breast invasive carcinoma | Female | <65 | I/II | Chemotherapy | doxorubicin | SD |
| Page: 1 2 3 4 5 6 7 8 9 10 11 12 13 14 15 16 17 18 19 20 21 22 |
Top |
Related drugs of malignant transformation related genes |
| Identification of chemicals and drugs interact with genes involved in malignant transfromation |
| (DGIdb 4.0) |
| Entrez ID | Symbol | Category | Interaction Types | Drug Claim Name | Drug Name | PMIDs |
| Page: 1 |

Copyright 2023-Present -The University of Texas Health Science Center at Houston |