Schematic overview of the cellular and molecular mechanisms involved in the cancer progression, including the proposed cellular and molecular mechanisms in cancer cells trajectory. AT1: alveolar type 1 cells; AT2: alveolar type 2 cells; AAH: atypical adenomatous hyperplasia; AIS: adenocarcinoma in situ; MIA: minimally invasive adenocarcinoma; IA: invasive adenocarcinoma; EMT: epithelial-mesenchymal transition

Home

Download

Statistics

Help

Contact

Center for Computational Systems Medicine
leaf

Gene summary

leaf

Malignant transformation analysis

leaf

Malignant transformation related pathway analysis

leaf

Cell-cell communication analysis

leaf

Single-cell gene regulatory network inference analysis

leaf

Somatic mutation of malignant transformation related genes

leaf

Related drugs of malignant transformation related genes

Gene: ILF3

Gene summary for ILF3

check button Gene summary.

Gene informationSpeciesHuman
Gene symbol

ILF3

Gene ID

3609

Gene nameinterleukin enhancer binding factor 3
Gene AliasCBTF
Cytomap19p13.2
Gene Typeprotein-coding
GO ID

GO:0002376

UniProtAcc

Q12906


Top

Malignant transformation analysis

check button Identification of the aberrant gene expression in precancerous and cancerous lesions by comparing the gene expression of stem-like cells in diseased tissues with normal stem cells
check button Malignant transformation involving gene list.
Entrez IDSymbolReplicatesSpeciesOrganTissueAdj P-valueLog2FCMalignancy
3609ILF3HTA11_3410_2000001011HumanColorectumAD2.74e-02-1.97e-010.0155
3609ILF3HTA11_6818_2000001021HumanColorectumAD1.61e-023.28e-020.0588
3609ILF3HTA11_99999970781_79442HumanColorectumMSS1.90e-135.94e-010.294
3609ILF3HTA11_99999971662_82457HumanColorectumMSS7.62e-034.21e-010.3859
3609ILF3A015-C-203HumanColorectumFAP1.82e-181.21e-01-0.1294
3609ILF3A002-C-201HumanColorectumFAP2.11e-031.03e-010.0324
3609ILF3A001-C-119HumanColorectumFAP9.24e-032.94e-01-0.1557
3609ILF3A001-C-108HumanColorectumFAP4.83e-122.91e-01-0.0272
3609ILF3A002-C-021HumanColorectumFAP1.86e-043.44e-010.1171
3609ILF3A002-C-205HumanColorectumFAP1.52e-112.50e-01-0.1236
3609ILF3A014-C-108HumanColorectumFAP5.89e-065.07e-01-0.124
3609ILF3A001-C-104HumanColorectumFAP3.90e-104.77e-010.0184
3609ILF3A015-C-006HumanColorectumFAP1.95e-134.93e-01-0.0994
3609ILF3A015-C-106HumanColorectumFAP6.29e-133.69e-01-0.0511
3609ILF3A002-C-114HumanColorectumFAP1.02e-102.74e-01-0.1561
3609ILF3A015-C-104HumanColorectumFAP3.95e-273.81e-01-0.1899
3609ILF3A015-C-202HumanColorectumFAP8.34e-053.80e-01-0.0849
3609ILF3A001-C-014HumanColorectumFAP3.71e-061.40e-020.0135
3609ILF3A002-C-016HumanColorectumFAP1.30e-08-1.67e-010.0521
3609ILF3A015-C-002HumanColorectumFAP2.57e-041.97e-01-0.0763
Page: 1 2 3 4 5 6 7 8 9 10 

check button Transcriptomic changes along malignancy continuum.
TissueExpression DynamicsAbbreviation
Colorectum (GSE201348)The image shows the transcriptomic changes along malignancy continuum.log2FC in expression of this searched gene in stem-like cells from each diseased tissue sample relative to stem-like cells in normal samples in each tissue plotted against the malignancy continuum. Samples are colored based on if they are from different disease stage.
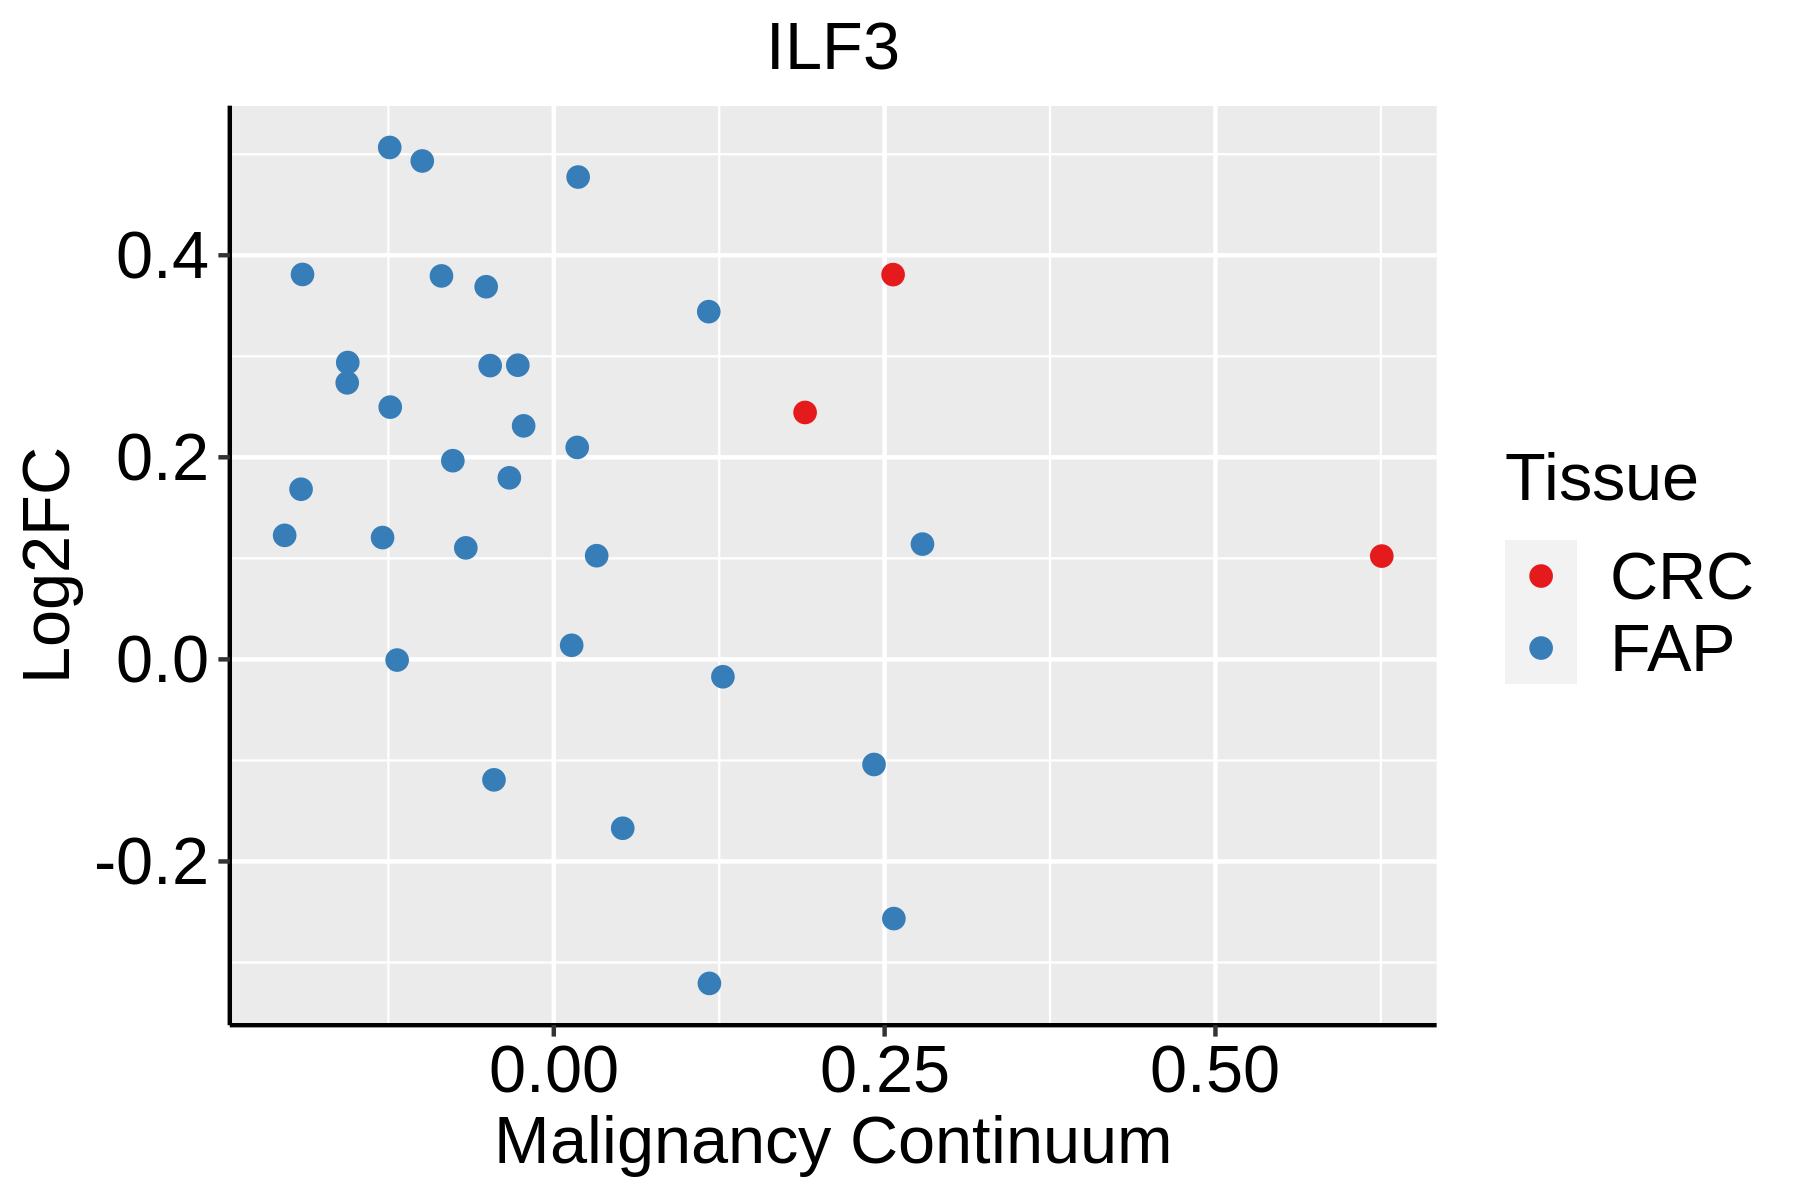
FAP: Familial adenomatous polyposis
CRC: Colorectal cancer
Colorectum (HTA11)The image shows the transcriptomic changes along malignancy continuum.log2FC in expression of this searched gene in stem-like cells from each diseased tissue sample relative to stem-like cells in normal samples in each tissue plotted against the malignancy continuum. Samples are colored based on if they are from different disease stage.AD: Adenomas
SER: Sessile serrated lesions
MSI-H: Microsatellite-high colorectal cancer
MSS: Microsatellite stable colorectal cancer
EsophagusThe image shows the transcriptomic changes along malignancy continuum.log2FC in expression of this searched gene in stem-like cells from each diseased tissue sample relative to stem-like cells in normal samples in each tissue plotted against the malignancy continuum. Samples are colored based on if they are from different disease stage.
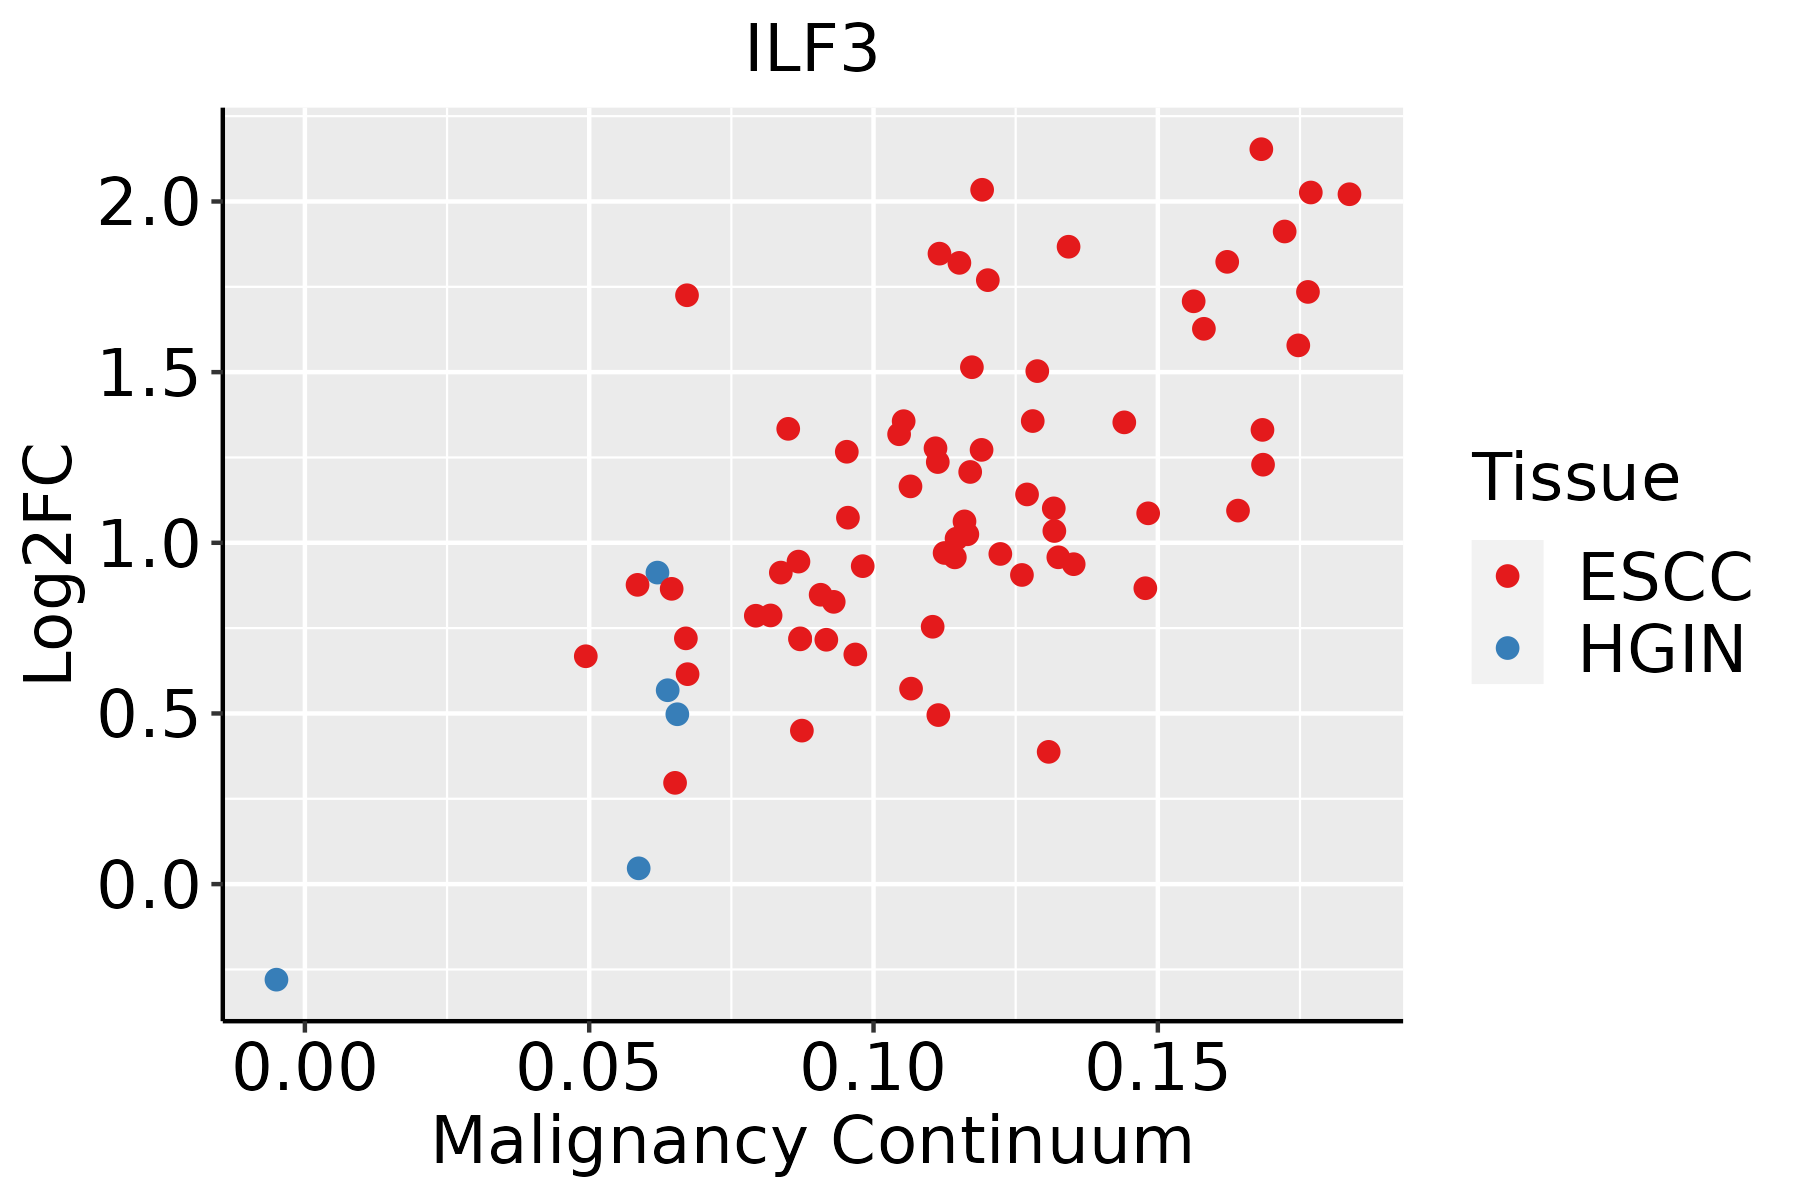
ESCC: Esophageal squamous cell carcinoma
HGIN: High-grade intraepithelial neoplasias
LGIN: Low-grade intraepithelial neoplasias
LiverThe image shows the transcriptomic changes along malignancy continuum.log2FC in expression of this searched gene in stem-like cells from each diseased tissue sample relative to stem-like cells in normal samples in each tissue plotted against the malignancy continuum. Samples are colored based on if they are from different disease stage.
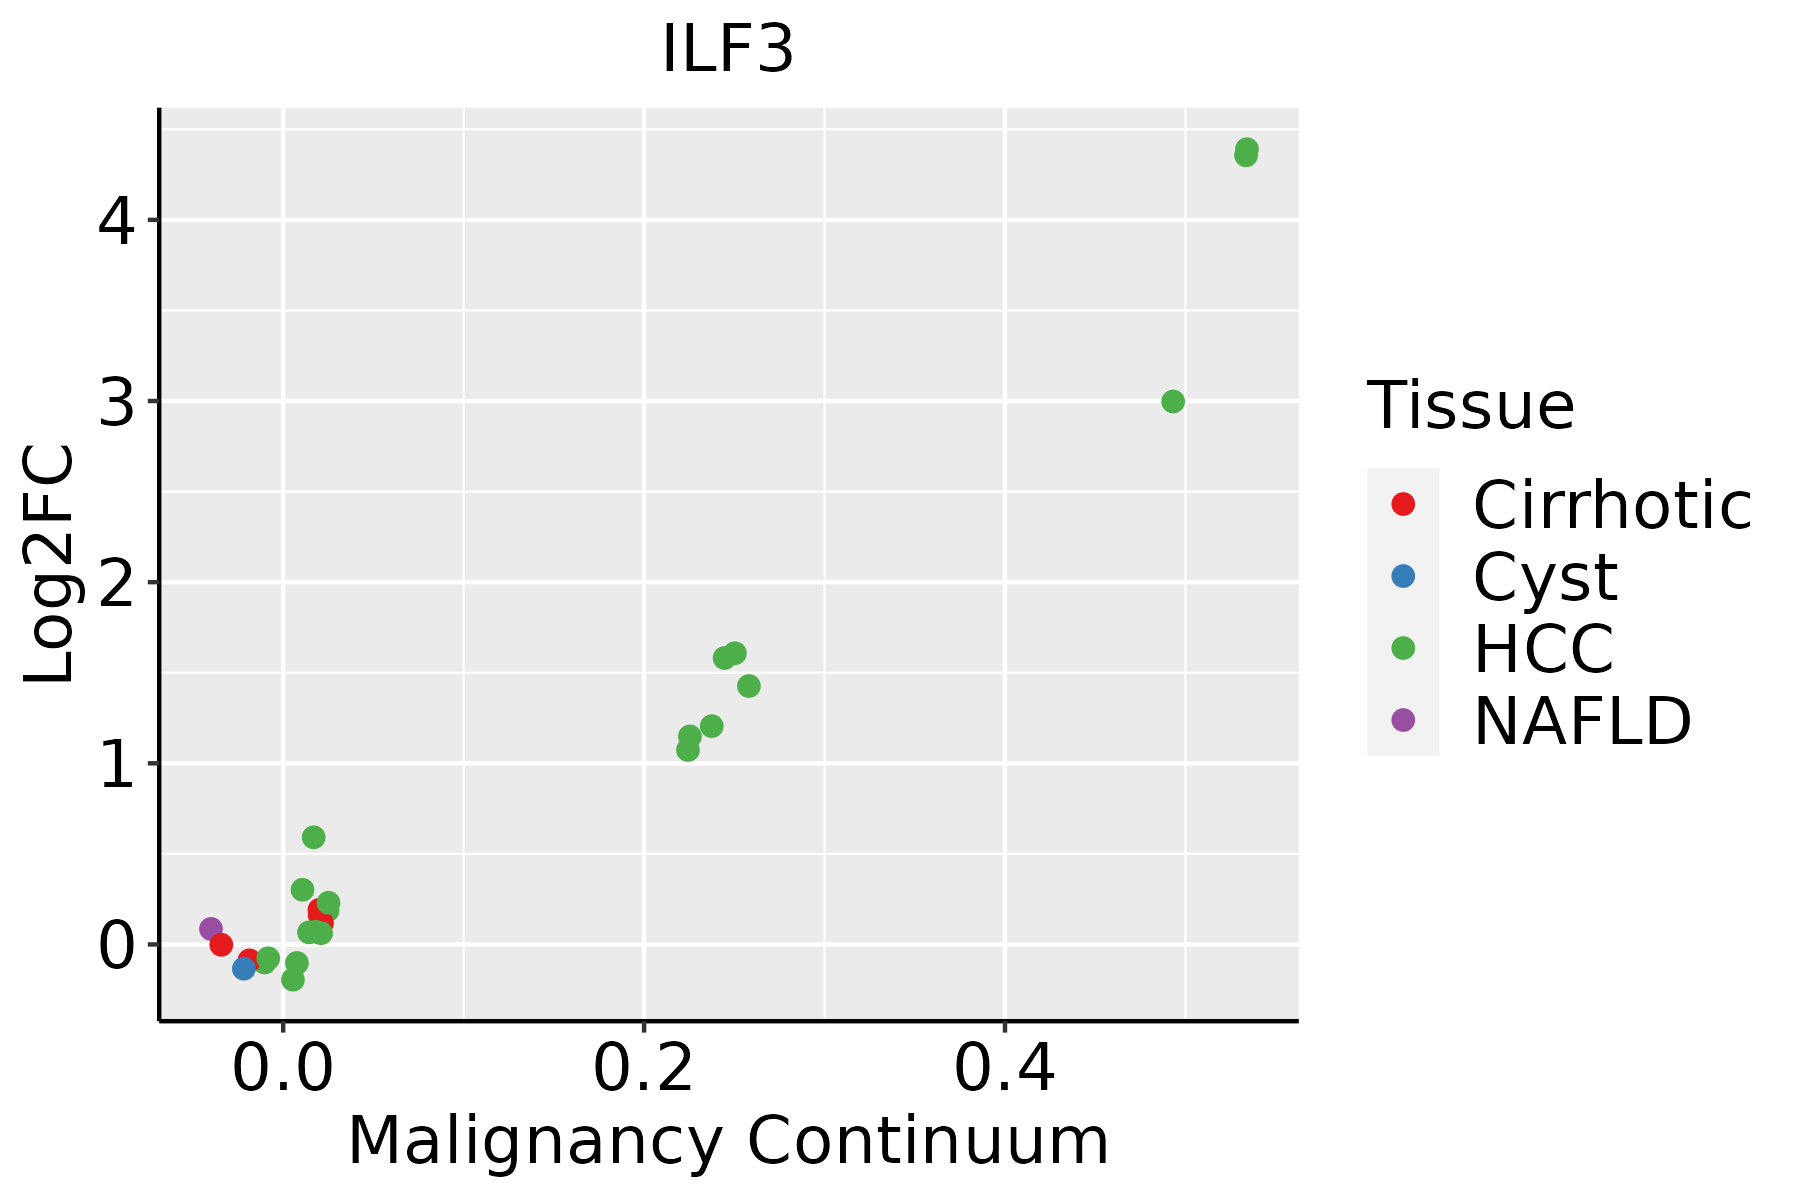
HCC: Hepatocellular carcinoma
NAFLD: Non-alcoholic fatty liver disease
Oral CavityThe image shows the transcriptomic changes along malignancy continuum.log2FC in expression of this searched gene in stem-like cells from each diseased tissue sample relative to stem-like cells in normal samples in each tissue plotted against the malignancy continuum. Samples are colored based on if they are from different disease stage.EOLP: Erosive Oral lichen planus
LP: leukoplakia
NEOLP: Non-erosive oral lichen planus
OSCC: Oral squamous cell carcinoma
ProstateThe image shows the transcriptomic changes along malignancy continuum.log2FC in expression of this searched gene in stem-like cells from each diseased tissue sample relative to stem-like cells in normal samples in each tissue plotted against the malignancy continuum. Samples are colored based on if they are from different disease stage.BPH: Benign Prostatic Hyperplasia
SkinThe image shows the transcriptomic changes along malignancy continuum.log2FC in expression of this searched gene in stem-like cells from each diseased tissue sample relative to stem-like cells in normal samples in each tissue plotted against the malignancy continuum. Samples are colored based on if they are from different disease stage.
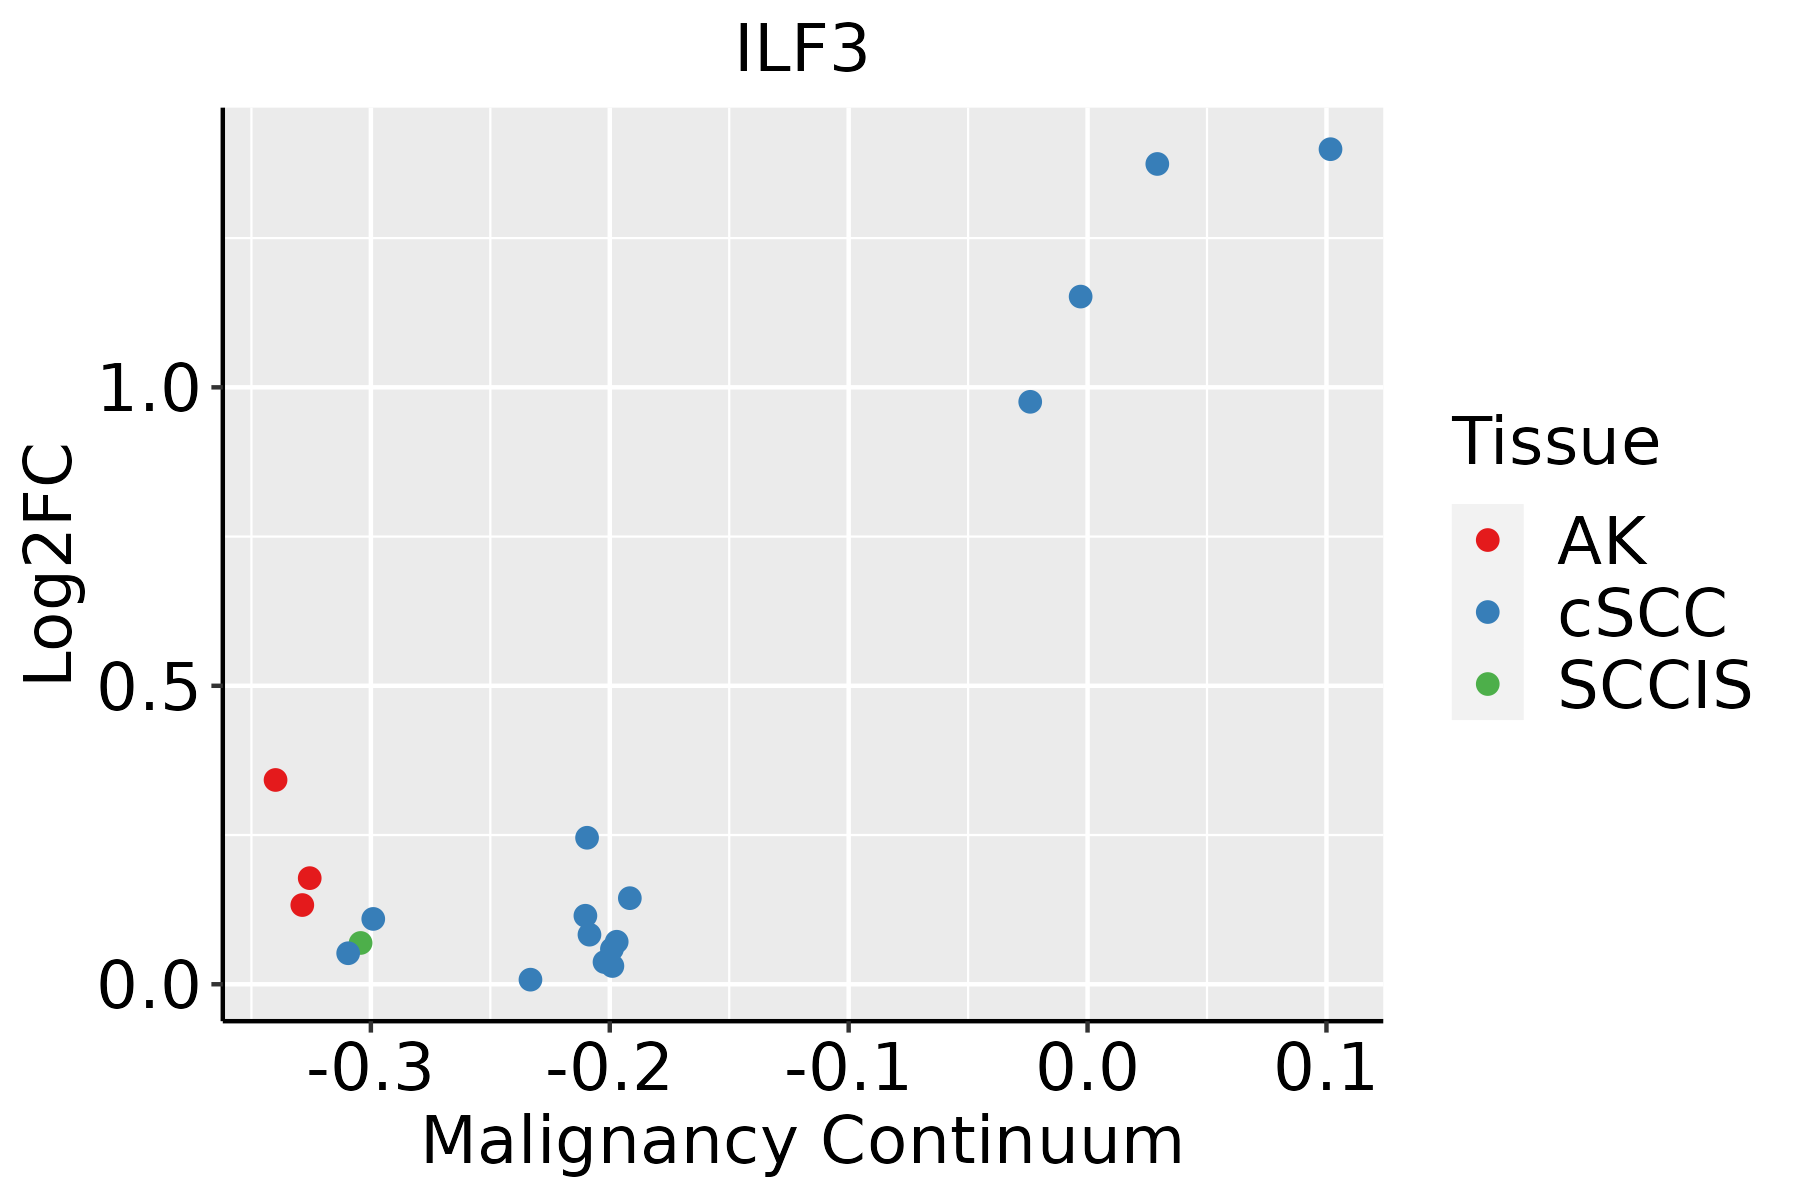
AK: Actinic keratosis
cSCC: Cutaneous squamous cell carcinoma
SCCIS:squamous cell carcinoma in situ
ThyroidThe image shows the transcriptomic changes along malignancy continuum.log2FC in expression of this searched gene in stem-like cells from each diseased tissue sample relative to stem-like cells in normal samples in each tissue plotted against the malignancy continuum. Samples are colored based on if they are from different disease stage.ATC: Anaplastic thyroid cancer
HT: Hashimoto's thyroiditis
PTC: Papillary thyroid cancer
∗log2FC in expression of this searched gene in stem-like cells from each diseased tissue sample relative to stem-like cells in normal samples in each tissue plotted against the malignancy continuum. Samples are colored based on if they are from different disease stage.

Top

Malignant transformation related pathway analysis

check buttonFind out the enriched GO biological processes and KEGG pathways involved in transition from healthy to precancer to cancer
check button Figure of enriched GO biological processes.
TissueDisease StageEnriched GO biological Processes
ColorectumADGO analysis - Figure of enriched GO biological processes: Top 15 enriched GO BP terms are showed in the bar plot of each disease state in each tissue. Each row represents a significant GO biological process which is colored according to the -log10(p.adjust).
ColorectumSERGO analysis - Figure of enriched GO biological processes: Top 15 enriched GO BP terms are showed in the bar plot of each disease state in each tissue. Each row represents a significant GO biological process which is colored according to the -log10(p.adjust).
ColorectumMSSGO analysis - Figure of enriched GO biological processes: Top 15 enriched GO BP terms are showed in the bar plot of each disease state in each tissue. Each row represents a significant GO biological process which is colored according to the -log10(p.adjust).
ColorectumMSI-HGO analysis - Figure of enriched GO biological processes: Top 15 enriched GO BP terms are showed in the bar plot of each disease state in each tissue. Each row represents a significant GO biological process which is colored according to the -log10(p.adjust).
ColorectumFAPGO analysis - Figure of enriched GO biological processes: Top 15 enriched GO BP terms are showed in the bar plot of each disease state in each tissue. Each row represents a significant GO biological process which is colored according to the -log10(p.adjust).
∗Top 15 enriched GO BP terms are showed in the bar plot of each disease state in each tissue. Each row represents a significant GO biological process which is colored according to the -log10(p.adjust).
Page: 1 2 3 4 5 6 7 8 9 

check button Enriched GO biological processes.
GO IDTissueDisease StageDescriptionGene RatioBg Ratiopvaluep.adjustCount
GO:004506922LiverHCCregulation of viral genome replication59/795885/187234.66e-077.61e-0659
GO:00516071LiverHCCdefense response to virus151/7958265/187231.27e-061.85e-05151
GO:01405461LiverHCCdefense response to symbiont151/7958265/187231.27e-061.85e-05151
GO:004852511LiverHCCnegative regulation of viral process59/795892/187232.28e-052.41e-0459
GO:003424921LiverHCCnegative regulation of cellular amide metabolic process144/7958273/187233.80e-042.61e-03144
GO:001714821LiverHCCnegative regulation of translation129/7958245/187238.14e-044.87e-03129
GO:00450711LiverHCCnegative regulation of viral genome replication35/795856/187232.00e-031.01e-0235
GO:001603220Oral cavityOSCCviral process274/7305415/187232.42e-291.70e-26274
GO:001905820Oral cavityOSCCviral life cycle208/7305317/187234.59e-221.00e-19208
GO:000641720Oral cavityOSCCregulation of translation274/7305468/187234.39e-184.63e-16274
GO:001907920Oral cavityOSCCviral genome replication95/7305131/187236.35e-154.02e-1395
GO:000961515Oral cavityOSCCresponse to virus215/7305367/187231.63e-149.41e-13215
GO:005079220Oral cavityOSCCregulation of viral process109/7305164/187238.95e-134.10e-11109
GO:190390020Oral cavityOSCCregulation of viral life cycle97/7305148/187235.34e-111.67e-0997
GO:00516074Oral cavityOSCCdefense response to virus154/7305265/187231.96e-105.63e-09154
GO:01405464Oral cavityOSCCdefense response to symbiont154/7305265/187231.96e-105.63e-09154
GO:004506917Oral cavityOSCCregulation of viral genome replication62/730585/187232.14e-106.04e-0962
GO:00450717Oral cavityOSCCnegative regulation of viral genome replication38/730556/187231.15e-051.18e-0438
GO:00485259Oral cavityOSCCnegative regulation of viral process56/730592/187231.77e-051.72e-0456
GO:00342495Oral cavityOSCCnegative regulation of cellular amide metabolic process130/7305273/187232.20e-031.00e-02130
Page: 1 2 3 4 5 6 7 8 9 10 11 

check button Enriched KEGG pathways.
Pathway IDTissueDisease StageDescriptionGene RatioBg Ratiopvaluep.adjustqvalueCount
Page: 1 

Top

Cell-cell communication analysis

check buttonIdentification of potential cell-cell interactions between two cell types and their ligand-receptor pairs for different disease states
LigandReceptorLRpairPathwayTissueDisease Stage
Page: 1 

Top

Single-cell gene regulatory network inference analysis

check buttonFind out the significant the regulons (TFs) and the target genes of each regulon across cell types for different disease states
TFCell TypeTissueDisease StageTarget GeneRSSRegulon Activity
∗The dot plots of a searched regulon are shown for all cell subpopulations in each disease state of each tissue based on the regulon specific score inferred using pySCENIC and by calculating the average expression.
Page: 1 

Top

Somatic mutation of malignant transformation related genes

check buttonAnnotation of somatic variants for genes involved in malignant transformation
Hugo SymbolVariant ClassVariant ClassificationdbSNP RSHGVScHGVSpHGVSp ShortSWISSPROTBIOTYPESIFTPolyPhenTumor Sample BarcodeTissueHistologySexAgeStageTherapy TypesDrugsOutcome
ILF3SNVMissense_Mutationc.188N>Gp.Asp63Glyp.D63GQ12906protein_codingtolerated(0.08)benign(0.114)TCGA-A2-A259-01Breastbreast invasive carcinomaFemale>=65I/IIHormone TherapyarimidexSD
ILF3SNVMissense_Mutationc.1164N>Cp.Lys388Asnp.K388NQ12906protein_codingdeleterious(0.01)probably_damaging(0.997)TCGA-D8-A1JA-01Breastbreast invasive carcinomaFemale<65III/IVChemotherapyadriamycinPD
ILF3SNVMissense_Mutationc.2638N>Cp.Ser880Prop.S880PQ12906protein_codingtolerated_low_confidence(0.26)benign(0.192)TCGA-D8-A1XK-01Breastbreast invasive carcinomaFemale<65I/IIChemotherapydoxorubicine+cyclophosphamideSD
ILF3SNVMissense_Mutationc.109N>Gp.His37Aspp.H37DQ12906protein_codingtolerated(0.13)probably_damaging(0.99)TCGA-E2-A14Z-01Breastbreast invasive carcinomaFemale<65I/IIHormone TherapyarimidexPD
ILF3SNVMissense_Mutationc.2243N>Gp.Ser748Cysp.S748CQ12906protein_codingdeleterious(0.01)possibly_damaging(0.634)TCGA-EW-A1J6-01Breastbreast invasive carcinomaFemale>=65I/IIHormone TherapyfemaraSD
ILF3insertionFrame_Shift_Insnovelc.2555_2556insGATGCCTTTGACAGTGATGAAAACGATTTp.Lys853MetfsTer51p.K853Mfs*51Q12906protein_codingTCGA-AN-A0FT-01Breastbreast invasive carcinomaFemale<65I/IIUnknownUnknownSD
ILF3insertionFrame_Shift_Insnovelc.713_714insCTCAACAAATTCGACCCCAAAAGAGGCTGAGACTGAGTp.Arg239SerfsTer59p.R239Sfs*59Q12906protein_codingTCGA-B6-A0RE-01Breastbreast invasive carcinomaFemale<65I/IIUnknownUnknownSD
ILF3SNVMissense_Mutationnovelc.1421N>Tp.Arg474Metp.R474MQ12906protein_codingdeleterious(0)possibly_damaging(0.742)TCGA-IR-A3LF-01Cervixcervical & endocervical cancerFemale<65I/IIUnknownUnknownSD
ILF3SNVMissense_Mutationnovelc.634N>Ap.His212Asnp.H212NQ12906protein_codingdeleterious(0)probably_damaging(0.986)TCGA-VS-A94Z-01Cervixcervical & endocervical cancerFemale<65I/IIChemotherapycisplatinCR
ILF3SNVMissense_Mutationc.1103N>Tp.Thr368Metp.T368MQ12906protein_codingtolerated(0.11)possibly_damaging(0.78)TCGA-AA-3492-01Colorectumcolon adenocarcinomaFemale>=65I/IIUnknownUnknownSD
Page: 1 2 3 4 5 6 7 8 

Top

Related drugs of malignant transformation related genes

check buttonIdentification of chemicals and drugs interact with genes involved in malignant transfromation
(DGIdb 4.0)
Entrez IDSymbolCategoryInteraction TypesDrug Claim NameDrug NamePMIDs
3609ILF3KINASE, TRANSCRIPTION FACTORCSACYCLOSPORINE9843854
3609ILF3KINASE, TRANSCRIPTION FACTORIL-2ALDESLEUKIN12504009
Page: 1