Schematic overview of the cellular and molecular mechanisms involved in the cancer progression, including the proposed cellular and molecular mechanisms in cancer cells trajectory. AT1: alveolar type 1 cells; AT2: alveolar type 2 cells; AAH: atypical adenomatous hyperplasia; AIS: adenocarcinoma in situ; MIA: minimally invasive adenocarcinoma; IA: invasive adenocarcinoma; EMT: epithelial-mesenchymal transition

Home

Download

Statistics

Help

Contact

Center for Computational Systems Medicine
leaf

Gene summary

leaf

Malignant transformation analysis

leaf

Malignant transformation related pathway analysis

leaf

Cell-cell communication analysis

leaf

Single-cell gene regulatory network inference analysis

leaf

Somatic mutation of malignant transformation related genes

leaf

Related drugs of malignant transformation related genes

Gene: ICK

Gene summary for ICK

check button Gene summary.

Gene informationSpeciesHuman
Gene symbol

ICK

Gene ID

22858

Gene nameciliogenesis associated kinase 1
Gene AliasECO
Cytomap6p12.1
Gene Typeprotein-coding
GO ID

GO:0006464

UniProtAcc

A0A024RD59


Top

Malignant transformation analysis

check button Identification of the aberrant gene expression in precancerous and cancerous lesions by comparing the gene expression of stem-like cells in diseased tissues with normal stem cells
check button Malignant transformation involving gene list.
Entrez IDSymbolReplicatesSpeciesOrganTissueAdj P-valueLog2FCMalignancy
22858ICKLZE2DHumanEsophagusHGIN8.16e-034.22e-010.0642
22858ICKLZE2THumanEsophagusESCC4.21e-051.13e+000.082
22858ICKLZE4THumanEsophagusESCC3.24e-081.78e-010.0811
22858ICKLZE5THumanEsophagusESCC1.81e-034.51e-010.0514
22858ICKLZE7THumanEsophagusESCC4.11e-116.09e-010.0667
22858ICKLZE8THumanEsophagusESCC5.97e-046.92e-020.067
22858ICKLZE20THumanEsophagusESCC5.26e-052.78e-010.0662
22858ICKLZE24THumanEsophagusESCC2.22e-164.97e-010.0596
22858ICKLZE21THumanEsophagusESCC3.36e-073.86e-010.0655
22858ICKP1T-EHumanEsophagusESCC2.28e-074.15e-010.0875
22858ICKP2T-EHumanEsophagusESCC1.43e-153.08e-010.1177
22858ICKP4T-EHumanEsophagusESCC6.71e-317.56e-010.1323
22858ICKP5T-EHumanEsophagusESCC2.98e-037.61e-020.1327
22858ICKP8T-EHumanEsophagusESCC9.58e-142.75e-010.0889
22858ICKP9T-EHumanEsophagusESCC9.95e-204.63e-010.1131
22858ICKP10T-EHumanEsophagusESCC7.51e-163.66e-010.116
22858ICKP11T-EHumanEsophagusESCC2.23e-041.88e-010.1426
22858ICKP12T-EHumanEsophagusESCC8.75e-318.12e-010.1122
22858ICKP15T-EHumanEsophagusESCC1.10e-142.92e-010.1149
22858ICKP16T-EHumanEsophagusESCC8.31e-194.04e-010.1153
Page: 1 2 3 4 5 

check button Transcriptomic changes along malignancy continuum.
TissueExpression DynamicsAbbreviation
EsophagusThe image shows the transcriptomic changes along malignancy continuum.log2FC in expression of this searched gene in stem-like cells from each diseased tissue sample relative to stem-like cells in normal samples in each tissue plotted against the malignancy continuum. Samples are colored based on if they are from different disease stage.
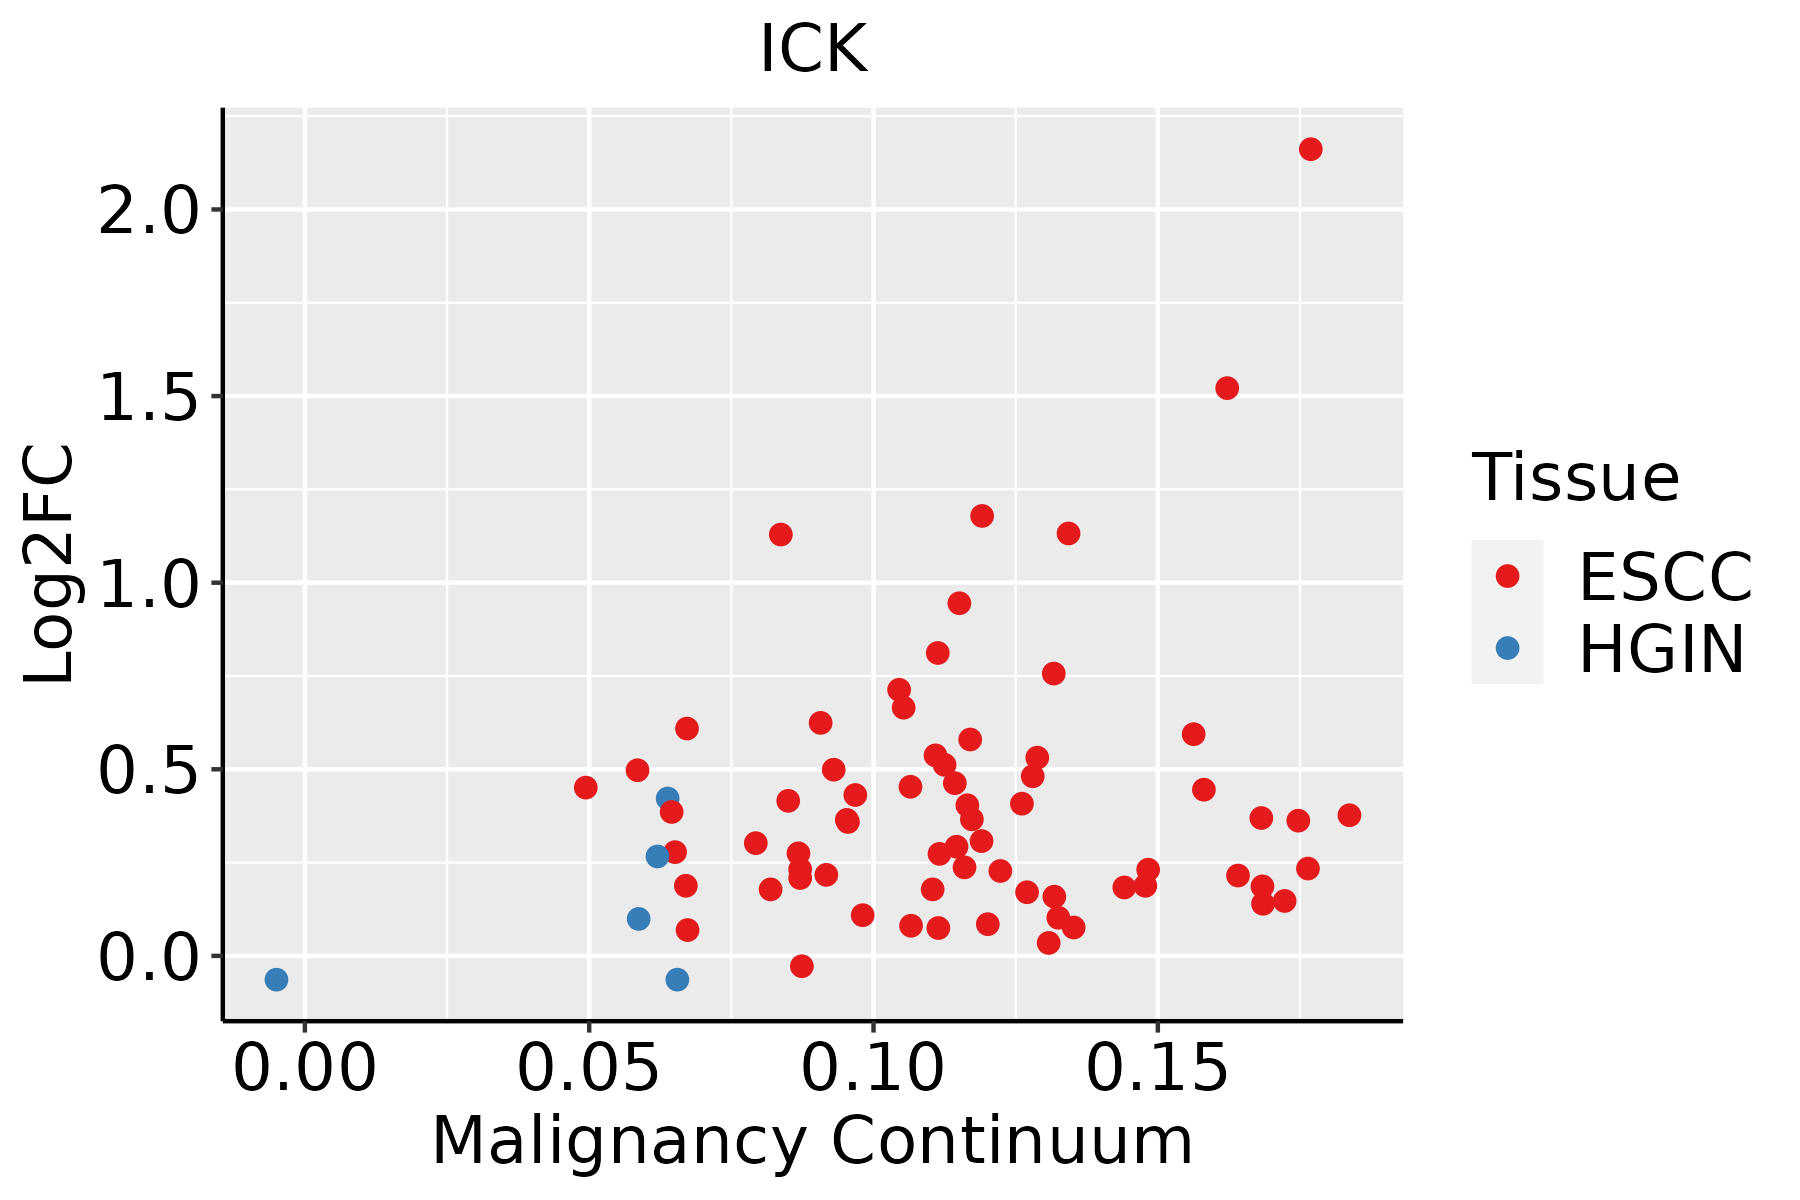
ESCC: Esophageal squamous cell carcinoma
HGIN: High-grade intraepithelial neoplasias
LGIN: Low-grade intraepithelial neoplasias
LiverThe image shows the transcriptomic changes along malignancy continuum.log2FC in expression of this searched gene in stem-like cells from each diseased tissue sample relative to stem-like cells in normal samples in each tissue plotted against the malignancy continuum. Samples are colored based on if they are from different disease stage.
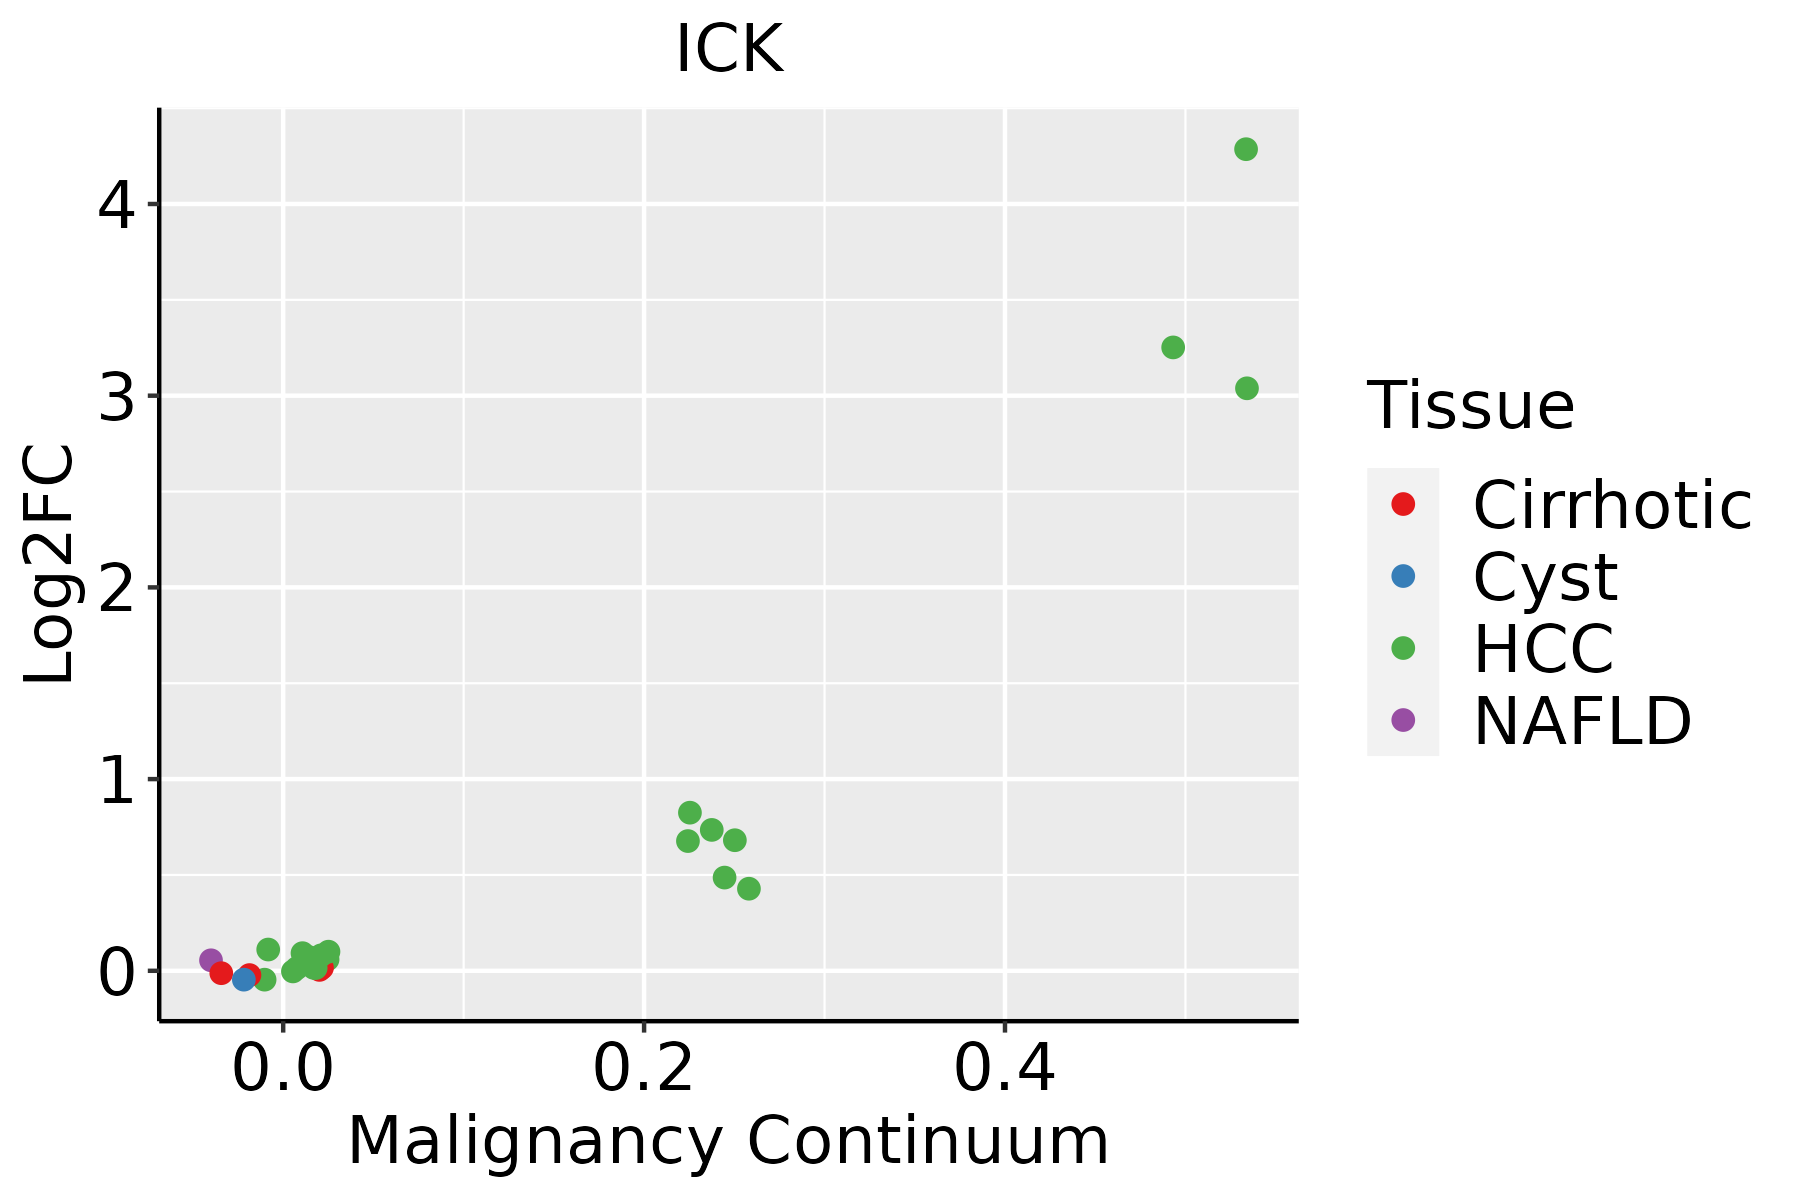
HCC: Hepatocellular carcinoma
NAFLD: Non-alcoholic fatty liver disease
Oral CavityThe image shows the transcriptomic changes along malignancy continuum.log2FC in expression of this searched gene in stem-like cells from each diseased tissue sample relative to stem-like cells in normal samples in each tissue plotted against the malignancy continuum. Samples are colored based on if they are from different disease stage.EOLP: Erosive Oral lichen planus
LP: leukoplakia
NEOLP: Non-erosive oral lichen planus
OSCC: Oral squamous cell carcinoma
ProstateThe image shows the transcriptomic changes along malignancy continuum.log2FC in expression of this searched gene in stem-like cells from each diseased tissue sample relative to stem-like cells in normal samples in each tissue plotted against the malignancy continuum. Samples are colored based on if they are from different disease stage.
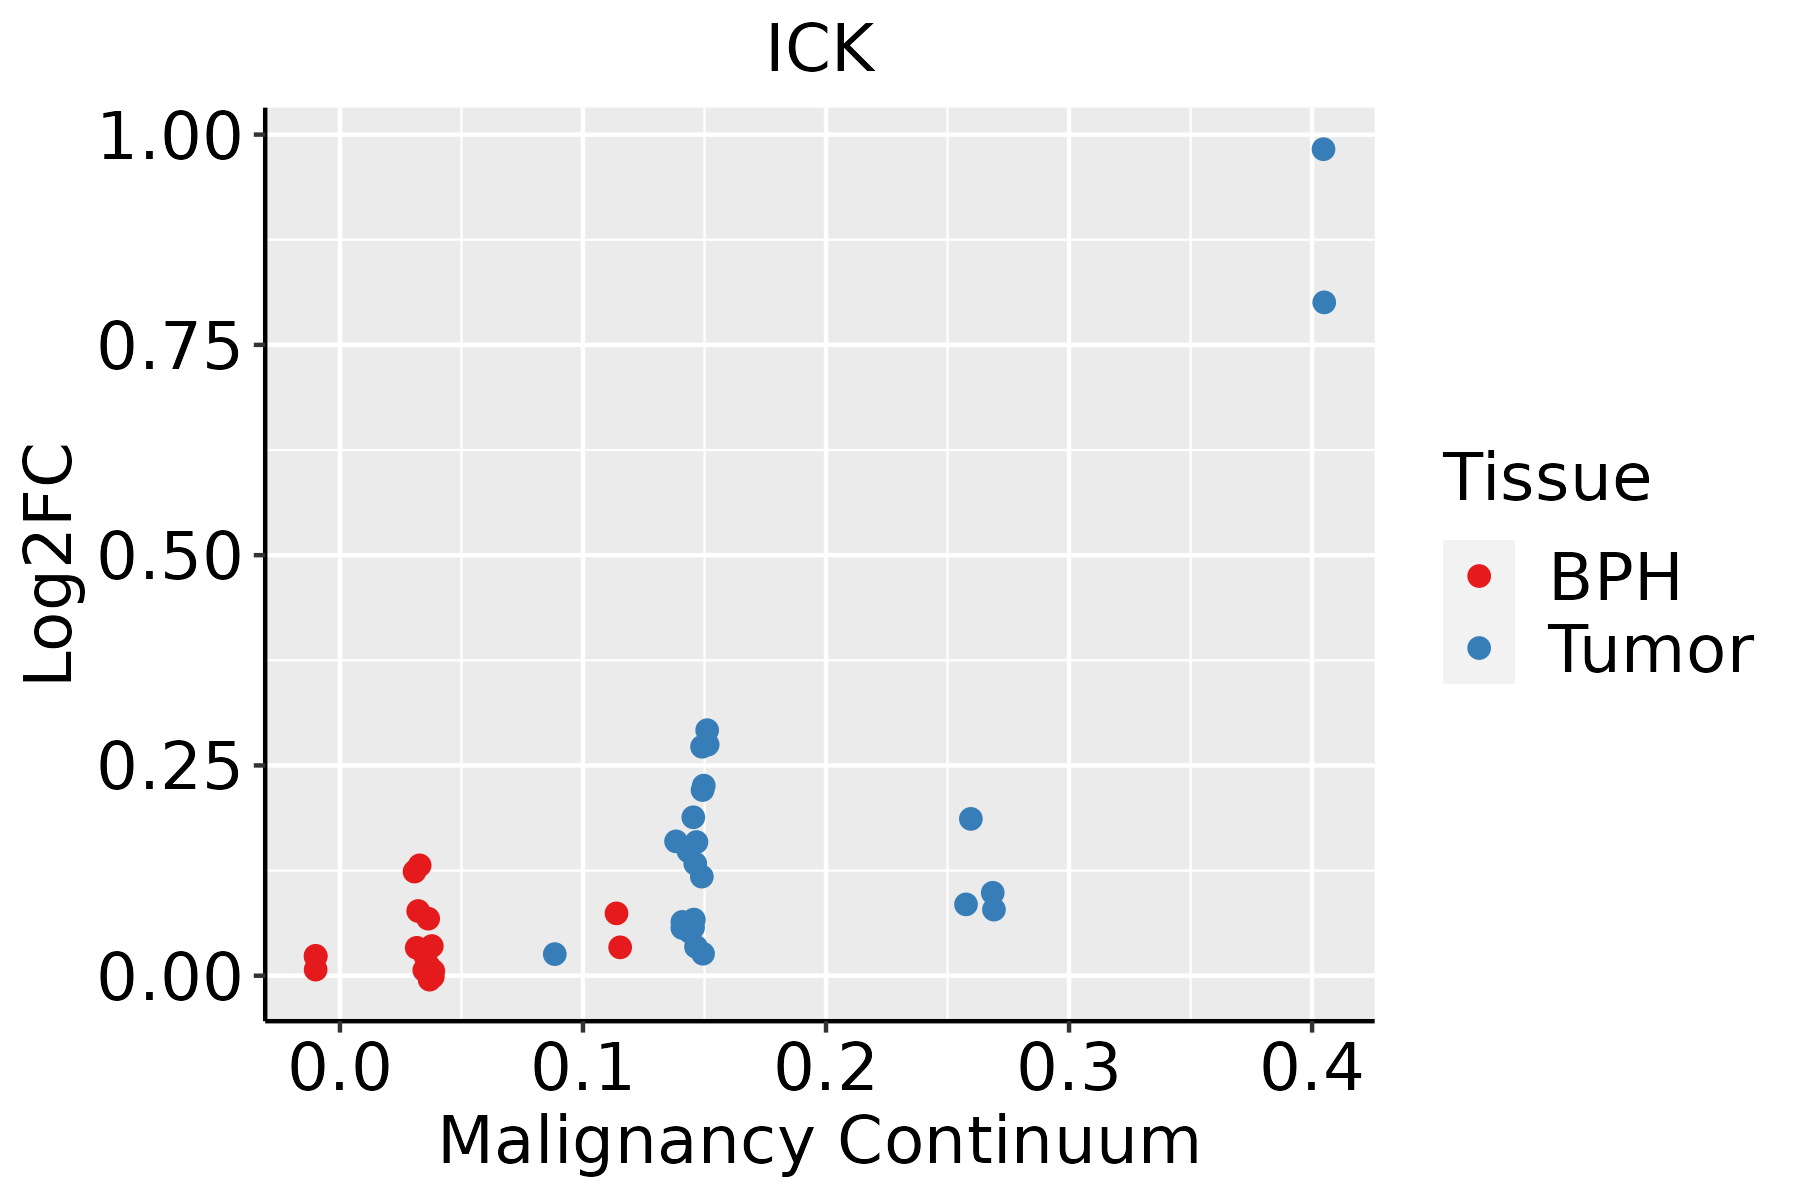
BPH: Benign Prostatic Hyperplasia
ThyroidThe image shows the transcriptomic changes along malignancy continuum.log2FC in expression of this searched gene in stem-like cells from each diseased tissue sample relative to stem-like cells in normal samples in each tissue plotted against the malignancy continuum. Samples are colored based on if they are from different disease stage.
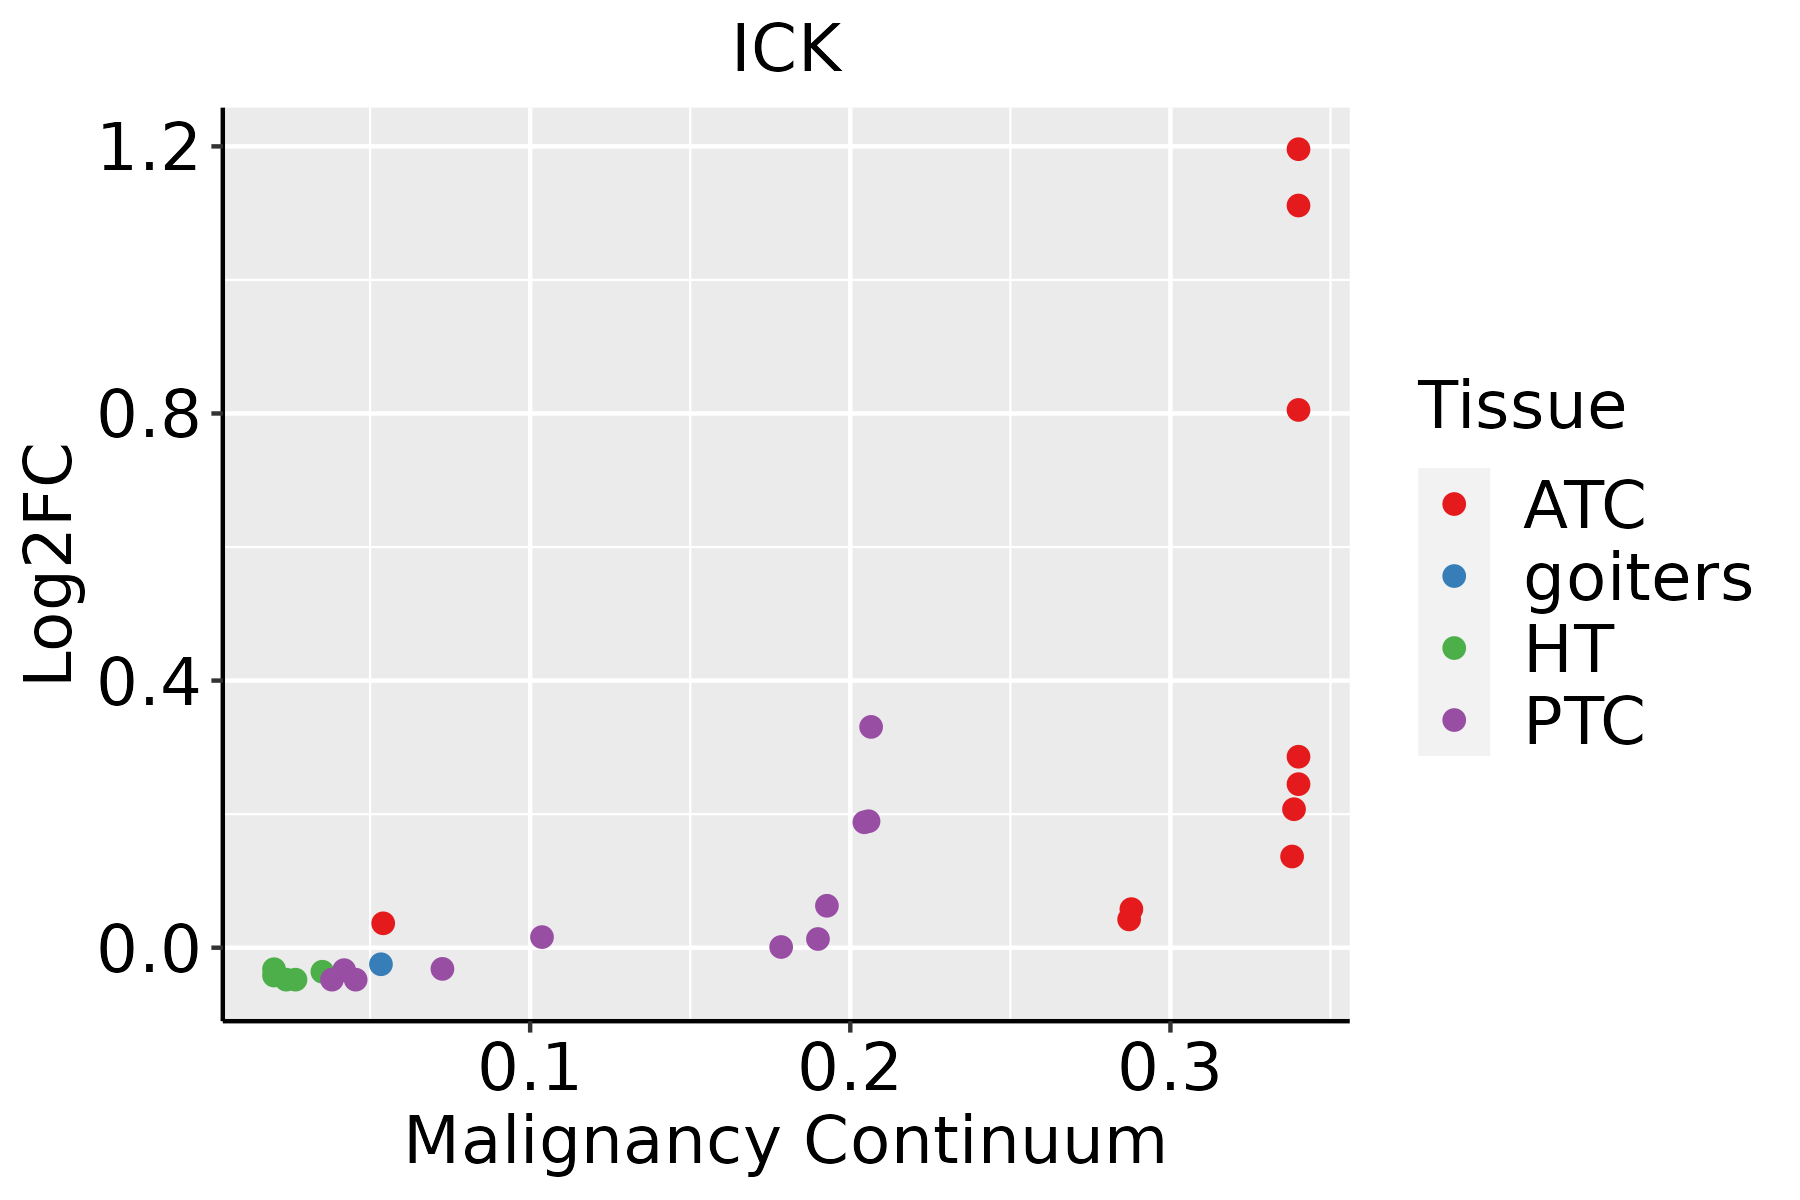
ATC: Anaplastic thyroid cancer
HT: Hashimoto's thyroiditis
PTC: Papillary thyroid cancer
∗log2FC in expression of this searched gene in stem-like cells from each diseased tissue sample relative to stem-like cells in normal samples in each tissue plotted against the malignancy continuum. Samples are colored based on if they are from different disease stage.

Top

Malignant transformation related pathway analysis

check buttonFind out the enriched GO biological processes and KEGG pathways involved in transition from healthy to precancer to cancer
check button Figure of enriched GO biological processes.
TissueDisease StageEnriched GO biological Processes
ColorectumADGO analysis - Figure of enriched GO biological processes: Top 15 enriched GO BP terms are showed in the bar plot of each disease state in each tissue. Each row represents a significant GO biological process which is colored according to the -log10(p.adjust).
ColorectumSERGO analysis - Figure of enriched GO biological processes: Top 15 enriched GO BP terms are showed in the bar plot of each disease state in each tissue. Each row represents a significant GO biological process which is colored according to the -log10(p.adjust).
ColorectumMSSGO analysis - Figure of enriched GO biological processes: Top 15 enriched GO BP terms are showed in the bar plot of each disease state in each tissue. Each row represents a significant GO biological process which is colored according to the -log10(p.adjust).
ColorectumMSI-HGO analysis - Figure of enriched GO biological processes: Top 15 enriched GO BP terms are showed in the bar plot of each disease state in each tissue. Each row represents a significant GO biological process which is colored according to the -log10(p.adjust).
ColorectumFAPGO analysis - Figure of enriched GO biological processes: Top 15 enriched GO BP terms are showed in the bar plot of each disease state in each tissue. Each row represents a significant GO biological process which is colored according to the -log10(p.adjust).
∗Top 15 enriched GO BP terms are showed in the bar plot of each disease state in each tissue. Each row represents a significant GO biological process which is colored according to the -log10(p.adjust).
Page: 1 2 3 4 5 6 7 8 9 

check button Enriched GO biological processes.
GO IDTissueDisease StageDescriptionGene RatioBg Ratiopvaluep.adjustCount
GO:00488638EsophagusESCCstem cell differentiation122/8552206/187235.95e-054.59e-04122
GO:0030041110EsophagusESCCactin filament polymerization114/8552191/187236.46e-054.92e-04114
GO:000806419EsophagusESCCregulation of actin polymerization or depolymerization112/8552188/187238.31e-056.06e-04112
GO:003083218EsophagusESCCregulation of actin filament length112/8552189/187231.13e-047.85e-04112
GO:003083320EsophagusESCCregulation of actin filament polymerization103/8552172/187231.19e-048.15e-04103
GO:00100016EsophagusESCCglial cell differentiation129/8552225/187232.73e-041.65e-03129
GO:00600714EsophagusESCCWnt signaling pathway, planar cell polarity pathway36/855252/187235.05e-042.79e-0336
GO:200073614EsophagusESCCregulation of stem cell differentiation39/855258/187237.43e-043.86e-0339
GO:003431415EsophagusESCCArp2/3 complex-mediated actin nucleation28/855239/187238.57e-044.40e-0328
GO:00901753EsophagusESCCregulation of establishment of planar polarity37/855256/187231.65e-037.65e-0337
GO:004825916EsophagusESCCregulation of receptor-mediated endocytosis66/8552110/187231.72e-037.96e-0366
GO:00301788EsophagusESCCnegative regulation of Wnt signaling pathway97/8552170/187231.81e-038.31e-0397
GO:00454454EsophagusESCCmyoblast differentiation52/855284/187231.98e-038.90e-0352
GO:00017361EsophagusESCCestablishment of planar polarity45/855272/187232.97e-031.24e-0245
GO:00071641EsophagusESCCestablishment of tissue polarity45/855272/187232.97e-031.24e-0245
GO:00355671EsophagusESCCnon-canonical Wnt signaling pathway45/855272/187232.97e-031.24e-0245
GO:000930617EsophagusESCCprotein secretion190/8552359/187233.22e-031.34e-02190
GO:004826010EsophagusESCCpositive regulation of receptor-mediated endocytosis34/855252/187233.26e-031.35e-0234
GO:003559217EsophagusESCCestablishment of protein localization to extracellular region190/8552360/187233.77e-031.53e-02190
GO:00343156EsophagusESCCregulation of Arp2/3 complex-mediated actin nucleation16/855221/187234.47e-031.76e-0216
Page: 1 2 3 4 5 6 7 8 9 10 11 12 13 14 

check button Enriched KEGG pathways.
Pathway IDTissueDisease StageDescriptionGene RatioBg Ratiopvaluep.adjustqvalueCount
Page: 1 

Top

Cell-cell communication analysis

check buttonIdentification of potential cell-cell interactions between two cell types and their ligand-receptor pairs for different disease states
LigandReceptorLRpairPathwayTissueDisease Stage
Page: 1 

Top

Single-cell gene regulatory network inference analysis

check buttonFind out the significant the regulons (TFs) and the target genes of each regulon across cell types for different disease states
TFCell TypeTissueDisease StageTarget GeneRSSRegulon Activity
∗The dot plots of a searched regulon are shown for all cell subpopulations in each disease state of each tissue based on the regulon specific score inferred using pySCENIC and by calculating the average expression.
Page: 1 

Top

Somatic mutation of malignant transformation related genes

check buttonAnnotation of somatic variants for genes involved in malignant transformation
Hugo SymbolVariant ClassVariant ClassificationdbSNP RSHGVScHGVSpHGVSp ShortSWISSPROTBIOTYPESIFTPolyPhenTumor Sample BarcodeTissueHistologySexAgeStageTherapy TypesDrugsOutcome
ICKSNVMissense_Mutationnovelc.1348G>Cp.Glu450Glnp.E450QQ9UPZ9protein_codingtolerated(0.15)benign(0.015)TCGA-3C-AALI-01Breastbreast invasive carcinomaFemale<65I/IIUnspecificPoly EComplete Response
ICKSNVMissense_Mutationnovelc.1126N>Cp.Ser376Prop.S376PQ9UPZ9protein_codingtolerated(0.14)benign(0.009)TCGA-A2-A1G4-01Breastbreast invasive carcinomaFemale>=65III/IVChemotherapyadriamycinSD
ICKSNVMissense_Mutationnovelc.1126T>Cp.Ser376Prop.S376PQ9UPZ9protein_codingtolerated(0.14)benign(0.009)TCGA-A8-A06R-01Breastbreast invasive carcinomaFemale>=65I/IIChemotherapy5-fluorouracilCR
ICKSNVMissense_Mutationc.613G>Ap.Glu205Lysp.E205KQ9UPZ9protein_codingdeleterious(0)probably_damaging(0.969)TCGA-AC-A23H-01Breastbreast invasive carcinomaFemale>=65I/IIUnknownUnknownPD
ICKSNVMissense_Mutationrs561765544c.995G>Ap.Arg332Glnp.R332QQ9UPZ9protein_codingtolerated(0.52)benign(0.007)TCGA-AN-A046-01Breastbreast invasive carcinomaFemale>=65I/IIUnknownUnknownSD
ICKSNVMissense_Mutationc.932N>Tp.Ala311Valp.A311VQ9UPZ9protein_codingtolerated(0.31)benign(0.001)TCGA-AR-A0U0-01Breastbreast invasive carcinomaFemale>=65I/IIUnknownUnknownSD
ICKSNVMissense_Mutationnovelc.1126N>Cp.Ser376Prop.S376PQ9UPZ9protein_codingtolerated(0.14)benign(0.009)TCGA-BH-A1FH-01Breastbreast invasive carcinomaFemale<65III/IVUnknownUnknownPD
ICKSNVMissense_Mutationnovelc.1126T>Cp.Ser376Prop.S376PQ9UPZ9protein_codingtolerated(0.14)benign(0.009)TCGA-C8-A273-01Breastbreast invasive carcinomaFemale<65I/IIHormone TherapytamoxiphenSD
ICKSNVMissense_Mutationnovelc.1126N>Cp.Ser376Prop.S376PQ9UPZ9protein_codingtolerated(0.14)benign(0.009)TCGA-D8-A1JT-01Breastbreast invasive carcinomaFemale>=65I/IIHormone TherapyarimidexSD
ICKSNVMissense_Mutationnovelc.1126N>Cp.Ser376Prop.S376PQ9UPZ9protein_codingtolerated(0.14)benign(0.009)TCGA-D8-A1XG-01Breastbreast invasive carcinomaFemale>=65III/IVUnknownUnknownSD
Page: 1 2 3 4 5 6 7 

Top

Related drugs of malignant transformation related genes

check buttonIdentification of chemicals and drugs interact with genes involved in malignant transfromation
(DGIdb 4.0)
Entrez IDSymbolCategoryInteraction TypesDrug Claim NameDrug NamePMIDs
Page: 1