Schematic overview of the cellular and molecular mechanisms involved in the cancer progression, including the proposed cellular and molecular mechanisms in cancer cells trajectory. AT1: alveolar type 1 cells; AT2: alveolar type 2 cells; AAH: atypical adenomatous hyperplasia; AIS: adenocarcinoma in situ; MIA: minimally invasive adenocarcinoma; IA: invasive adenocarcinoma; EMT: epithelial-mesenchymal transition

Home

Download

Statistics

Help

Contact

Center for Computational Systems Medicine
leaf

Gene summary

leaf

Malignant transformation analysis

leaf

Malignant transformation related pathway analysis

leaf

Cell-cell communication analysis

leaf

Single-cell gene regulatory network inference analysis

leaf

Somatic mutation of malignant transformation related genes

leaf

Related drugs of malignant transformation related genes

Gene: HBA2

Gene summary for HBA2

check button Gene summary.

Gene informationSpeciesHuman
Gene symbol

HBA2

Gene ID

3040

Gene namehemoglobin subunit alpha 2
Gene AliasECYT7
Cytomap16p13.3
Gene Typeprotein-coding
GO ID

GO:0000302

UniProtAcc

D1MGQ2


Top

Malignant transformation analysis

check button Identification of the aberrant gene expression in precancerous and cancerous lesions by comparing the gene expression of stem-like cells in diseased tissues with normal stem cells
check button Malignant transformation involving gene list.
Entrez IDSymbolReplicatesSpeciesOrganTissueAdj P-valueLog2FCMalignancy
3040HBA2HTA11_2487_2000001011HumanColorectumSER3.37e-031.80e-01-0.1808
3040HBA2HTA11_3361_2000001011HumanColorectumAD4.35e-151.36e+00-0.1207
3040HBA2HTA11_1391_2000001011HumanColorectumAD2.00e-121.10e+00-0.059
3040HBA2CRC-3-11773HumanColorectumCRC3.61e-021.57e-010.2564
3040HBA2AEH-subject1HumanEndometriumAEH1.10e-08-7.24e-01-0.3059
3040HBA2AEH-subject2HumanEndometriumAEH2.55e-07-7.16e-01-0.2525
3040HBA2AEH-subject3HumanEndometriumAEH7.69e-12-7.30e-01-0.2576
3040HBA2AEH-subject4HumanEndometriumAEH7.85e-07-7.30e-01-0.2657
3040HBA2AEH-subject5HumanEndometriumAEH2.81e-09-7.21e-01-0.2953
3040HBA2EEC-subject1HumanEndometriumEEC1.12e-09-7.22e-01-0.2682
3040HBA2EEC-subject2HumanEndometriumEEC3.48e-12-7.30e-01-0.2607
3040HBA2EEC-subject3HumanEndometriumEEC1.84e-05-6.28e-01-0.2525
3040HBA2EEC-subject4HumanEndometriumEEC5.60e-08-7.04e-01-0.2571
3040HBA2EEC-subject5HumanEndometriumEEC7.69e-12-7.30e-01-0.249
3040HBA2GSM5276934HumanEndometriumEEC1.69e-11-7.30e-01-0.0913
3040HBA2GSM5276935HumanEndometriumEEC1.29e-08-7.10e-01-0.123
3040HBA2GSM5276937HumanEndometriumEEC8.28e-09-7.30e-01-0.0897
3040HBA2GSM6177620_NYU_UCEC1_lib1_lib1HumanEndometriumEEC2.35e-07-7.30e-01-0.1869
3040HBA2GSM6177620_NYU_UCEC1_lib2_lib2HumanEndometriumEEC2.71e-06-7.30e-01-0.1875
3040HBA2GSM6177620_NYU_UCEC1_lib3_lib3HumanEndometriumEEC1.07e-07-7.30e-01-0.1883
Page: 1 2 3 4 

check button Transcriptomic changes along malignancy continuum.
TissueExpression DynamicsAbbreviation
Colorectum (GSE201348)The image shows the transcriptomic changes along malignancy continuum.log2FC in expression of this searched gene in stem-like cells from each diseased tissue sample relative to stem-like cells in normal samples in each tissue plotted against the malignancy continuum. Samples are colored based on if they are from different disease stage.FAP: Familial adenomatous polyposis
CRC: Colorectal cancer
Colorectum (HTA11)The image shows the transcriptomic changes along malignancy continuum.log2FC in expression of this searched gene in stem-like cells from each diseased tissue sample relative to stem-like cells in normal samples in each tissue plotted against the malignancy continuum. Samples are colored based on if they are from different disease stage.AD: Adenomas
SER: Sessile serrated lesions
MSI-H: Microsatellite-high colorectal cancer
MSS: Microsatellite stable colorectal cancer
EndometriumThe image shows the transcriptomic changes along malignancy continuum.log2FC in expression of this searched gene in stem-like cells from each diseased tissue sample relative to stem-like cells in normal samples in each tissue plotted against the malignancy continuum. Samples are colored based on if they are from different disease stage.
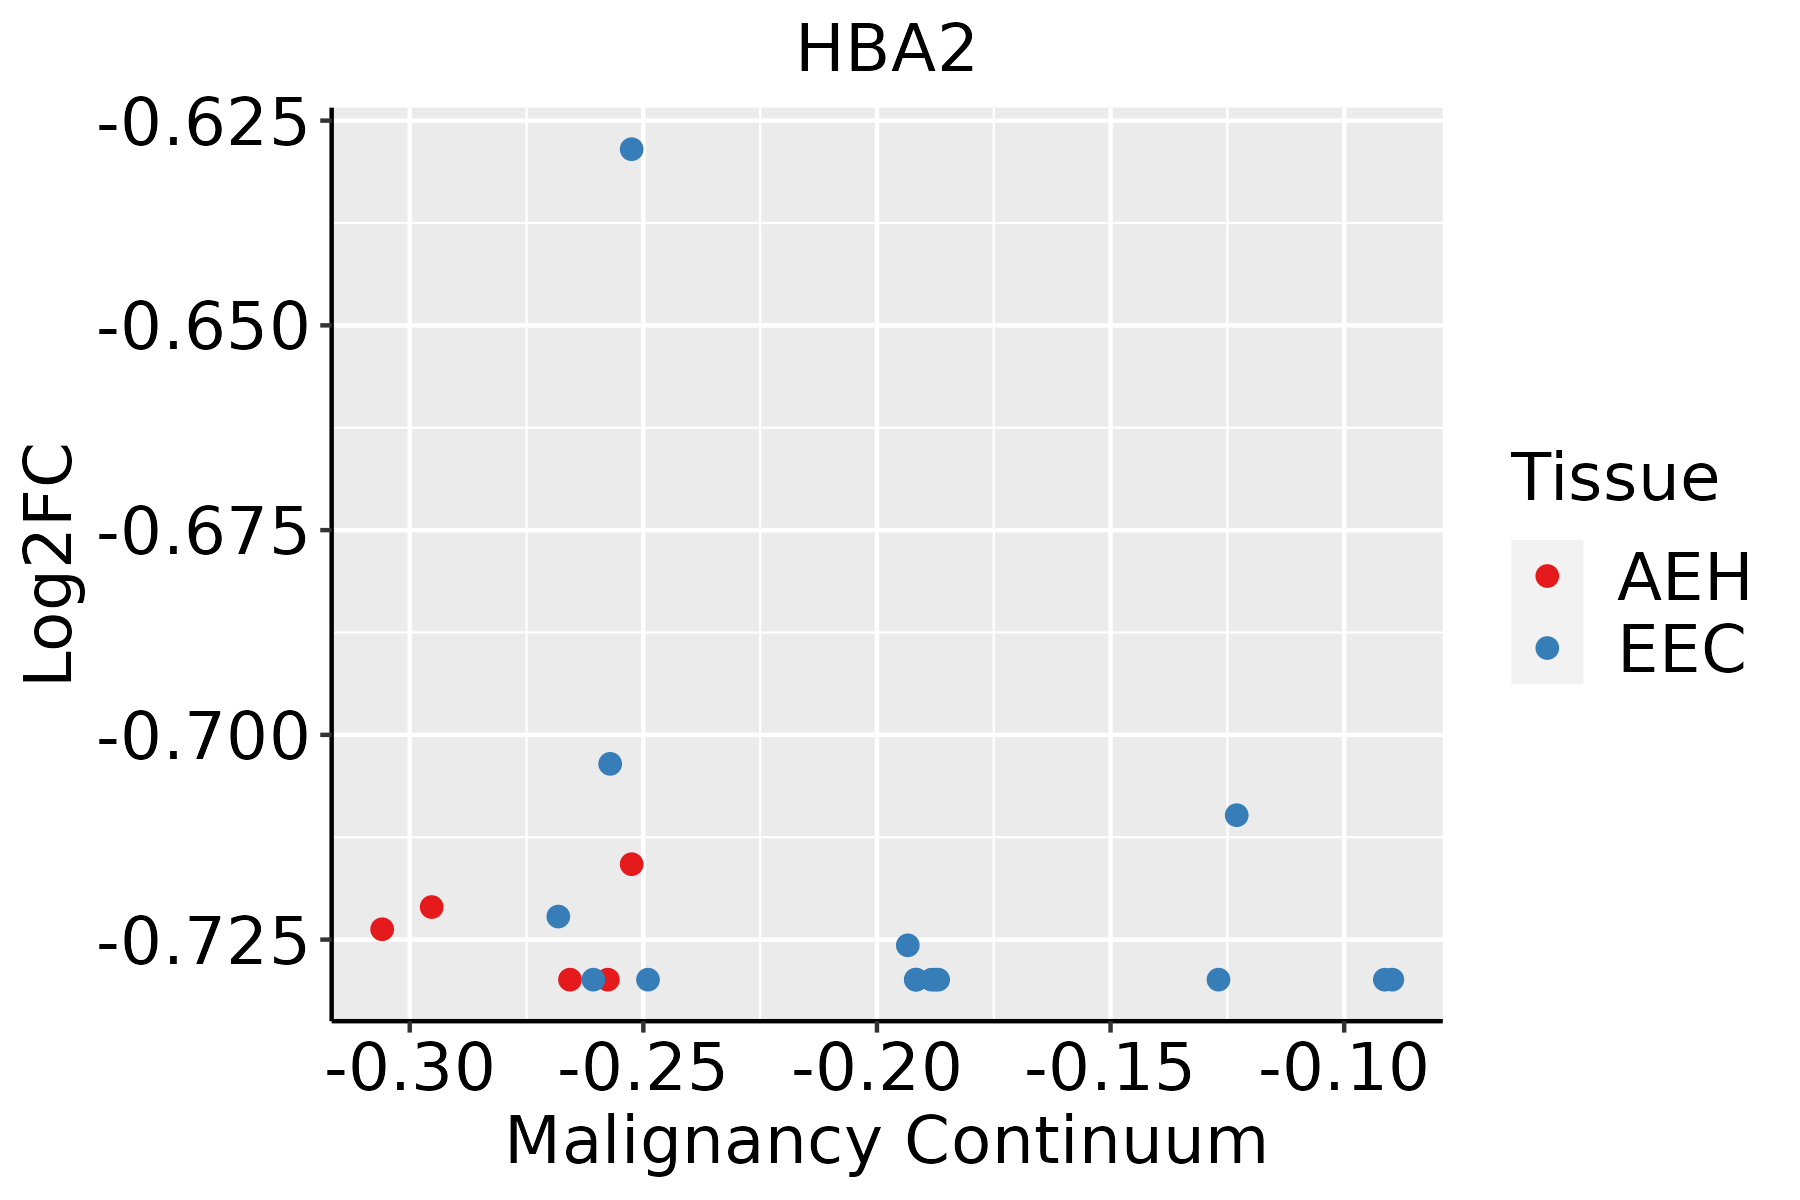
AEH: Atypical endometrial hyperplasia
EEC: Endometrioid Cancer
GCThe image shows the transcriptomic changes along malignancy continuum.log2FC in expression of this searched gene in stem-like cells from each diseased tissue sample relative to stem-like cells in normal samples in each tissue plotted against the malignancy continuum. Samples are colored based on if they are from different disease stage.
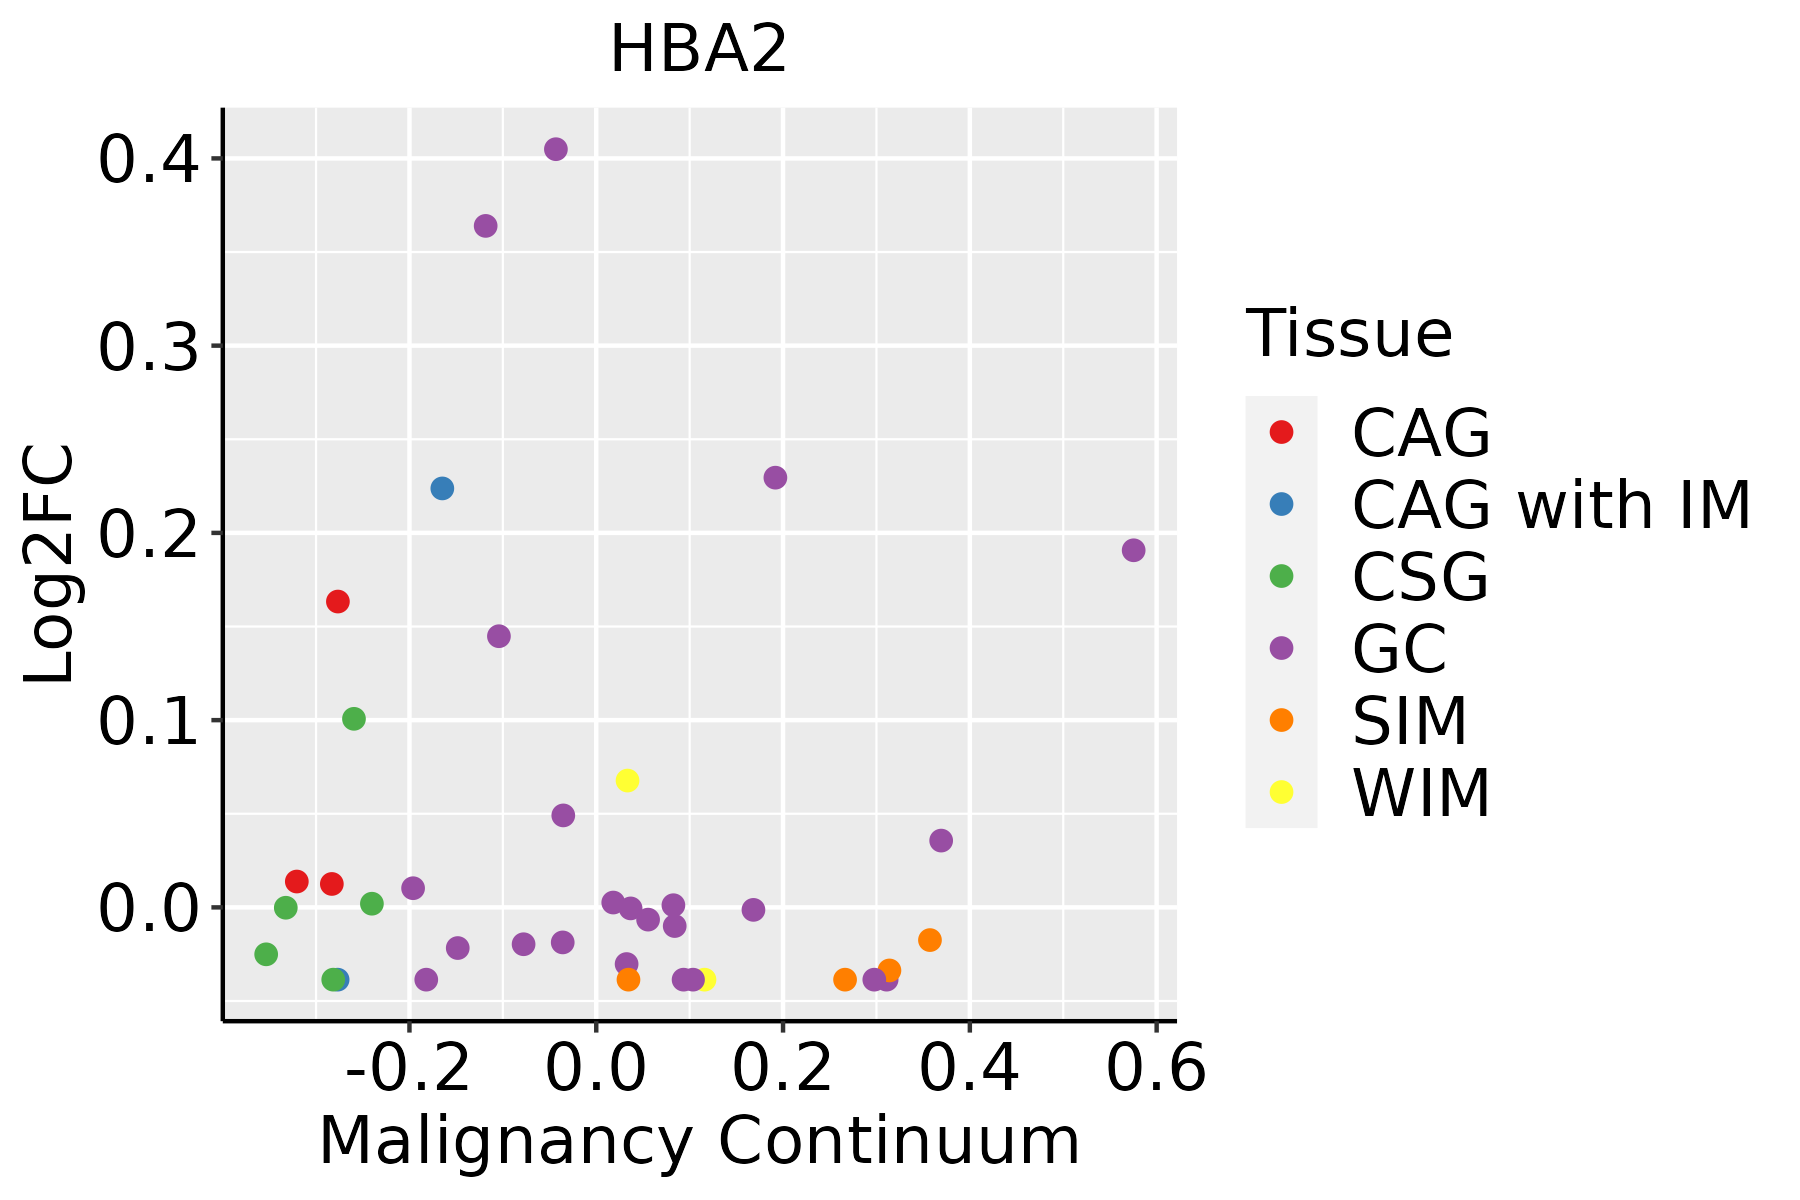
CAG: Chronic atrophic gastritis
CAG with IM: Chronic atrophic gastritis with intestinal metaplasia
CSG: Chronic superficial gastritis
GC: Gastric cancer
SIM: Severe intestinal metaplasia
WIM: Wild intestinal metaplasia
LiverThe image shows the transcriptomic changes along malignancy continuum.log2FC in expression of this searched gene in stem-like cells from each diseased tissue sample relative to stem-like cells in normal samples in each tissue plotted against the malignancy continuum. Samples are colored based on if they are from different disease stage.
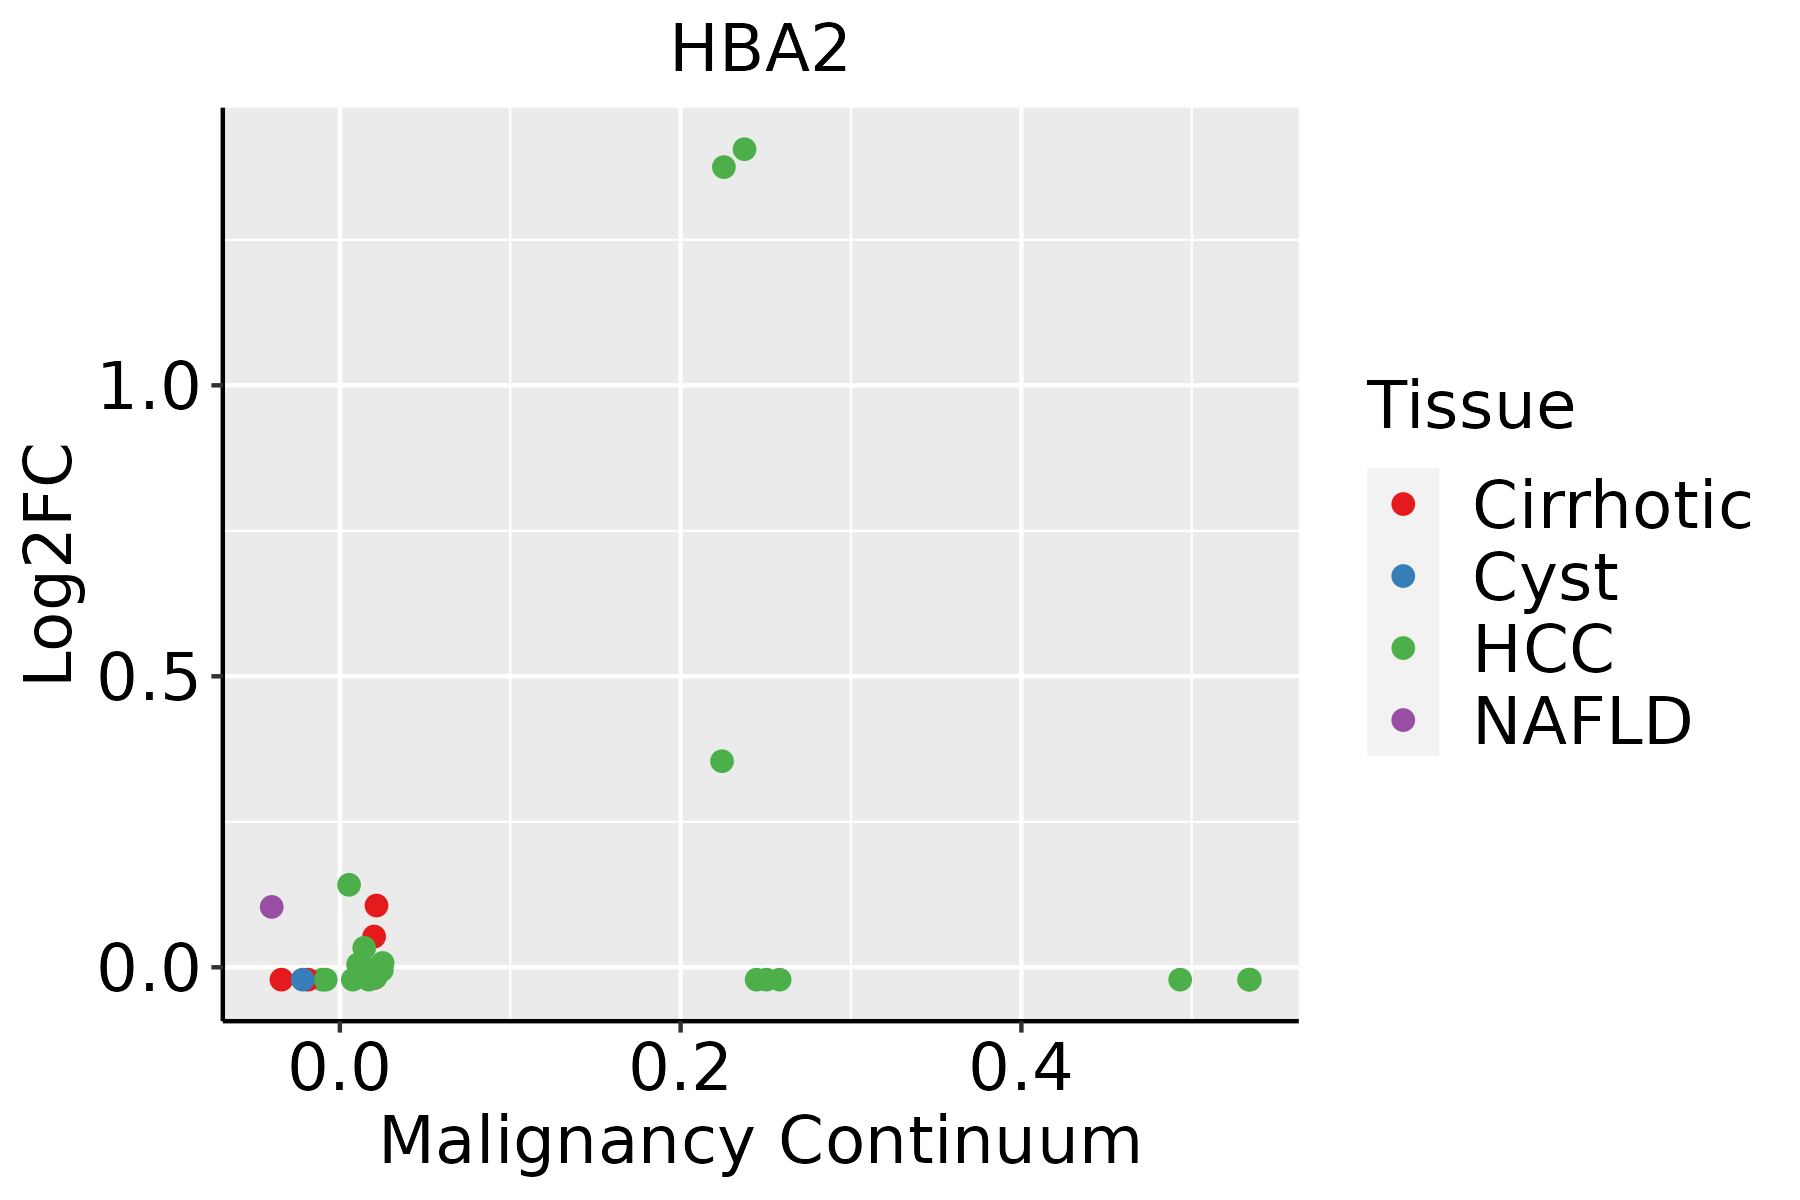
HCC: Hepatocellular carcinoma
NAFLD: Non-alcoholic fatty liver disease
Oral CavityThe image shows the transcriptomic changes along malignancy continuum.log2FC in expression of this searched gene in stem-like cells from each diseased tissue sample relative to stem-like cells in normal samples in each tissue plotted against the malignancy continuum. Samples are colored based on if they are from different disease stage.
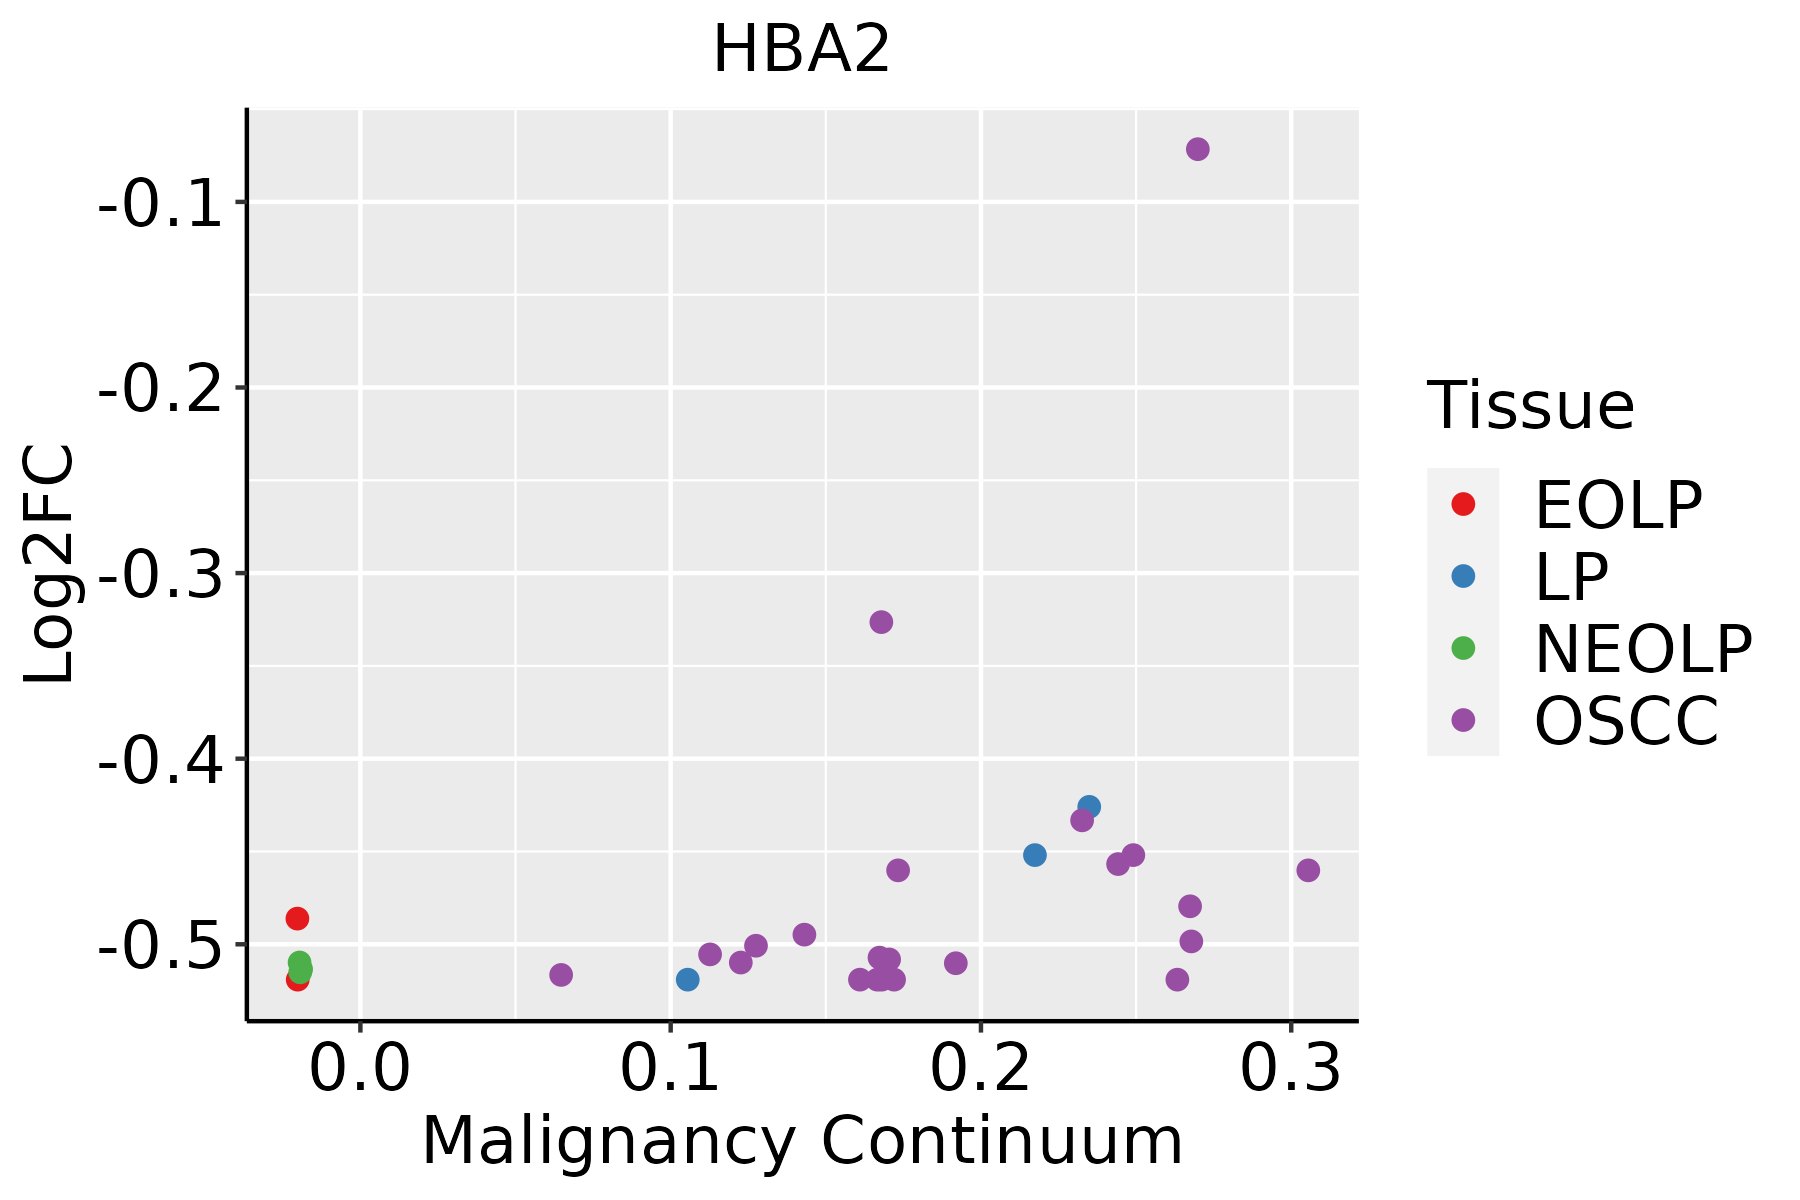
EOLP: Erosive Oral lichen planus
LP: leukoplakia
NEOLP: Non-erosive oral lichen planus
OSCC: Oral squamous cell carcinoma
ThyroidThe image shows the transcriptomic changes along malignancy continuum.log2FC in expression of this searched gene in stem-like cells from each diseased tissue sample relative to stem-like cells in normal samples in each tissue plotted against the malignancy continuum. Samples are colored based on if they are from different disease stage.ATC: Anaplastic thyroid cancer
HT: Hashimoto's thyroiditis
PTC: Papillary thyroid cancer
∗log2FC in expression of this searched gene in stem-like cells from each diseased tissue sample relative to stem-like cells in normal samples in each tissue plotted against the malignancy continuum. Samples are colored based on if they are from different disease stage.

Top

Malignant transformation related pathway analysis

check buttonFind out the enriched GO biological processes and KEGG pathways involved in transition from healthy to precancer to cancer
check button Figure of enriched GO biological processes.
TissueDisease StageEnriched GO biological Processes
ColorectumADGO analysis - Figure of enriched GO biological processes: Top 15 enriched GO BP terms are showed in the bar plot of each disease state in each tissue. Each row represents a significant GO biological process which is colored according to the -log10(p.adjust).
ColorectumSERGO analysis - Figure of enriched GO biological processes: Top 15 enriched GO BP terms are showed in the bar plot of each disease state in each tissue. Each row represents a significant GO biological process which is colored according to the -log10(p.adjust).
ColorectumMSSGO analysis - Figure of enriched GO biological processes: Top 15 enriched GO BP terms are showed in the bar plot of each disease state in each tissue. Each row represents a significant GO biological process which is colored according to the -log10(p.adjust).
ColorectumMSI-HGO analysis - Figure of enriched GO biological processes: Top 15 enriched GO BP terms are showed in the bar plot of each disease state in each tissue. Each row represents a significant GO biological process which is colored according to the -log10(p.adjust).
ColorectumFAPGO analysis - Figure of enriched GO biological processes: Top 15 enriched GO BP terms are showed in the bar plot of each disease state in each tissue. Each row represents a significant GO biological process which is colored according to the -log10(p.adjust).
∗Top 15 enriched GO BP terms are showed in the bar plot of each disease state in each tissue. Each row represents a significant GO biological process which is colored according to the -log10(p.adjust).
Page: 1 2 3 4 5 6 7 8 9 

check button Enriched GO biological processes.
GO IDTissueDisease StageDescriptionGene RatioBg Ratiopvaluep.adjustCount
GO:000697933Oral cavityNEOLPresponse to oxidative stress94/2005446/187237.53e-118.58e-0994
GO:004254232Oral cavityNEOLPresponse to hydrogen peroxide41/2005146/187234.37e-092.50e-0741
GO:009886931Oral cavityNEOLPcellular oxidant detoxification30/2005101/187231.30e-074.62e-0630
GO:000963633Oral cavityNEOLPresponse to toxic substance56/2005262/187233.13e-079.85e-0656
GO:199074832Oral cavityNEOLPcellular detoxification32/2005116/187233.30e-071.03e-0532
GO:009723732Oral cavityNEOLPcellular response to toxic substance33/2005124/187235.39e-071.61e-0533
GO:009875432Oral cavityNEOLPdetoxification36/2005152/187233.42e-067.61e-0536
GO:007259332Oral cavityNEOLPreactive oxygen species metabolic process46/2005239/187235.77e-057.77e-0446
GO:004274314Oral cavityNEOLPhydrogen peroxide metabolic process15/200558/187239.07e-047.10e-0315
GO:00427446Oral cavityNEOLPhydrogen peroxide catabolic process9/200532/187235.18e-032.78e-029
GO:00987546StomachGCdetoxification37/1159152/187233.63e-131.52e-1037
GO:00096366StomachGCresponse to toxic substance50/1159262/187237.42e-132.69e-1050
GO:00972376StomachGCcellular response to toxic substance31/1159124/187231.40e-113.31e-0931
GO:19907486StomachGCcellular detoxification29/1159116/187236.36e-111.19e-0829
GO:00988696StomachGCcellular oxidant detoxification24/1159101/187238.32e-098.22e-0724
GO:00069796StomachGCresponse to oxidative stress60/1159446/187231.10e-081.01e-0660
GO:00725936StomachGCreactive oxygen species metabolic process37/1159239/187232.28e-071.23e-0537
GO:00003026StomachGCresponse to reactive oxygen species32/1159222/187236.94e-062.57e-0432
GO:00427436StomachGChydrogen peroxide metabolic process13/115958/187234.24e-051.04e-0313
GO:00425426StomachGCresponse to hydrogen peroxide22/1159146/187239.34e-051.92e-0322
Page: 1 2 3 4 5 6 7 8 9 

check button Enriched KEGG pathways.
Pathway IDTissueDisease StageDescriptionGene RatioBg Ratiopvaluep.adjustqvalueCount
Page: 1 

Top

Cell-cell communication analysis

check buttonIdentification of potential cell-cell interactions between two cell types and their ligand-receptor pairs for different disease states
LigandReceptorLRpairPathwayTissueDisease Stage
Page: 1 

Top

Single-cell gene regulatory network inference analysis

check buttonFind out the significant the regulons (TFs) and the target genes of each regulon across cell types for different disease states
TFCell TypeTissueDisease StageTarget GeneRSSRegulon Activity
∗The dot plots of a searched regulon are shown for all cell subpopulations in each disease state of each tissue based on the regulon specific score inferred using pySCENIC and by calculating the average expression.
Page: 1 

Top

Somatic mutation of malignant transformation related genes

check buttonAnnotation of somatic variants for genes involved in malignant transformation
Hugo SymbolVariant ClassVariant ClassificationdbSNP RSHGVScHGVSpHGVSp ShortSWISSPROTBIOTYPESIFTPolyPhenTumor Sample BarcodeTissueHistologySexAgeStageTherapy TypesDrugsOutcome
HBA2SNVMissense_Mutationrs33933481c.379G>Tp.Asp127Tyrp.D127YP69905protein_codingdeleterious(0)probably_damaging(0.999)TCGA-A2-A25A-01Breastbreast invasive carcinomaFemale<65I/IIUnspecificCytoxanSD
HBA2SNVMissense_Mutationnovelc.325A>Gp.Thr109Alap.T109AP69905protein_codingtolerated(0.05)benign(0.185)TCGA-BH-A18G-01Breastbreast invasive carcinomaFemale>=65I/IIUnknownUnknownSD
HBA2SNVMissense_Mutationrs281864887c.343N>Ap.Pro115Thrp.P115TP69905protein_codingdeleterious(0.01)benign(0.132)TCGA-DS-A1OD-01Cervixcervical & endocervical cancerFemale<65I/IIChemotherapycisplatinSD
HBA2SNVMissense_Mutationrs267607269c.344N>Gp.Pro115Argp.P115RP69905protein_codingdeleterious(0.02)benign(0.012)TCGA-DS-A1OD-01Cervixcervical & endocervical cancerFemale<65I/IIChemotherapycisplatinSD
HBA2SNVMissense_Mutationc.103N>Ap.Leu35Metp.L35MP69905protein_codingtolerated(0.09)benign(0.026)TCGA-AP-A0LM-01Endometriumuterine corpus endometrioid carcinomaFemale<65III/IVChemotherapycisplatinSD
HBA2SNVMissense_Mutationrs3209323c.359C>Tp.Pro120Leup.P120LP69905protein_codingdeleterious(0)possibly_damaging(0.779)TCGA-BS-A0UF-01Endometriumuterine corpus endometrioid carcinomaFemale>=65I/IIUnknownUnknownSD
HBA2SNVMissense_Mutationc.374N>Tp.Ser125Phep.S125FP69905protein_codingdeleterious(0)possibly_damaging(0.773)TCGA-05-5425-01Lunglung adenocarcinomaMale>=65I/IITargeted Molecular therapygefitinibPD
HBA2SNVMissense_Mutationc.413N>Tp.Thr138Ilep.T138IP69905protein_codingdeleterious(0.04)benign(0.028)TCGA-78-7148-01Lunglung adenocarcinomaMale>=65I/IIUnknownUnknownPD
HBA2SNVMissense_Mutationnovelc.376N>Gp.Leu126Valp.L126VP69905protein_codingtolerated(0.3)benign(0.007)TCGA-21-1081-01Lunglung squamous cell carcinomaMale>=65I/IIUnknownUnknownPD
HBA2SNVMissense_Mutationrs281864887c.343N>Ap.Pro115Thrp.P115TP69905protein_codingdeleterious(0.01)benign(0.132)TCGA-90-7964-01Lunglung squamous cell carcinomaMale>=65I/IIUnknownUnknownSD
Page: 1 2 

Top

Related drugs of malignant transformation related genes

check buttonIdentification of chemicals and drugs interact with genes involved in malignant transfromation
(DGIdb 4.0)
Entrez IDSymbolCategoryInteraction TypesDrug Claim NameDrug NamePMIDs
3040HBA2NAnegative modulatorCHEMBL18901EFAPROXIRAL
Page: 1