
|
|||||
|
 | |
| |
| |
| |
| |
| |
|
Gene: GPAM |
Gene summary for GPAM |
| Gene information | Species | Human | Gene symbol | GPAM | Gene ID | 57678 |
| Gene name | glycerol-3-phosphate acyltransferase, mitochondrial | |
| Gene Alias | GPAT | |
| Cytomap | 10q25.2 | |
| Gene Type | protein-coding | GO ID | GO:0001775 | UniProtAcc | Q86T70 |
Top |
Malignant transformation analysis |
| Identification of the aberrant gene expression in precancerous and cancerous lesions by comparing the gene expression of stem-like cells in diseased tissues with normal stem cells |
| Entrez ID | Symbol | Replicates | Species | Organ | Tissue | Adj P-value | Log2FC | Malignancy |
| 57678 | GPAM | NAFLD1 | Human | Liver | NAFLD | 5.36e-15 | 1.13e+00 | -0.04 |
| 57678 | GPAM | S41 | Human | Liver | Cirrhotic | 5.26e-04 | 6.47e-01 | -0.0343 |
| 57678 | GPAM | S43 | Human | Liver | Cirrhotic | 2.13e-06 | -4.77e-02 | -0.0187 |
| 57678 | GPAM | HCC1_Meng | Human | Liver | HCC | 1.60e-55 | 2.23e-02 | 0.0246 |
| 57678 | GPAM | HCC2_Meng | Human | Liver | HCC | 1.72e-06 | -1.61e-01 | 0.0107 |
| 57678 | GPAM | HCC1 | Human | Liver | HCC | 4.88e-33 | 5.45e+00 | 0.5336 |
| 57678 | GPAM | HCC2 | Human | Liver | HCC | 1.15e-06 | 2.23e+00 | 0.5341 |
| 57678 | GPAM | Pt14.a | Human | Liver | HCC | 1.60e-04 | 3.98e-01 | 0.0169 |
| 57678 | GPAM | Pt14.b | Human | Liver | HCC | 1.57e-03 | 2.42e-01 | 0.018 |
| Page: 1 |
| Tissue | Expression Dynamics | Abbreviation |
| Liver | 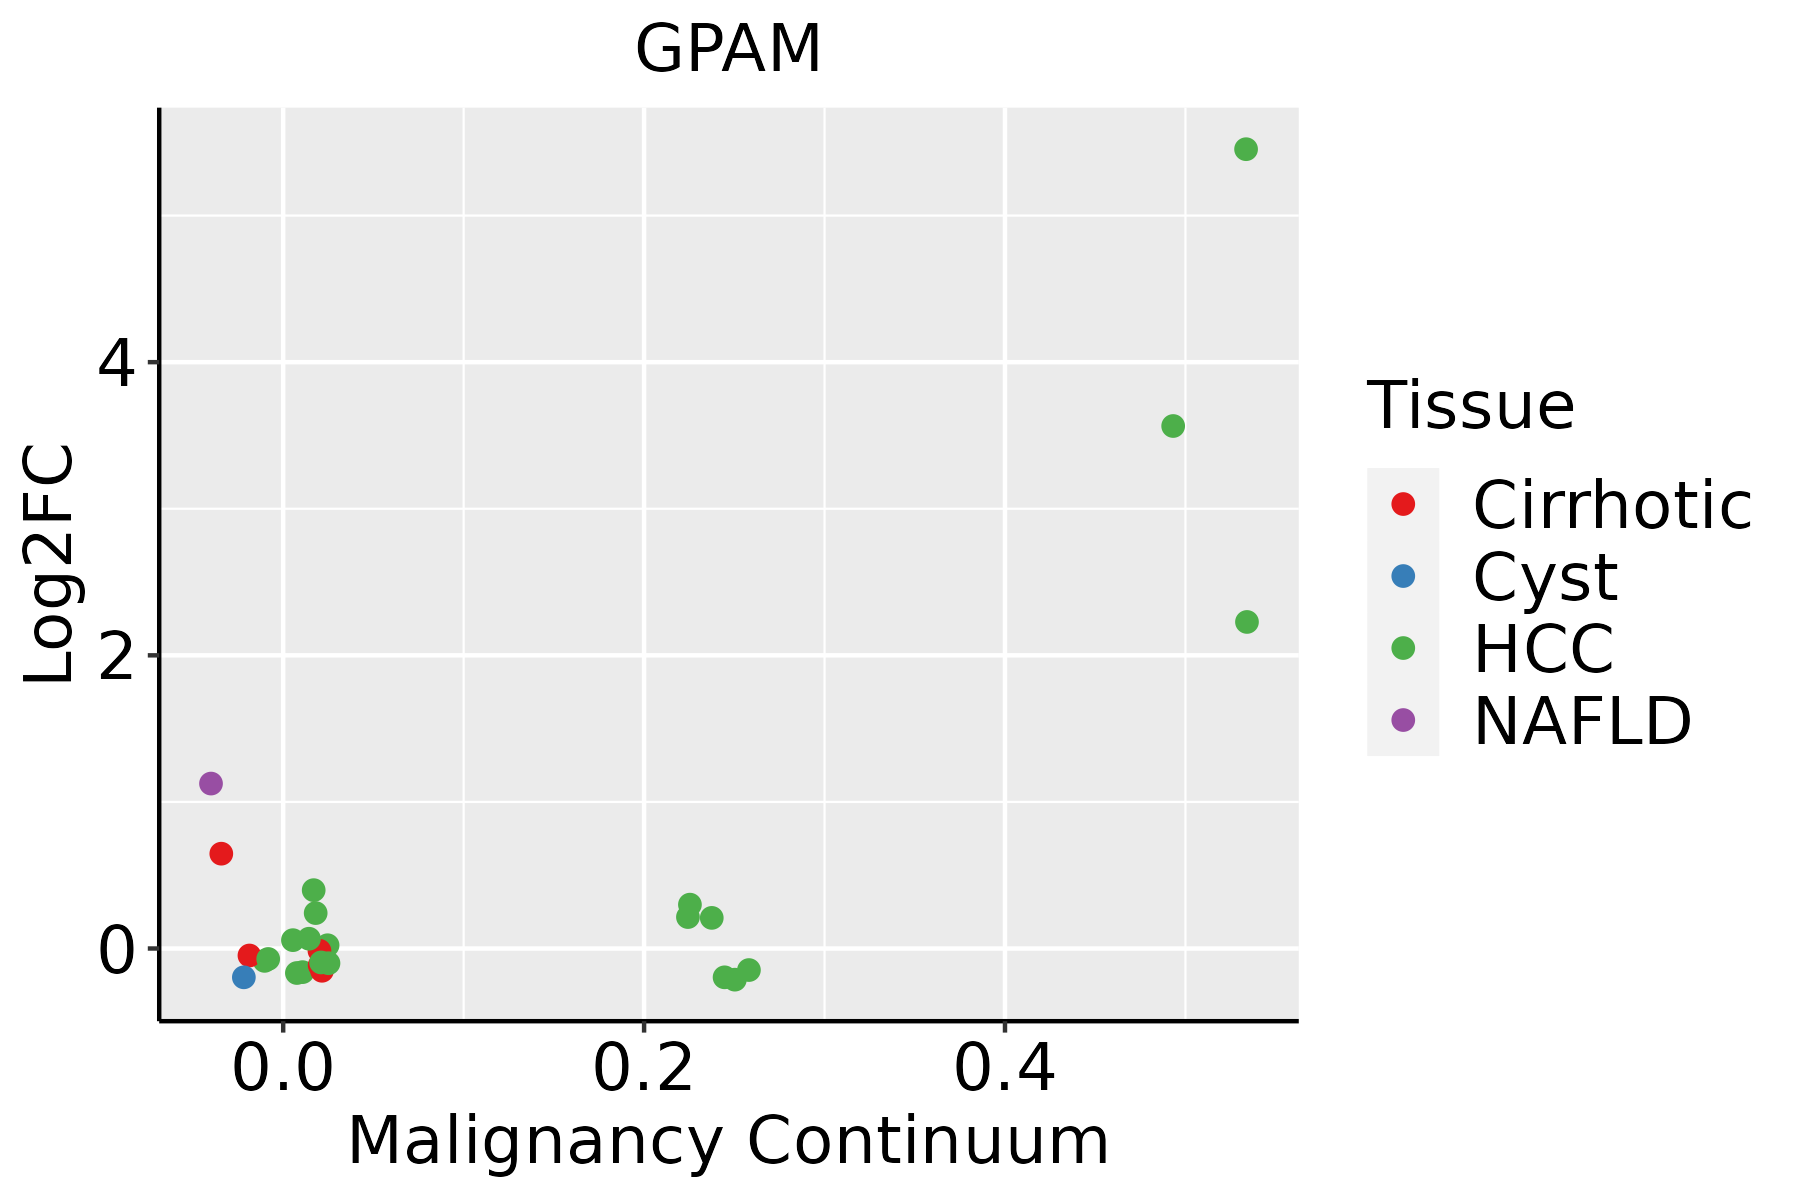 | HCC: Hepatocellular carcinoma |
| NAFLD: Non-alcoholic fatty liver disease |
| ∗log2FC in expression of this searched gene in stem-like cells from each diseased tissue sample relative to stem-like cells in normal samples in each tissue plotted against the malignancy continuum. Samples are colored based on if they are from different disease stage. |
Top |
Malignant transformation related pathway analysis |
| Find out the enriched GO biological processes and KEGG pathways involved in transition from healthy to precancer to cancer |
| Tissue | Disease Stage | Enriched GO biological Processes |
| Colorectum | AD |  |
| Colorectum | SER |  |
| Colorectum | MSS |  |
| Colorectum | MSI-H |  |
| Colorectum | FAP |  |
| ∗Top 15 enriched GO BP terms are showed in the bar plot of each disease state in each tissue. Each row represents a significant GO biological process which is colored according to the -log10(p.adjust). |
| Page: 1 2 3 4 5 6 7 8 9 |
| GO ID | Tissue | Disease Stage | Description | Gene Ratio | Bg Ratio | pvalue | p.adjust | Count |
| GO:003428422 | Liver | HCC | response to monosaccharide | 131/7958 | 225/18723 | 1.32e-06 | 1.91e-05 | 131 |
| GO:004501711 | Liver | HCC | glycerolipid biosynthetic process | 143/7958 | 252/18723 | 3.27e-06 | 4.31e-05 | 143 |
| GO:000974622 | Liver | HCC | response to hexose | 126/7958 | 219/18723 | 4.81e-06 | 6.06e-05 | 126 |
| GO:00066504 | Liver | HCC | glycerophospholipid metabolic process | 168/7958 | 306/18723 | 7.27e-06 | 8.62e-05 | 168 |
| GO:004647411 | Liver | HCC | glycerophospholipid biosynthetic process | 121/7958 | 211/18723 | 9.12e-06 | 1.06e-04 | 121 |
| GO:000974912 | Liver | HCC | response to glucose | 121/7958 | 212/18723 | 1.24e-05 | 1.39e-04 | 121 |
| GO:004887222 | Liver | HCC | homeostasis of number of cells | 147/7958 | 272/18723 | 7.48e-05 | 6.70e-04 | 147 |
| GO:00066412 | Liver | HCC | triglyceride metabolic process | 59/7958 | 100/18723 | 6.35e-04 | 3.93e-03 | 59 |
| GO:000663911 | Liver | HCC | acylglycerol metabolic process | 72/7958 | 128/18723 | 1.16e-03 | 6.54e-03 | 72 |
| GO:0006654 | Liver | HCC | phosphatidic acid biosynthetic process | 23/7958 | 33/18723 | 1.46e-03 | 7.75e-03 | 23 |
| GO:000663811 | Liver | HCC | neutral lipid metabolic process | 72/7958 | 129/18723 | 1.54e-03 | 8.14e-03 | 72 |
| GO:004578512 | Liver | HCC | positive regulation of cell adhesion | 215/7958 | 437/18723 | 2.53e-03 | 1.22e-02 | 215 |
| GO:00464732 | Liver | HCC | phosphatidic acid metabolic process | 24/7958 | 37/18723 | 5.03e-03 | 2.11e-02 | 24 |
| GO:0046341 | Liver | HCC | CDP-diacylglycerol metabolic process | 11/7958 | 14/18723 | 6.81e-03 | 2.73e-02 | 11 |
| GO:00194321 | Liver | HCC | triglyceride biosynthetic process | 26/7958 | 42/18723 | 8.76e-03 | 3.41e-02 | 26 |
| GO:003526421 | Liver | HCC | multicellular organism growth | 70/7958 | 132/18723 | 9.29e-03 | 3.57e-02 | 70 |
| GO:0052646 | Liver | HCC | alditol phosphate metabolic process | 9/7958 | 11/18723 | 9.51e-03 | 3.60e-02 | 9 |
| GO:0016024 | Liver | HCC | CDP-diacylglycerol biosynthetic process | 10/7958 | 13/18723 | 1.28e-02 | 4.61e-02 | 10 |
| GO:004592711 | Liver | HCC | positive regulation of growth | 128/7958 | 259/18723 | 1.41e-02 | 4.99e-02 | 128 |
| Page: 1 2 3 4 5 |
| Pathway ID | Tissue | Disease Stage | Description | Gene Ratio | Bg Ratio | pvalue | p.adjust | qvalue | Count |
| hsa005615 | Liver | HCC | Glycerolipid metabolism | 41/4020 | 63/8465 | 3.59e-03 | 1.12e-02 | 6.22e-03 | 41 |
| hsa0056112 | Liver | HCC | Glycerolipid metabolism | 41/4020 | 63/8465 | 3.59e-03 | 1.12e-02 | 6.22e-03 | 41 |
| Page: 1 |
Top |
Cell-cell communication analysis |
| Identification of potential cell-cell interactions between two cell types and their ligand-receptor pairs for different disease states |
| Ligand | Receptor | LRpair | Pathway | Tissue | Disease Stage |
| Page: 1 |
Top |
Single-cell gene regulatory network inference analysis |
| Find out the significant the regulons (TFs) and the target genes of each regulon across cell types for different disease states |
| TF | Cell Type | Tissue | Disease Stage | Target Gene | RSS | Regulon Activity |
| ∗The dot plots of a searched regulon are shown for all cell subpopulations in each disease state of each tissue based on the regulon specific score inferred using pySCENIC and by calculating the average expression. |
| Page: 1 |
Top |
Somatic mutation of malignant transformation related genes |
| Annotation of somatic variants for genes involved in malignant transformation |
| Hugo Symbol | Variant Class | Variant Classification | dbSNP RS | HGVSc | HGVSp | HGVSp Short | SWISSPROT | BIOTYPE | SIFT | PolyPhen | Tumor Sample Barcode | Tissue | Histology | Sex | Age | Stage | Therapy Types | Drugs | Outcome |
| GPAM | SNV | Missense_Mutation | c.431N>A | p.Ala144Glu | p.A144E | Q9HCL2 | protein_coding | tolerated(0.69) | benign(0) | TCGA-A2-A0CX-01 | Breast | breast invasive carcinoma | Female | <65 | I/II | Chemotherapy | adriamycin | SD | |
| GPAM | SNV | Missense_Mutation | novel | c.2449N>C | p.Lys817Gln | p.K817Q | Q9HCL2 | protein_coding | deleterious(0.03) | benign(0.444) | TCGA-AN-A046-01 | Breast | breast invasive carcinoma | Female | >=65 | I/II | Unknown | Unknown | SD |
| GPAM | SNV | Missense_Mutation | novel | c.2105N>A | p.Arg702Gln | p.R702Q | Q9HCL2 | protein_coding | tolerated(0.18) | probably_damaging(0.968) | TCGA-AN-A046-01 | Breast | breast invasive carcinoma | Female | >=65 | I/II | Unknown | Unknown | SD |
| GPAM | SNV | Missense_Mutation | novel | c.2185C>G | p.Leu729Val | p.L729V | Q9HCL2 | protein_coding | tolerated(0.16) | probably_damaging(0.987) | TCGA-AR-A0TQ-01 | Breast | breast invasive carcinoma | Female | <65 | III/IV | Chemotherapy | doxorubicin | SD |
| GPAM | SNV | Missense_Mutation | c.2234N>A | p.Pro745His | p.P745H | Q9HCL2 | protein_coding | deleterious(0.01) | possibly_damaging(0.641) | TCGA-BH-A0C0-01 | Breast | breast invasive carcinoma | Female | <65 | I/II | Chemotherapy | carboplatin | SD | |
| GPAM | SNV | Missense_Mutation | rs776876225 | c.562C>A | p.Leu188Met | p.L188M | Q9HCL2 | protein_coding | deleterious(0.02) | probably_damaging(0.996) | TCGA-E2-A15I-01 | Breast | breast invasive carcinoma | Female | <65 | I/II | Hormone Therapy | tamoxiphen | SD |
| GPAM | SNV | Missense_Mutation | novel | c.2201N>G | p.Ser734Cys | p.S734C | Q9HCL2 | protein_coding | deleterious(0.04) | benign(0.443) | TCGA-E2-A2P6-01 | Breast | breast invasive carcinoma | Female | >=65 | I/II | Hormone Therapy | anastrozole | SD |
| GPAM | insertion | Frame_Shift_Ins | novel | c.342_343insCAGACTGACTGGGTGGGTGCTGCTA | p.Ile115GlnfsTer16 | p.I115Qfs*16 | Q9HCL2 | protein_coding | TCGA-A2-A0CX-01 | Breast | breast invasive carcinoma | Female | <65 | I/II | Chemotherapy | adriamycin | SD | ||
| GPAM | insertion | Frame_Shift_Ins | novel | c.340_341insGT | p.Phe114CysfsTer17 | p.F114Cfs*17 | Q9HCL2 | protein_coding | TCGA-A2-A0CX-01 | Breast | breast invasive carcinoma | Female | <65 | I/II | Chemotherapy | adriamycin | SD | ||
| GPAM | insertion | In_Frame_Ins | novel | c.2419_2420insCTCTGAAAATGCATGAAAAACAAAGGCAAAAACTAG | p.Ser807delinsThrLeuLysMetHisGluLysGlnArgGlnLysLeuGly | p.S807delinsTLKMHEKQRQKLG | Q9HCL2 | protein_coding | TCGA-A8-A07J-01 | Breast | breast invasive carcinoma | Female | <65 | I/II | Chemotherapy | 5-fluorouracil | CR |
| Page: 1 2 3 4 5 6 7 8 9 |
Top |
Related drugs of malignant transformation related genes |
| Identification of chemicals and drugs interact with genes involved in malignant transfromation |
| (DGIdb 4.0) |
| Entrez ID | Symbol | Category | Interaction Types | Drug Claim Name | Drug Name | PMIDs |
| Page: 1 |

Copyright 2023-Present -The University of Texas Health Science Center at Houston |