
|
|||||
|
 | |
| |
| |
| |
| |
| |
|
Gene: GLUD1 |
Gene summary for GLUD1 |
| Gene information | Species | Human | Gene symbol | GLUD1 | Gene ID | 2746 |
| Gene name | glutamate dehydrogenase 1 | |
| Gene Alias | GDH | |
| Cytomap | 10q23.2 | |
| Gene Type | protein-coding | GO ID | GO:0002790 | UniProtAcc | P00367 |
Top |
Malignant transformation analysis |
| Identification of the aberrant gene expression in precancerous and cancerous lesions by comparing the gene expression of stem-like cells in diseased tissues with normal stem cells |
| Entrez ID | Symbol | Replicates | Species | Organ | Tissue | Adj P-value | Log2FC | Malignancy |
| 2746 | GLUD1 | LZE2T | Human | Esophagus | ESCC | 1.59e-06 | 8.06e-01 | 0.082 |
| 2746 | GLUD1 | LZE4T | Human | Esophagus | ESCC | 2.61e-06 | -2.69e-03 | 0.0811 |
| 2746 | GLUD1 | LZE5T | Human | Esophagus | ESCC | 2.08e-04 | 4.21e-01 | 0.0514 |
| 2746 | GLUD1 | LZE8T | Human | Esophagus | ESCC | 5.44e-07 | -8.07e-02 | 0.067 |
| 2746 | GLUD1 | LZE20T | Human | Esophagus | ESCC | 1.01e-10 | 7.28e-01 | 0.0662 |
| 2746 | GLUD1 | LZE22D1 | Human | Esophagus | HGIN | 2.64e-07 | 8.90e-01 | 0.0595 |
| 2746 | GLUD1 | LZE22T | Human | Esophagus | ESCC | 3.08e-13 | 1.76e+00 | 0.068 |
| 2746 | GLUD1 | LZE24T | Human | Esophagus | ESCC | 4.56e-40 | 1.88e+00 | 0.0596 |
| 2746 | GLUD1 | LZE21T | Human | Esophagus | ESCC | 4.35e-11 | 1.03e+00 | 0.0655 |
| 2746 | GLUD1 | P1T-E | Human | Esophagus | ESCC | 2.24e-27 | 2.16e+00 | 0.0875 |
| 2746 | GLUD1 | P2T-E | Human | Esophagus | ESCC | 2.90e-35 | 8.19e-01 | 0.1177 |
| 2746 | GLUD1 | P4T-E | Human | Esophagus | ESCC | 3.96e-45 | 1.39e+00 | 0.1323 |
| 2746 | GLUD1 | P5T-E | Human | Esophagus | ESCC | 9.98e-29 | 1.01e+00 | 0.1327 |
| 2746 | GLUD1 | P8T-E | Human | Esophagus | ESCC | 6.98e-80 | 1.73e+00 | 0.0889 |
| 2746 | GLUD1 | P9T-E | Human | Esophagus | ESCC | 1.16e-35 | 1.11e+00 | 0.1131 |
| 2746 | GLUD1 | P10T-E | Human | Esophagus | ESCC | 7.42e-21 | 5.22e-01 | 0.116 |
| 2746 | GLUD1 | P11T-E | Human | Esophagus | ESCC | 1.86e-16 | 1.48e+00 | 0.1426 |
| 2746 | GLUD1 | P12T-E | Human | Esophagus | ESCC | 6.24e-69 | 1.78e+00 | 0.1122 |
| 2746 | GLUD1 | P15T-E | Human | Esophagus | ESCC | 8.49e-52 | 1.35e+00 | 0.1149 |
| 2746 | GLUD1 | P16T-E | Human | Esophagus | ESCC | 1.03e-25 | 7.23e-01 | 0.1153 |
| Page: 1 2 3 4 5 6 7 8 |
| Tissue | Expression Dynamics | Abbreviation |
| Esophagus | 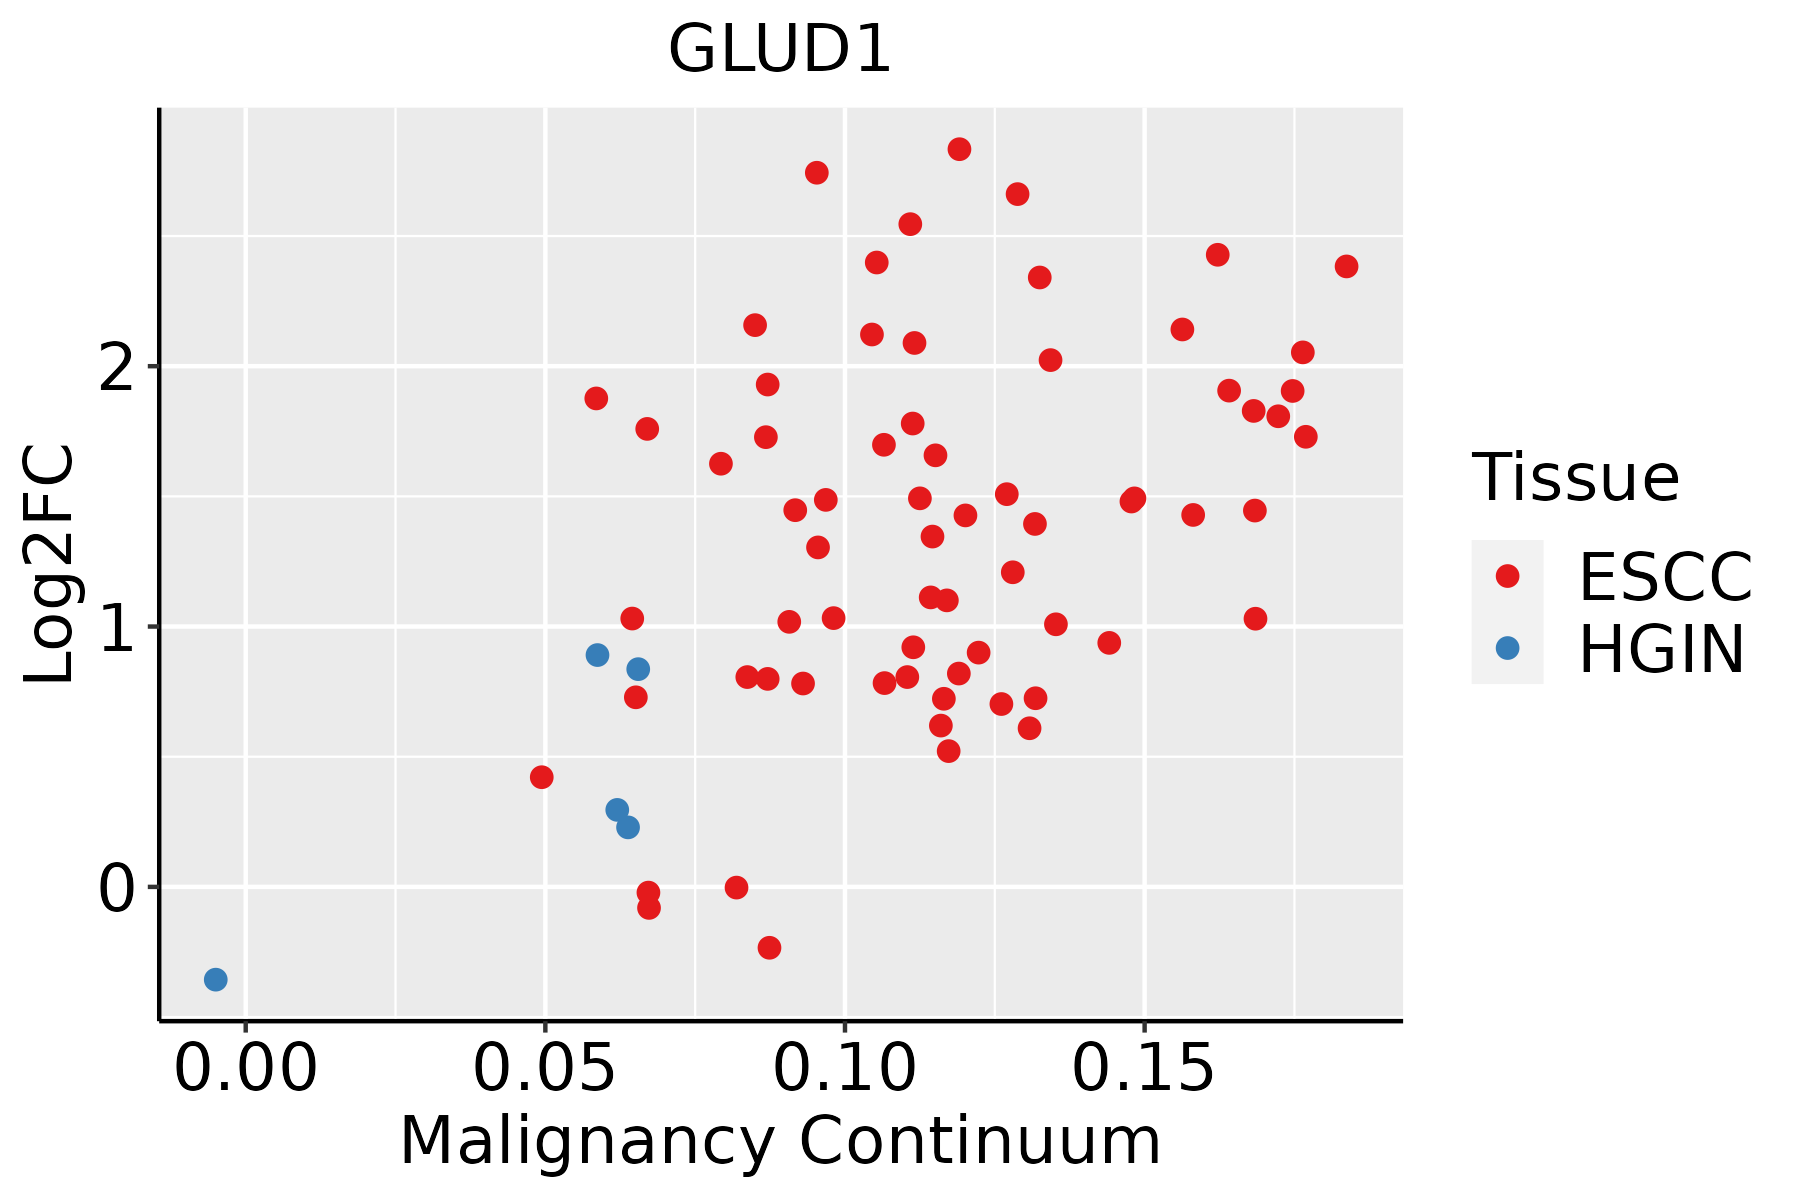 | ESCC: Esophageal squamous cell carcinoma |
| HGIN: High-grade intraepithelial neoplasias | ||
| LGIN: Low-grade intraepithelial neoplasias | ||
| Liver | 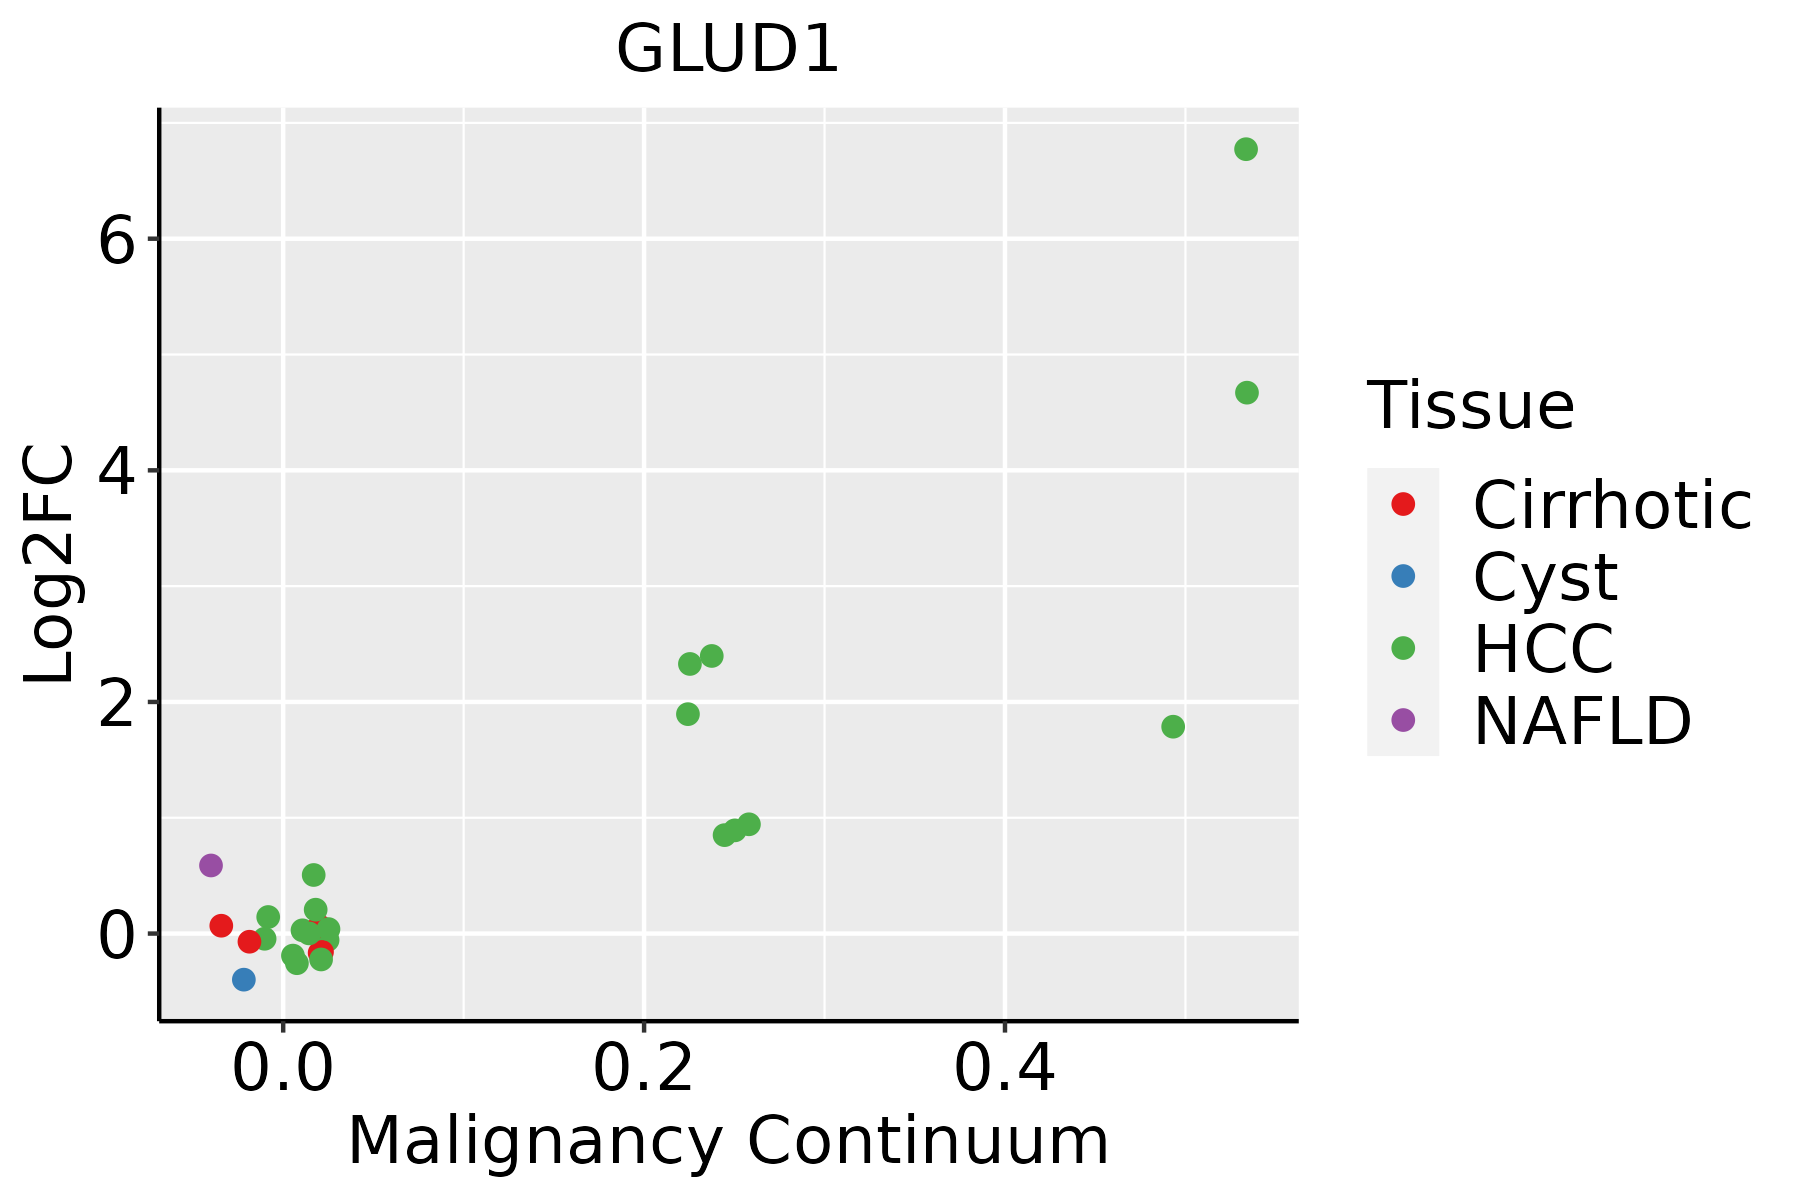 | HCC: Hepatocellular carcinoma |
| NAFLD: Non-alcoholic fatty liver disease | ||
| Oral Cavity |  | EOLP: Erosive Oral lichen planus |
| LP: leukoplakia | ||
| NEOLP: Non-erosive oral lichen planus | ||
| OSCC: Oral squamous cell carcinoma | ||
| Prostate |  | BPH: Benign Prostatic Hyperplasia |
| Skin |  | AK: Actinic keratosis |
| cSCC: Cutaneous squamous cell carcinoma | ||
| SCCIS:squamous cell carcinoma in situ | ||
| Thyroid |  | ATC: Anaplastic thyroid cancer |
| HT: Hashimoto's thyroiditis | ||
| PTC: Papillary thyroid cancer |
| ∗log2FC in expression of this searched gene in stem-like cells from each diseased tissue sample relative to stem-like cells in normal samples in each tissue plotted against the malignancy continuum. Samples are colored based on if they are from different disease stage. |
Top |
Malignant transformation related pathway analysis |
| Find out the enriched GO biological processes and KEGG pathways involved in transition from healthy to precancer to cancer |
| Tissue | Disease Stage | Enriched GO biological Processes |
| Colorectum | AD |  |
| Colorectum | SER |  |
| Colorectum | MSS |  |
| Colorectum | MSI-H |  |
| Colorectum | FAP |  |
| ∗Top 15 enriched GO BP terms are showed in the bar plot of each disease state in each tissue. Each row represents a significant GO biological process which is colored according to the -log10(p.adjust). |
| Page: 1 2 3 4 5 6 7 8 9 |
| GO ID | Tissue | Disease Stage | Description | Gene Ratio | Bg Ratio | pvalue | p.adjust | Count |
| GO:004885722 | Liver | HCC | neural nucleus development | 38/7958 | 64/18723 | 4.78e-03 | 2.02e-02 | 38 |
| GO:00723501 | Liver | HCC | tricarboxylic acid metabolic process | 11/7958 | 14/18723 | 6.81e-03 | 2.73e-02 | 11 |
| GO:003559212 | Liver | HCC | establishment of protein localization to extracellular region | 176/7958 | 360/18723 | 7.96e-03 | 3.15e-02 | 176 |
| GO:000930612 | Liver | HCC | protein secretion | 175/7958 | 359/18723 | 9.32e-03 | 3.57e-02 | 175 |
| GO:0006536 | Liver | HCC | glutamate metabolic process | 21/7958 | 33/18723 | 1.16e-02 | 4.28e-02 | 21 |
| GO:190495119 | Oral cavity | OSCC | positive regulation of establishment of protein localization | 196/7305 | 319/18723 | 2.89e-16 | 2.20e-14 | 196 |
| GO:005122219 | Oral cavity | OSCC | positive regulation of protein transport | 187/7305 | 303/18723 | 7.37e-16 | 5.49e-14 | 187 |
| GO:00160537 | Oral cavity | OSCC | organic acid biosynthetic process | 155/7305 | 316/18723 | 1.64e-04 | 1.13e-03 | 155 |
| GO:00463947 | Oral cavity | OSCC | carboxylic acid biosynthetic process | 154/7305 | 314/18723 | 1.73e-04 | 1.19e-03 | 154 |
| GO:002176219 | Oral cavity | OSCC | substantia nigra development | 28/7305 | 44/18723 | 8.15e-04 | 4.35e-03 | 28 |
| GO:000930610 | Oral cavity | OSCC | protein secretion | 169/7305 | 359/18723 | 1.04e-03 | 5.34e-03 | 169 |
| GO:003559210 | Oral cavity | OSCC | establishment of protein localization to extracellular region | 169/7305 | 360/18723 | 1.21e-03 | 6.08e-03 | 169 |
| GO:00716929 | Oral cavity | OSCC | protein localization to extracellular region | 172/7305 | 368/18723 | 1.40e-03 | 6.79e-03 | 172 |
| GO:00442826 | Oral cavity | OSCC | small molecule catabolic process | 174/7305 | 376/18723 | 2.25e-03 | 1.00e-02 | 174 |
| GO:005071414 | Oral cavity | OSCC | positive regulation of protein secretion | 70/7305 | 137/18723 | 2.64e-03 | 1.16e-02 | 70 |
| GO:00086524 | Oral cavity | OSCC | cellular amino acid biosynthetic process | 42/7305 | 76/18723 | 2.93e-03 | 1.27e-02 | 42 |
| GO:00723502 | Oral cavity | OSCC | tricarboxylic acid metabolic process | 11/7305 | 14/18723 | 3.09e-03 | 1.33e-02 | 11 |
| GO:00507089 | Oral cavity | OSCC | regulation of protein secretion | 126/7305 | 268/18723 | 4.41e-03 | 1.79e-02 | 126 |
| GO:00436484 | Oral cavity | OSCC | dicarboxylic acid metabolic process | 50/7305 | 96/18723 | 6.24e-03 | 2.35e-02 | 50 |
| GO:19016074 | Oral cavity | OSCC | alpha-amino acid biosynthetic process | 37/7305 | 68/18723 | 7.09e-03 | 2.63e-02 | 37 |
| Page: 1 2 3 4 5 6 7 8 9 |
| Pathway ID | Tissue | Disease Stage | Description | Gene Ratio | Bg Ratio | pvalue | p.adjust | qvalue | Count |
| hsa0120016 | Esophagus | HGIN | Carbon metabolism | 31/1383 | 115/8465 | 2.51e-03 | 2.10e-02 | 1.67e-02 | 31 |
| hsa0120017 | Esophagus | HGIN | Carbon metabolism | 31/1383 | 115/8465 | 2.51e-03 | 2.10e-02 | 1.67e-02 | 31 |
| hsa0120023 | Esophagus | ESCC | Carbon metabolism | 79/4205 | 115/8465 | 2.50e-05 | 1.21e-04 | 6.22e-05 | 79 |
| hsa0120033 | Esophagus | ESCC | Carbon metabolism | 79/4205 | 115/8465 | 2.50e-05 | 1.21e-04 | 6.22e-05 | 79 |
| hsa0120010 | Liver | NAFLD | Carbon metabolism | 26/1043 | 115/8465 | 1.39e-03 | 1.71e-02 | 1.38e-02 | 26 |
| hsa0120011 | Liver | NAFLD | Carbon metabolism | 26/1043 | 115/8465 | 1.39e-03 | 1.71e-02 | 1.38e-02 | 26 |
| hsa0120021 | Liver | Cirrhotic | Carbon metabolism | 64/2530 | 115/8465 | 6.37e-09 | 1.18e-07 | 7.26e-08 | 64 |
| hsa0120031 | Liver | Cirrhotic | Carbon metabolism | 64/2530 | 115/8465 | 6.37e-09 | 1.18e-07 | 7.26e-08 | 64 |
| hsa0120041 | Liver | HCC | Carbon metabolism | 89/4020 | 115/8465 | 3.92e-11 | 6.56e-10 | 3.65e-10 | 89 |
| hsa0120051 | Liver | HCC | Carbon metabolism | 89/4020 | 115/8465 | 3.92e-11 | 6.56e-10 | 3.65e-10 | 89 |
| hsa0120014 | Oral cavity | OSCC | Carbon metabolism | 74/3704 | 115/8465 | 6.10e-06 | 3.05e-05 | 1.55e-05 | 74 |
| hsa0120015 | Oral cavity | OSCC | Carbon metabolism | 74/3704 | 115/8465 | 6.10e-06 | 3.05e-05 | 1.55e-05 | 74 |
| hsa0120022 | Oral cavity | LP | Carbon metabolism | 62/2418 | 115/8465 | 8.38e-09 | 1.39e-07 | 8.99e-08 | 62 |
| hsa0421714 | Oral cavity | LP | Necroptosis | 59/2418 | 159/8465 | 1.15e-02 | 3.91e-02 | 2.52e-02 | 59 |
| hsa0120032 | Oral cavity | LP | Carbon metabolism | 62/2418 | 115/8465 | 8.38e-09 | 1.39e-07 | 8.99e-08 | 62 |
| hsa0421715 | Oral cavity | LP | Necroptosis | 59/2418 | 159/8465 | 1.15e-02 | 3.91e-02 | 2.52e-02 | 59 |
| hsa0421712 | Prostate | BPH | Necroptosis | 45/1718 | 159/8465 | 9.23e-03 | 2.85e-02 | 1.76e-02 | 45 |
| hsa0421713 | Prostate | BPH | Necroptosis | 45/1718 | 159/8465 | 9.23e-03 | 2.85e-02 | 1.76e-02 | 45 |
| hsa0421721 | Prostate | Tumor | Necroptosis | 46/1791 | 159/8465 | 1.20e-02 | 3.68e-02 | 2.28e-02 | 46 |
| hsa0421731 | Prostate | Tumor | Necroptosis | 46/1791 | 159/8465 | 1.20e-02 | 3.68e-02 | 2.28e-02 | 46 |
| Page: 1 |
Top |
Cell-cell communication analysis |
| Identification of potential cell-cell interactions between two cell types and their ligand-receptor pairs for different disease states |
| Ligand | Receptor | LRpair | Pathway | Tissue | Disease Stage |
| Page: 1 |
Top |
Single-cell gene regulatory network inference analysis |
| Find out the significant the regulons (TFs) and the target genes of each regulon across cell types for different disease states |
| TF | Cell Type | Tissue | Disease Stage | Target Gene | RSS | Regulon Activity |
| ∗The dot plots of a searched regulon are shown for all cell subpopulations in each disease state of each tissue based on the regulon specific score inferred using pySCENIC and by calculating the average expression. |
| Page: 1 |
Top |
Somatic mutation of malignant transformation related genes |
| Annotation of somatic variants for genes involved in malignant transformation |
| Hugo Symbol | Variant Class | Variant Classification | dbSNP RS | HGVSc | HGVSp | HGVSp Short | SWISSPROT | BIOTYPE | SIFT | PolyPhen | Tumor Sample Barcode | Tissue | Histology | Sex | Age | Stage | Therapy Types | Drugs | Outcome |
| GLUD1 | SNV | Missense_Mutation | c.169G>T | p.Val57Leu | p.V57L | P00367 | protein_coding | tolerated(0.35) | benign(0) | TCGA-AC-A23H-01 | Breast | breast invasive carcinoma | Female | >=65 | I/II | Unknown | Unknown | PD | |
| GLUD1 | SNV | Missense_Mutation | novel | c.1385N>A | p.Ser462Tyr | p.S462Y | P00367 | protein_coding | deleterious(0.02) | probably_damaging(0.994) | TCGA-AN-A046-01 | Breast | breast invasive carcinoma | Female | >=65 | I/II | Unknown | Unknown | SD |
| GLUD1 | insertion | Frame_Shift_Ins | novel | c.1431_1432insCCAGCCTGGCC | p.Phe478ProfsTer53 | p.F478Pfs*53 | P00367 | protein_coding | TCGA-A8-A076-01 | Breast | breast invasive carcinoma | Female | >=65 | I/II | Hormone Therapy | anastrozole | SD | ||
| GLUD1 | SNV | Missense_Mutation | c.1630N>C | p.Glu544Gln | p.E544Q | P00367 | protein_coding | tolerated(0.06) | benign(0.131) | TCGA-IR-A3LI-01 | Cervix | cervical & endocervical cancer | Female | <65 | I/II | Chemotherapy | cisplatin | CR | |
| GLUD1 | SNV | Missense_Mutation | c.947N>G | p.Ser316Cys | p.S316C | P00367 | protein_coding | tolerated(0.09) | benign(0.063) | TCGA-LP-A5U2-01 | Cervix | cervical & endocervical cancer | Female | <65 | III/IV | Unknown | Unknown | SD | |
| GLUD1 | SNV | Missense_Mutation | c.1546C>T | p.Arg516Cys | p.R516C | P00367 | protein_coding | deleterious(0) | probably_damaging(0.947) | TCGA-AA-3672-01 | Colorectum | colon adenocarcinoma | Female | >=65 | III/IV | Unknown | Unknown | SD | |
| GLUD1 | SNV | Missense_Mutation | c.692N>A | p.Arg231Gln | p.R231Q | P00367 | protein_coding | deleterious(0.03) | probably_damaging(0.931) | TCGA-AA-3977-01 | Colorectum | colon adenocarcinoma | Male | >=65 | I/II | Unknown | Unknown | SD | |
| GLUD1 | SNV | Missense_Mutation | c.1177G>A | p.Ala393Thr | p.A393T | P00367 | protein_coding | deleterious(0.03) | possibly_damaging(0.871) | TCGA-AU-6004-01 | Colorectum | colon adenocarcinoma | Female | >=65 | I/II | Unknown | Unknown | SD | |
| GLUD1 | insertion | Frame_Shift_Ins | novel | c.1157_1158insCTGTATGGTATGT | p.Lys386AsnfsTer22 | p.K386Nfs*22 | P00367 | protein_coding | TCGA-AM-5820-01 | Colorectum | colon adenocarcinoma | Female | <65 | I/II | Unknown | Unknown | SD | ||
| GLUD1 | SNV | Missense_Mutation | novel | c.649N>T | p.Pro217Ser | p.P217S | P00367 | protein_coding | deleterious(0) | possibly_damaging(0.82) | TCGA-A5-A0G1-01 | Endometrium | uterine corpus endometrioid carcinoma | Female | >=65 | I/II | Unknown | Unknown | SD |
| Page: 1 2 3 4 |
Top |
Related drugs of malignant transformation related genes |
| Identification of chemicals and drugs interact with genes involved in malignant transfromation |
| (DGIdb 4.0) |
| Entrez ID | Symbol | Category | Interaction Types | Drug Claim Name | Drug Name | PMIDs |
| Page: 1 |

Copyright 2023-Present -The University of Texas Health Science Center at Houston |