
|
|||||
|
 | |
| |
| |
| |
| |
| |
|
Gene: GALNT1 |
Gene summary for GALNT1 |
| Gene information | Species | Human | Gene symbol | GALNT1 | Gene ID | 2589 |
| Gene name | polypeptide N-acetylgalactosaminyltransferase 1 | |
| Gene Alias | GALNAC-T1 | |
| Cytomap | 18q12.2 | |
| Gene Type | protein-coding | GO ID | GO:0006464 | UniProtAcc | A0A024RC48 |
Top |
Malignant transformation analysis |
| Identification of the aberrant gene expression in precancerous and cancerous lesions by comparing the gene expression of stem-like cells in diseased tissues with normal stem cells |
| Entrez ID | Symbol | Replicates | Species | Organ | Tissue | Adj P-value | Log2FC | Malignancy |
| 2589 | GALNT1 | HTA11_3410_2000001011 | Human | Colorectum | AD | 1.09e-13 | -5.10e-01 | 0.0155 |
| 2589 | GALNT1 | HTA11_347_2000001011 | Human | Colorectum | AD | 2.18e-04 | 4.36e-01 | -0.1954 |
| 2589 | GALNT1 | HTA11_866_2000001011 | Human | Colorectum | AD | 1.89e-03 | -2.38e-01 | -0.1001 |
| 2589 | GALNT1 | HTA11_866_3004761011 | Human | Colorectum | AD | 4.31e-05 | -4.23e-01 | 0.096 |
| 2589 | GALNT1 | HTA11_10711_2000001011 | Human | Colorectum | AD | 3.37e-03 | -4.08e-01 | 0.0338 |
| 2589 | GALNT1 | HTA11_99999971662_82457 | Human | Colorectum | MSS | 2.59e-02 | -3.28e-01 | 0.3859 |
| 2589 | GALNT1 | HTA11_99999973899_84307 | Human | Colorectum | MSS | 1.82e-04 | -5.58e-01 | 0.2585 |
| 2589 | GALNT1 | HTA11_99999974143_84620 | Human | Colorectum | MSS | 5.75e-13 | -5.14e-01 | 0.3005 |
| 2589 | GALNT1 | A015-C-203 | Human | Colorectum | FAP | 2.05e-18 | -3.38e-01 | -0.1294 |
| 2589 | GALNT1 | A014-C-040 | Human | Colorectum | FAP | 2.89e-02 | -1.89e-01 | -0.1184 |
| 2589 | GALNT1 | A002-C-201 | Human | Colorectum | FAP | 3.76e-11 | -2.82e-01 | 0.0324 |
| 2589 | GALNT1 | A002-C-203 | Human | Colorectum | FAP | 4.10e-03 | -1.57e-01 | 0.2786 |
| 2589 | GALNT1 | A001-C-108 | Human | Colorectum | FAP | 3.25e-12 | -9.16e-02 | -0.0272 |
| 2589 | GALNT1 | A002-C-205 | Human | Colorectum | FAP | 1.91e-15 | -3.47e-01 | -0.1236 |
| 2589 | GALNT1 | A015-C-005 | Human | Colorectum | FAP | 8.35e-03 | -2.11e-01 | -0.0336 |
| 2589 | GALNT1 | A015-C-006 | Human | Colorectum | FAP | 7.61e-11 | -2.16e-01 | -0.0994 |
| 2589 | GALNT1 | A015-C-106 | Human | Colorectum | FAP | 6.27e-08 | -1.78e-01 | -0.0511 |
| 2589 | GALNT1 | A002-C-114 | Human | Colorectum | FAP | 2.54e-14 | -2.92e-01 | -0.1561 |
| 2589 | GALNT1 | A015-C-104 | Human | Colorectum | FAP | 5.35e-24 | -3.86e-01 | -0.1899 |
| 2589 | GALNT1 | A001-C-014 | Human | Colorectum | FAP | 1.60e-06 | -1.19e-01 | 0.0135 |
| Page: 1 2 3 4 5 6 7 8 |
| Tissue | Expression Dynamics | Abbreviation |
| Colorectum (GSE201348) |  | FAP: Familial adenomatous polyposis |
| CRC: Colorectal cancer | ||
| Colorectum (HTA11) |  | AD: Adenomas |
| SER: Sessile serrated lesions | ||
| MSI-H: Microsatellite-high colorectal cancer | ||
| MSS: Microsatellite stable colorectal cancer | ||
| Esophagus |  | ESCC: Esophageal squamous cell carcinoma |
| HGIN: High-grade intraepithelial neoplasias | ||
| LGIN: Low-grade intraepithelial neoplasias | ||
| Liver |  | HCC: Hepatocellular carcinoma |
| NAFLD: Non-alcoholic fatty liver disease | ||
| Oral Cavity | 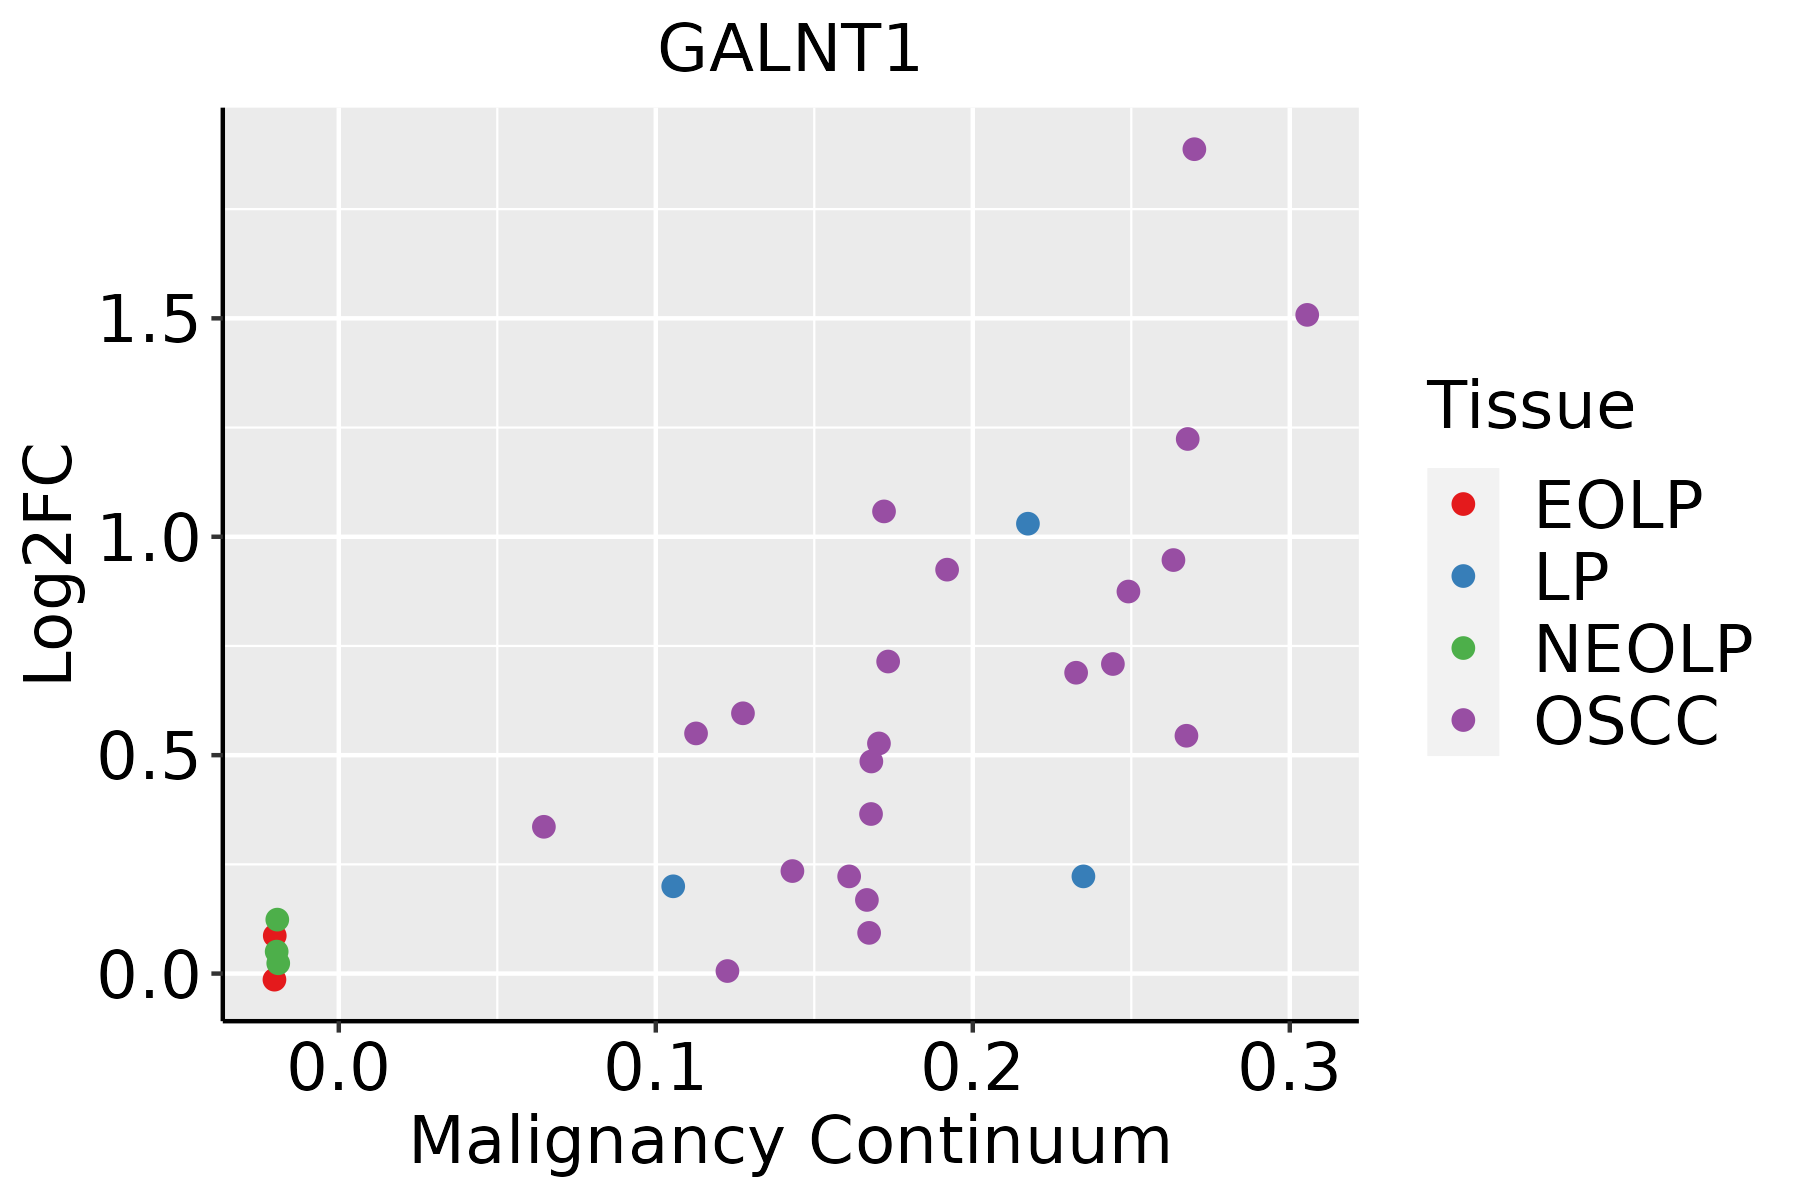 | EOLP: Erosive Oral lichen planus |
| LP: leukoplakia | ||
| NEOLP: Non-erosive oral lichen planus | ||
| OSCC: Oral squamous cell carcinoma | ||
| Prostate |  | BPH: Benign Prostatic Hyperplasia |
| Skin |  | AK: Actinic keratosis |
| cSCC: Cutaneous squamous cell carcinoma | ||
| SCCIS:squamous cell carcinoma in situ | ||
| Thyroid | 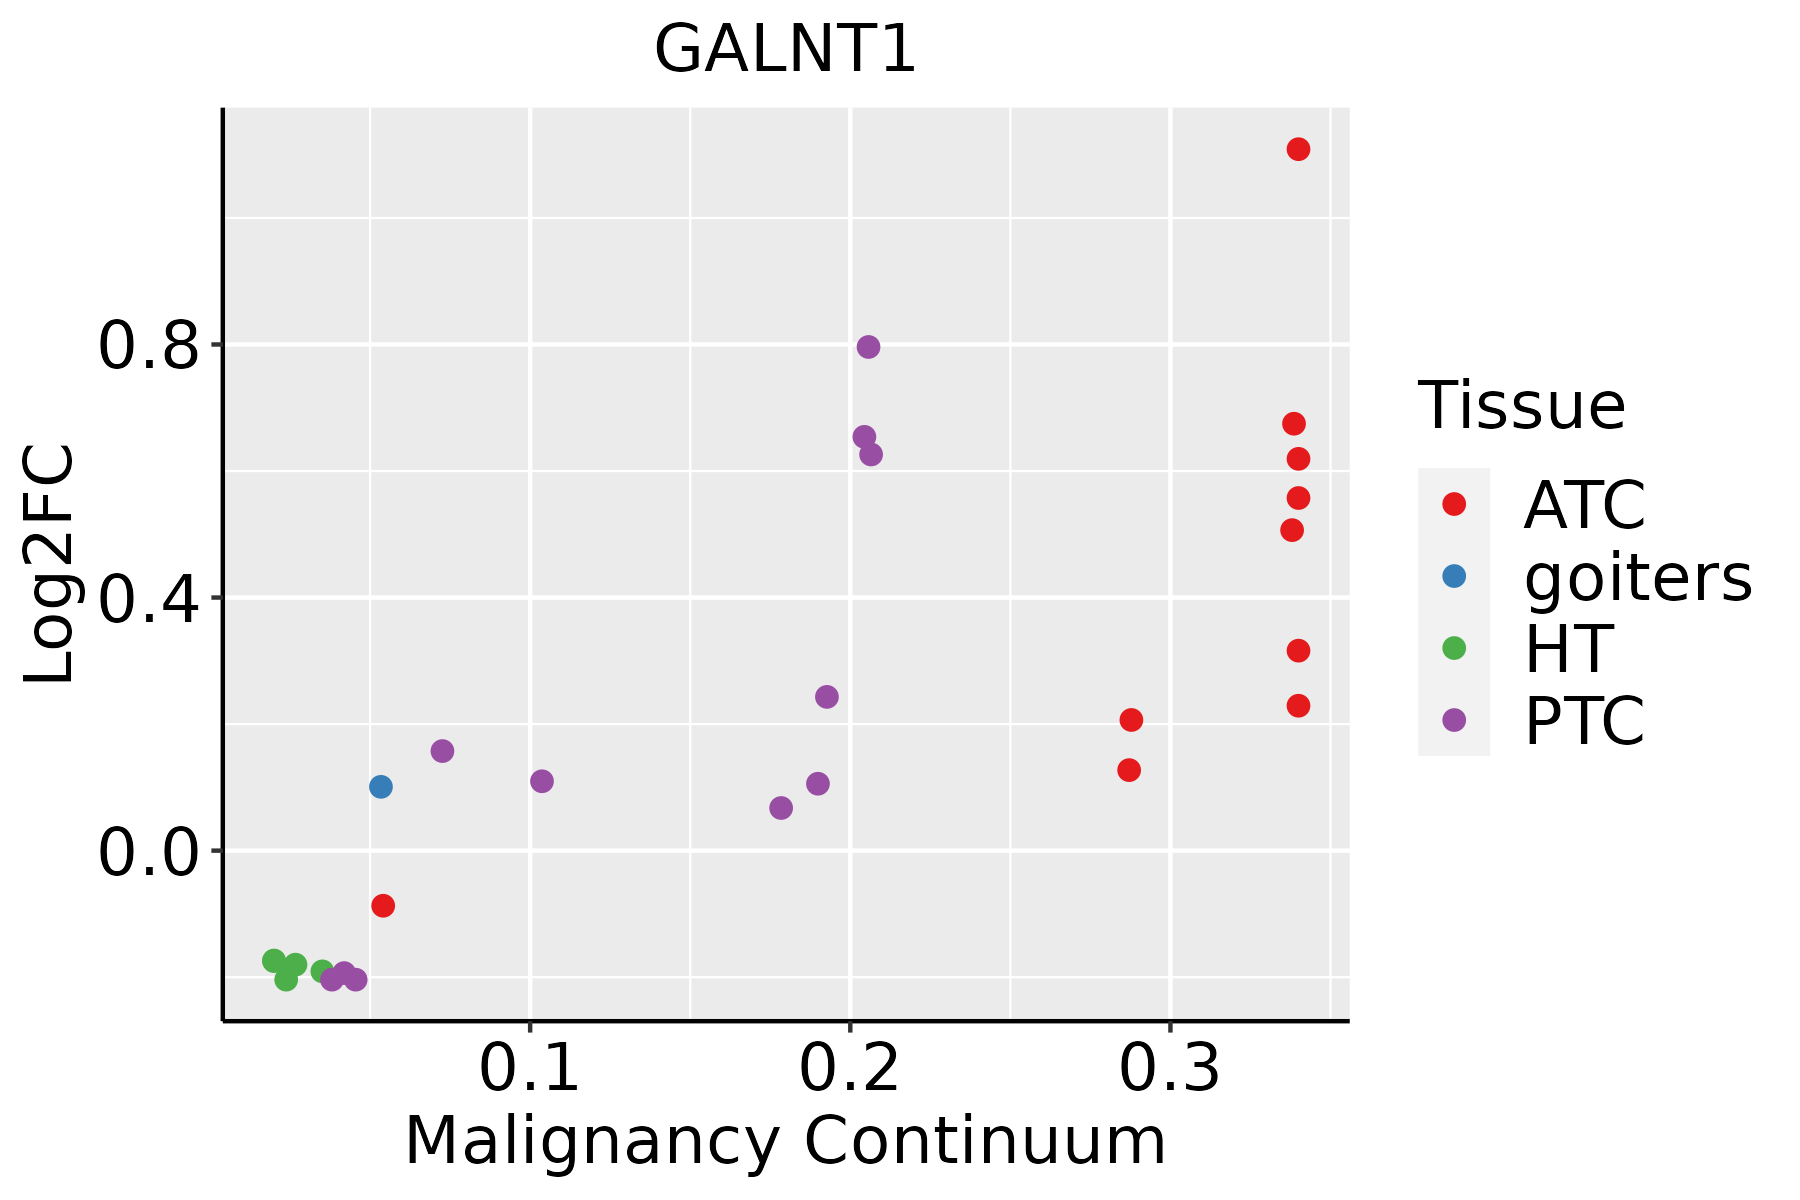 | ATC: Anaplastic thyroid cancer |
| HT: Hashimoto's thyroiditis | ||
| PTC: Papillary thyroid cancer |
| ∗log2FC in expression of this searched gene in stem-like cells from each diseased tissue sample relative to stem-like cells in normal samples in each tissue plotted against the malignancy continuum. Samples are colored based on if they are from different disease stage. |
Top |
Malignant transformation related pathway analysis |
| Find out the enriched GO biological processes and KEGG pathways involved in transition from healthy to precancer to cancer |
| Tissue | Disease Stage | Enriched GO biological Processes |
| Colorectum | AD |  |
| Colorectum | SER |  |
| Colorectum | MSS |  |
| Colorectum | MSI-H |  |
| Colorectum | FAP |  |
| ∗Top 15 enriched GO BP terms are showed in the bar plot of each disease state in each tissue. Each row represents a significant GO biological process which is colored according to the -log10(p.adjust). |
| Page: 1 2 3 4 5 6 7 8 9 |
| GO ID | Tissue | Disease Stage | Description | Gene Ratio | Bg Ratio | pvalue | p.adjust | Count |
| GO:00072196 | Oral cavity | OSCC | Notch signaling pathway | 92/7305 | 172/18723 | 7.84e-05 | 6.08e-04 | 92 |
| GO:00066651 | Oral cavity | OSCC | sphingolipid metabolic process | 84/7305 | 155/18723 | 8.64e-05 | 6.61e-04 | 84 |
| GO:00464672 | Oral cavity | OSCC | membrane lipid biosynthetic process | 77/7305 | 142/18723 | 1.63e-04 | 1.13e-03 | 77 |
| GO:00091001 | Oral cavity | OSCC | glycoprotein metabolic process | 185/7305 | 387/18723 | 2.37e-04 | 1.54e-03 | 185 |
| GO:00085934 | Oral cavity | OSCC | regulation of Notch signaling pathway | 53/7305 | 95/18723 | 6.64e-04 | 3.72e-03 | 53 |
| GO:00091011 | Oral cavity | OSCC | glycoprotein biosynthetic process | 151/7305 | 317/18723 | 1.01e-03 | 5.26e-03 | 151 |
| GO:00064864 | Oral cavity | OSCC | protein glycosylation | 111/7305 | 226/18723 | 1.22e-03 | 6.10e-03 | 111 |
| GO:00434134 | Oral cavity | OSCC | macromolecule glycosylation | 111/7305 | 226/18723 | 1.22e-03 | 6.10e-03 | 111 |
| GO:00700853 | Oral cavity | OSCC | glycosylation | 117/7305 | 240/18723 | 1.29e-03 | 6.42e-03 | 117 |
| GO:00199154 | Oral cavity | OSCC | lipid storage | 48/7305 | 87/18723 | 1.60e-03 | 7.62e-03 | 48 |
| GO:00066641 | Oral cavity | OSCC | glycolipid metabolic process | 53/7305 | 100/18723 | 3.09e-03 | 1.33e-02 | 53 |
| GO:00190825 | Oral cavity | OSCC | viral protein processing | 19/7305 | 29/18723 | 3.47e-03 | 1.47e-02 | 19 |
| GO:00182109 | Oral cavity | OSCC | peptidyl-threonine modification | 64/7305 | 125/18723 | 3.68e-03 | 1.52e-02 | 64 |
| GO:19035091 | Oral cavity | OSCC | liposaccharide metabolic process | 53/7305 | 101/18723 | 4.06e-03 | 1.66e-02 | 53 |
| GO:0006672 | Oral cavity | OSCC | ceramide metabolic process | 53/7305 | 102/18723 | 5.28e-03 | 2.06e-02 | 53 |
| GO:0030148 | Oral cavity | OSCC | sphingolipid biosynthetic process | 53/7305 | 103/18723 | 6.81e-03 | 2.53e-02 | 53 |
| GO:0016032110 | Oral cavity | LP | viral process | 211/4623 | 415/18723 | 4.06e-31 | 3.18e-28 | 211 |
| GO:001908015 | Oral cavity | LP | viral gene expression | 53/4623 | 94/18723 | 5.06e-11 | 3.14e-09 | 53 |
| GO:001908212 | Oral cavity | LP | viral protein processing | 17/4623 | 29/18723 | 1.02e-04 | 1.24e-03 | 17 |
| GO:007008511 | Oral cavity | LP | glycosylation | 77/4623 | 240/18723 | 5.60e-03 | 3.38e-02 | 77 |
| Page: 1 2 3 4 5 6 7 |
| Pathway ID | Tissue | Disease Stage | Description | Gene Ratio | Bg Ratio | pvalue | p.adjust | qvalue | Count |
| Page: 1 |
Top |
Cell-cell communication analysis |
| Identification of potential cell-cell interactions between two cell types and their ligand-receptor pairs for different disease states |
| Ligand | Receptor | LRpair | Pathway | Tissue | Disease Stage |
| Page: 1 |
Top |
Single-cell gene regulatory network inference analysis |
| Find out the significant the regulons (TFs) and the target genes of each regulon across cell types for different disease states |
| TF | Cell Type | Tissue | Disease Stage | Target Gene | RSS | Regulon Activity |
| ∗The dot plots of a searched regulon are shown for all cell subpopulations in each disease state of each tissue based on the regulon specific score inferred using pySCENIC and by calculating the average expression. |
| Page: 1 |
Top |
Somatic mutation of malignant transformation related genes |
| Annotation of somatic variants for genes involved in malignant transformation |
| Hugo Symbol | Variant Class | Variant Classification | dbSNP RS | HGVSc | HGVSp | HGVSp Short | SWISSPROT | BIOTYPE | SIFT | PolyPhen | Tumor Sample Barcode | Tissue | Histology | Sex | Age | Stage | Therapy Types | Drugs | Outcome |
| GALNT1 | SNV | Missense_Mutation | c.1566N>T | p.Gln522His | p.Q522H | Q10472 | protein_coding | tolerated(0.13) | benign(0.031) | TCGA-A2-A04T-01 | Breast | breast invasive carcinoma | Female | <65 | I/II | Chemotherapy | cyclophosphamide | SD | |
| GALNT1 | SNV | Missense_Mutation | novel | c.96N>A | p.Asn32Lys | p.N32K | Q10472 | protein_coding | tolerated(0.07) | benign(0.003) | TCGA-AC-A3QQ-01 | Breast | breast invasive carcinoma | Female | <65 | I/II | Unknown | Unknown | SD |
| GALNT1 | SNV | Missense_Mutation | novel | c.320N>G | p.Lys107Arg | p.K107R | Q10472 | protein_coding | tolerated(0.65) | benign(0.003) | TCGA-AQ-A54O-01 | Breast | breast invasive carcinoma | Male | <65 | I/II | Chemotherapy | adriamycin | CR |
| GALNT1 | SNV | Missense_Mutation | c.163C>T | p.His55Tyr | p.H55Y | Q10472 | protein_coding | tolerated(0.57) | benign(0) | TCGA-D8-A27G-01 | Breast | breast invasive carcinoma | Female | >=65 | I/II | Unknown | Unknown | SD | |
| GALNT1 | insertion | Nonsense_Mutation | novel | c.1017_1018insAACAGCTTTTAAAAACAAAAACTGATTGATTGTAAATTTTAAAT | p.Ser340AsnfsTer4 | p.S340Nfs*4 | Q10472 | protein_coding | TCGA-A8-A09A-01 | Breast | breast invasive carcinoma | Female | <65 | I/II | Hormone Therapy | tamoxiphen | SD | ||
| GALNT1 | insertion | In_Frame_Ins | novel | c.94_95insAAATTT | p.Asn32delinsLysIleTyr | p.N32delinsKIY | Q10472 | protein_coding | TCGA-AC-A3QQ-01 | Breast | breast invasive carcinoma | Female | <65 | I/II | Unknown | Unknown | SD | ||
| GALNT1 | SNV | Missense_Mutation | novel | c.424N>T | p.Arg142Cys | p.R142C | Q10472 | protein_coding | deleterious(0) | probably_damaging(0.999) | TCGA-C5-A2M1-01 | Cervix | cervical & endocervical cancer | Female | <65 | I/II | Unknown | Unknown | SD |
| GALNT1 | SNV | Missense_Mutation | c.966N>C | p.Glu322Asp | p.E322D | Q10472 | protein_coding | deleterious(0) | probably_damaging(0.999) | TCGA-AA-3977-01 | Colorectum | colon adenocarcinoma | Male | >=65 | I/II | Unknown | Unknown | SD | |
| GALNT1 | SNV | Missense_Mutation | novel | c.1154C>A | p.Ser385Tyr | p.S385Y | Q10472 | protein_coding | tolerated(0.33) | benign(0.052) | TCGA-AG-A002-01 | Colorectum | rectum adenocarcinoma | Male | <65 | I/II | Unknown | Unknown | SD |
| GALNT1 | deletion | Frame_Shift_Del | c.113delA | p.Lys38ArgfsTer11 | p.K38Rfs*11 | Q10472 | protein_coding | TCGA-AA-3492-01 | Colorectum | colon adenocarcinoma | Female | >=65 | I/II | Unknown | Unknown | SD |
| Page: 1 2 3 4 5 6 |
Top |
Related drugs of malignant transformation related genes |
| Identification of chemicals and drugs interact with genes involved in malignant transfromation |
| (DGIdb 4.0) |
| Entrez ID | Symbol | Category | Interaction Types | Drug Claim Name | Drug Name | PMIDs |
| Page: 1 |

Copyright 2023-Present -The University of Texas Health Science Center at Houston |