Schematic overview of the cellular and molecular mechanisms involved in the cancer progression, including the proposed cellular and molecular mechanisms in cancer cells trajectory. AT1: alveolar type 1 cells; AT2: alveolar type 2 cells; AAH: atypical adenomatous hyperplasia; AIS: adenocarcinoma in situ; MIA: minimally invasive adenocarcinoma; IA: invasive adenocarcinoma; EMT: epithelial-mesenchymal transition

Home

Download

Statistics

Help

Contact

Center for Computational Systems Medicine
leaf

Gene summary

leaf

Malignant transformation analysis

leaf

Malignant transformation related pathway analysis

leaf

Cell-cell communication analysis

leaf

Single-cell gene regulatory network inference analysis

leaf

Somatic mutation of malignant transformation related genes

leaf

Related drugs of malignant transformation related genes

Gene: EMILIN1

Gene summary for EMILIN1

check button Gene summary.

Gene informationSpeciesHuman
Gene symbol

EMILIN1

Gene ID

11117

Gene nameelastin microfibril interfacer 1
Gene AliasEMI
Cytomap2p23.3
Gene Typeprotein-coding
GO ID

GO:0000165

UniProtAcc

Q9Y6C2


Top

Malignant transformation analysis

check button Identification of the aberrant gene expression in precancerous and cancerous lesions by comparing the gene expression of stem-like cells in diseased tissues with normal stem cells
check button Malignant transformation involving gene list.
Entrez IDSymbolReplicatesSpeciesOrganTissueAdj P-valueLog2FCMalignancy
11117EMILIN1AEH-subject1HumanEndometriumAEH7.92e-24-4.80e-01-0.3059
11117EMILIN1AEH-subject2HumanEndometriumAEH5.67e-27-4.94e-01-0.2525
11117EMILIN1AEH-subject3HumanEndometriumAEH6.19e-21-4.66e-01-0.2576
11117EMILIN1AEH-subject4HumanEndometriumAEH3.20e-10-3.86e-01-0.2657
11117EMILIN1AEH-subject5HumanEndometriumAEH3.14e-30-5.00e-01-0.2953
11117EMILIN1EEC-subject1HumanEndometriumEEC3.93e-21-4.90e-01-0.2682
11117EMILIN1EEC-subject2HumanEndometriumEEC8.22e-27-4.98e-01-0.2607
11117EMILIN1EEC-subject3HumanEndometriumEEC2.32e-33-4.88e-01-0.2525
11117EMILIN1EEC-subject4HumanEndometriumEEC1.98e-27-4.80e-01-0.2571
11117EMILIN1EEC-subject5HumanEndometriumEEC3.42e-26-4.98e-01-0.249
11117EMILIN1GSM5276935HumanEndometriumEEC5.05e-31-4.94e-01-0.123
11117EMILIN1GSM6177620_NYU_UCEC1_lib1_lib1HumanEndometriumEEC1.19e-24-5.02e-01-0.1869
11117EMILIN1GSM6177620_NYU_UCEC1_lib2_lib2HumanEndometriumEEC5.85e-22-5.02e-01-0.1875
11117EMILIN1GSM6177620_NYU_UCEC1_lib3_lib3HumanEndometriumEEC1.62e-25-5.02e-01-0.1883
11117EMILIN1GSM6177621_NYU_UCEC2_lib1_lib1HumanEndometriumEEC4.41e-32-4.95e-01-0.1934
11117EMILIN1GSM6177622_NYU_UCEC3_lib1_lib1HumanEndometriumEEC1.26e-30-5.02e-01-0.1917
11117EMILIN1GSM6177622_NYU_UCEC3_lib2_lib2HumanEndometriumEEC3.17e-31-4.89e-01-0.1916
11117EMILIN1GSM6177623_NYU_UCEC3_VisHumanEndometriumEEC4.91e-19-4.56e-01-0.1269
11117EMILIN1P2T-EHumanEsophagusESCC1.84e-541.02e+000.1177
11117EMILIN1P4T-EHumanEsophagusESCC2.81e-073.71e-010.1323
Page: 1 2 3 

check button Transcriptomic changes along malignancy continuum.
TissueExpression DynamicsAbbreviation
EndometriumThe image shows the transcriptomic changes along malignancy continuum.log2FC in expression of this searched gene in stem-like cells from each diseased tissue sample relative to stem-like cells in normal samples in each tissue plotted against the malignancy continuum. Samples are colored based on if they are from different disease stage.
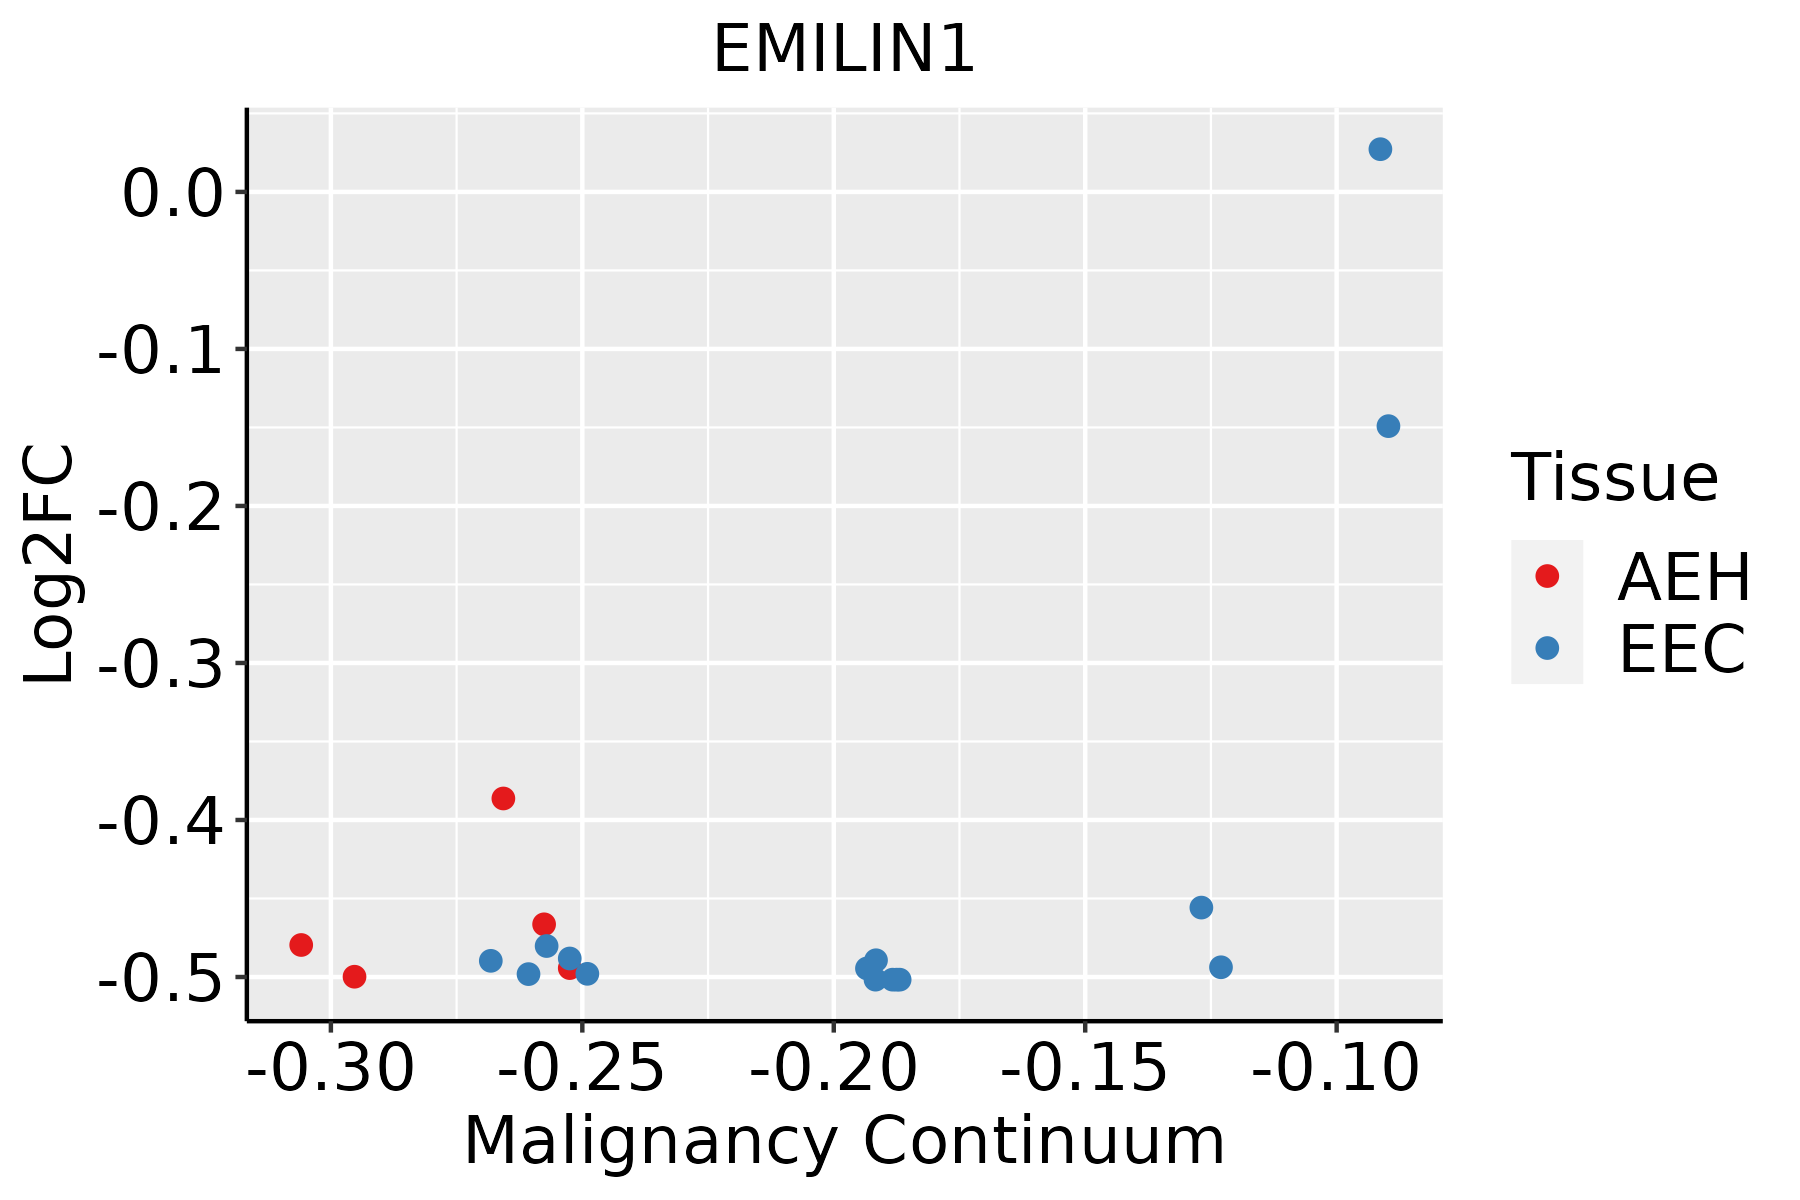
AEH: Atypical endometrial hyperplasia
EEC: Endometrioid Cancer
EsophagusThe image shows the transcriptomic changes along malignancy continuum.log2FC in expression of this searched gene in stem-like cells from each diseased tissue sample relative to stem-like cells in normal samples in each tissue plotted against the malignancy continuum. Samples are colored based on if they are from different disease stage.ESCC: Esophageal squamous cell carcinoma
HGIN: High-grade intraepithelial neoplasias
LGIN: Low-grade intraepithelial neoplasias
Oral CavityThe image shows the transcriptomic changes along malignancy continuum.log2FC in expression of this searched gene in stem-like cells from each diseased tissue sample relative to stem-like cells in normal samples in each tissue plotted against the malignancy continuum. Samples are colored based on if they are from different disease stage.
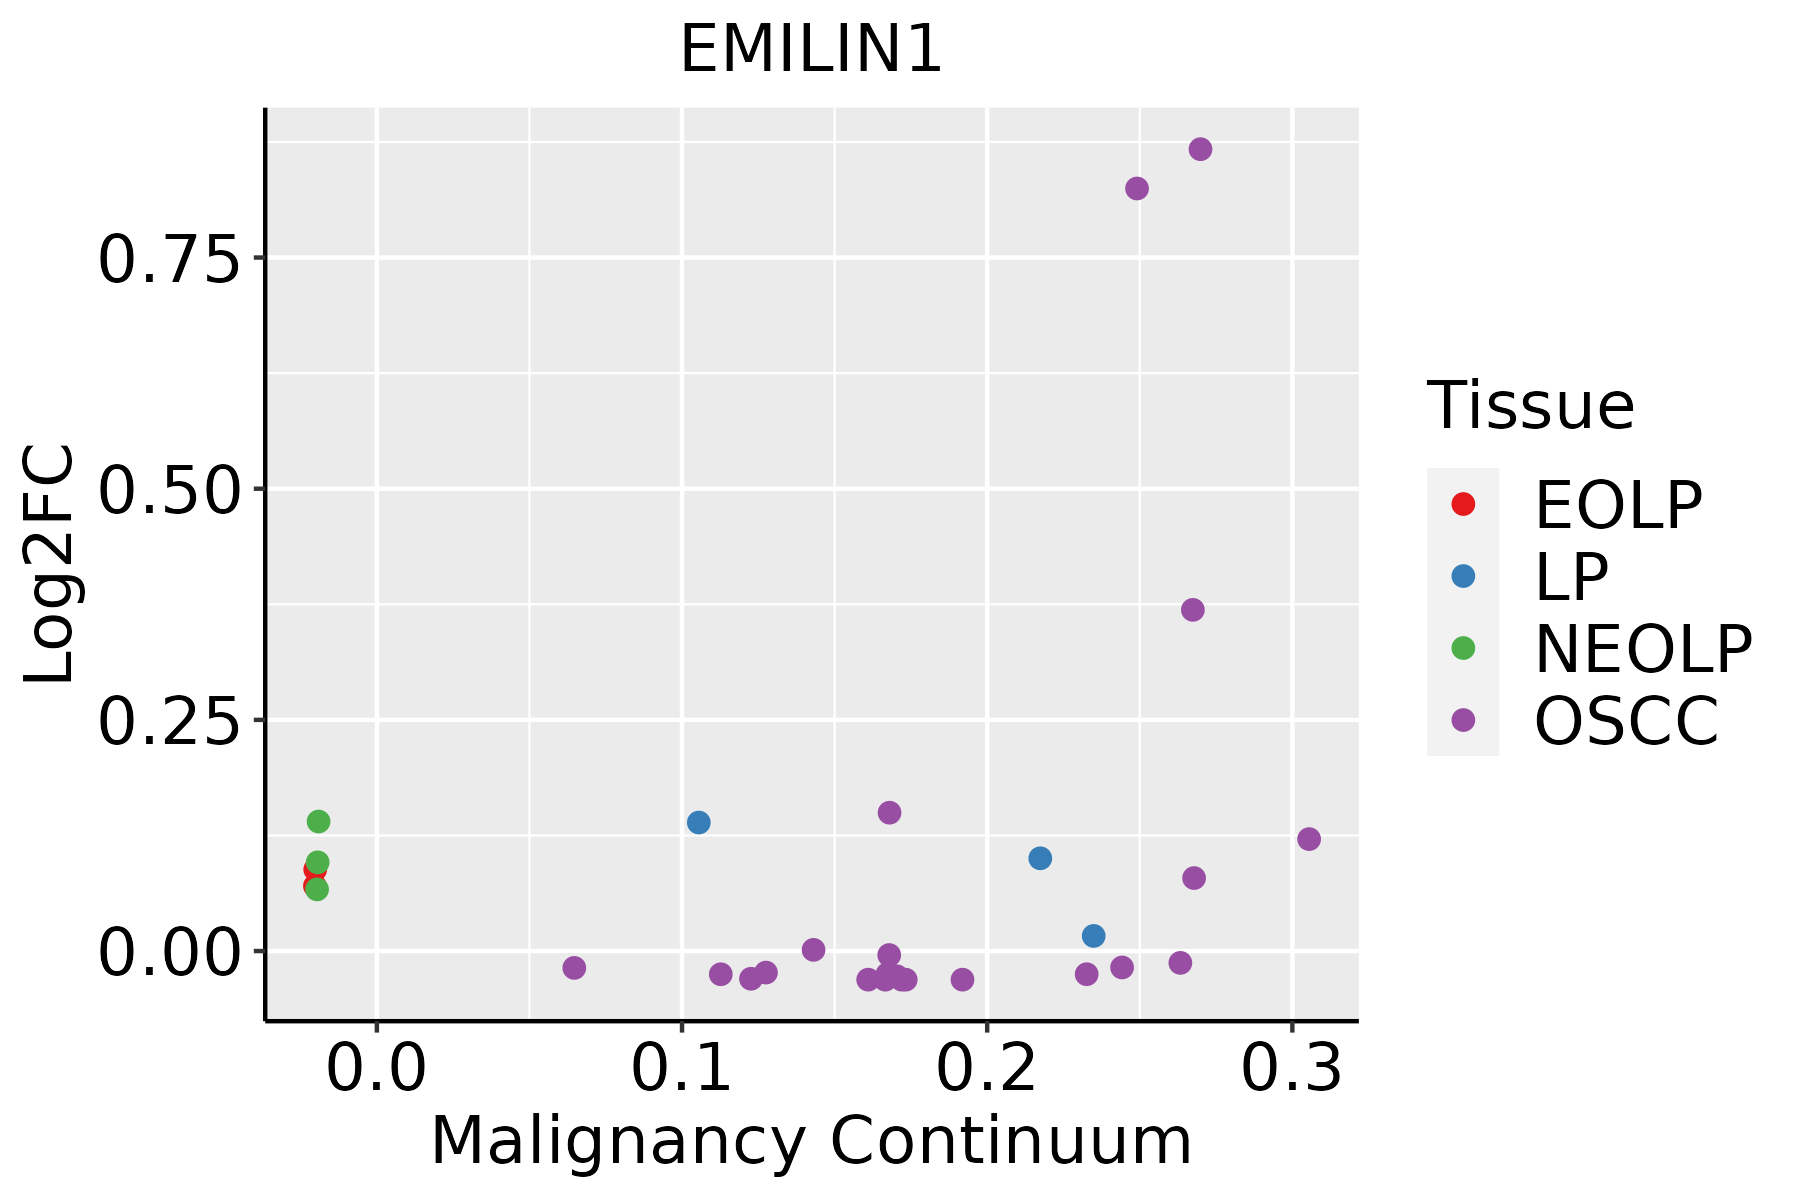
EOLP: Erosive Oral lichen planus
LP: leukoplakia
NEOLP: Non-erosive oral lichen planus
OSCC: Oral squamous cell carcinoma
ThyroidThe image shows the transcriptomic changes along malignancy continuum.log2FC in expression of this searched gene in stem-like cells from each diseased tissue sample relative to stem-like cells in normal samples in each tissue plotted against the malignancy continuum. Samples are colored based on if they are from different disease stage.
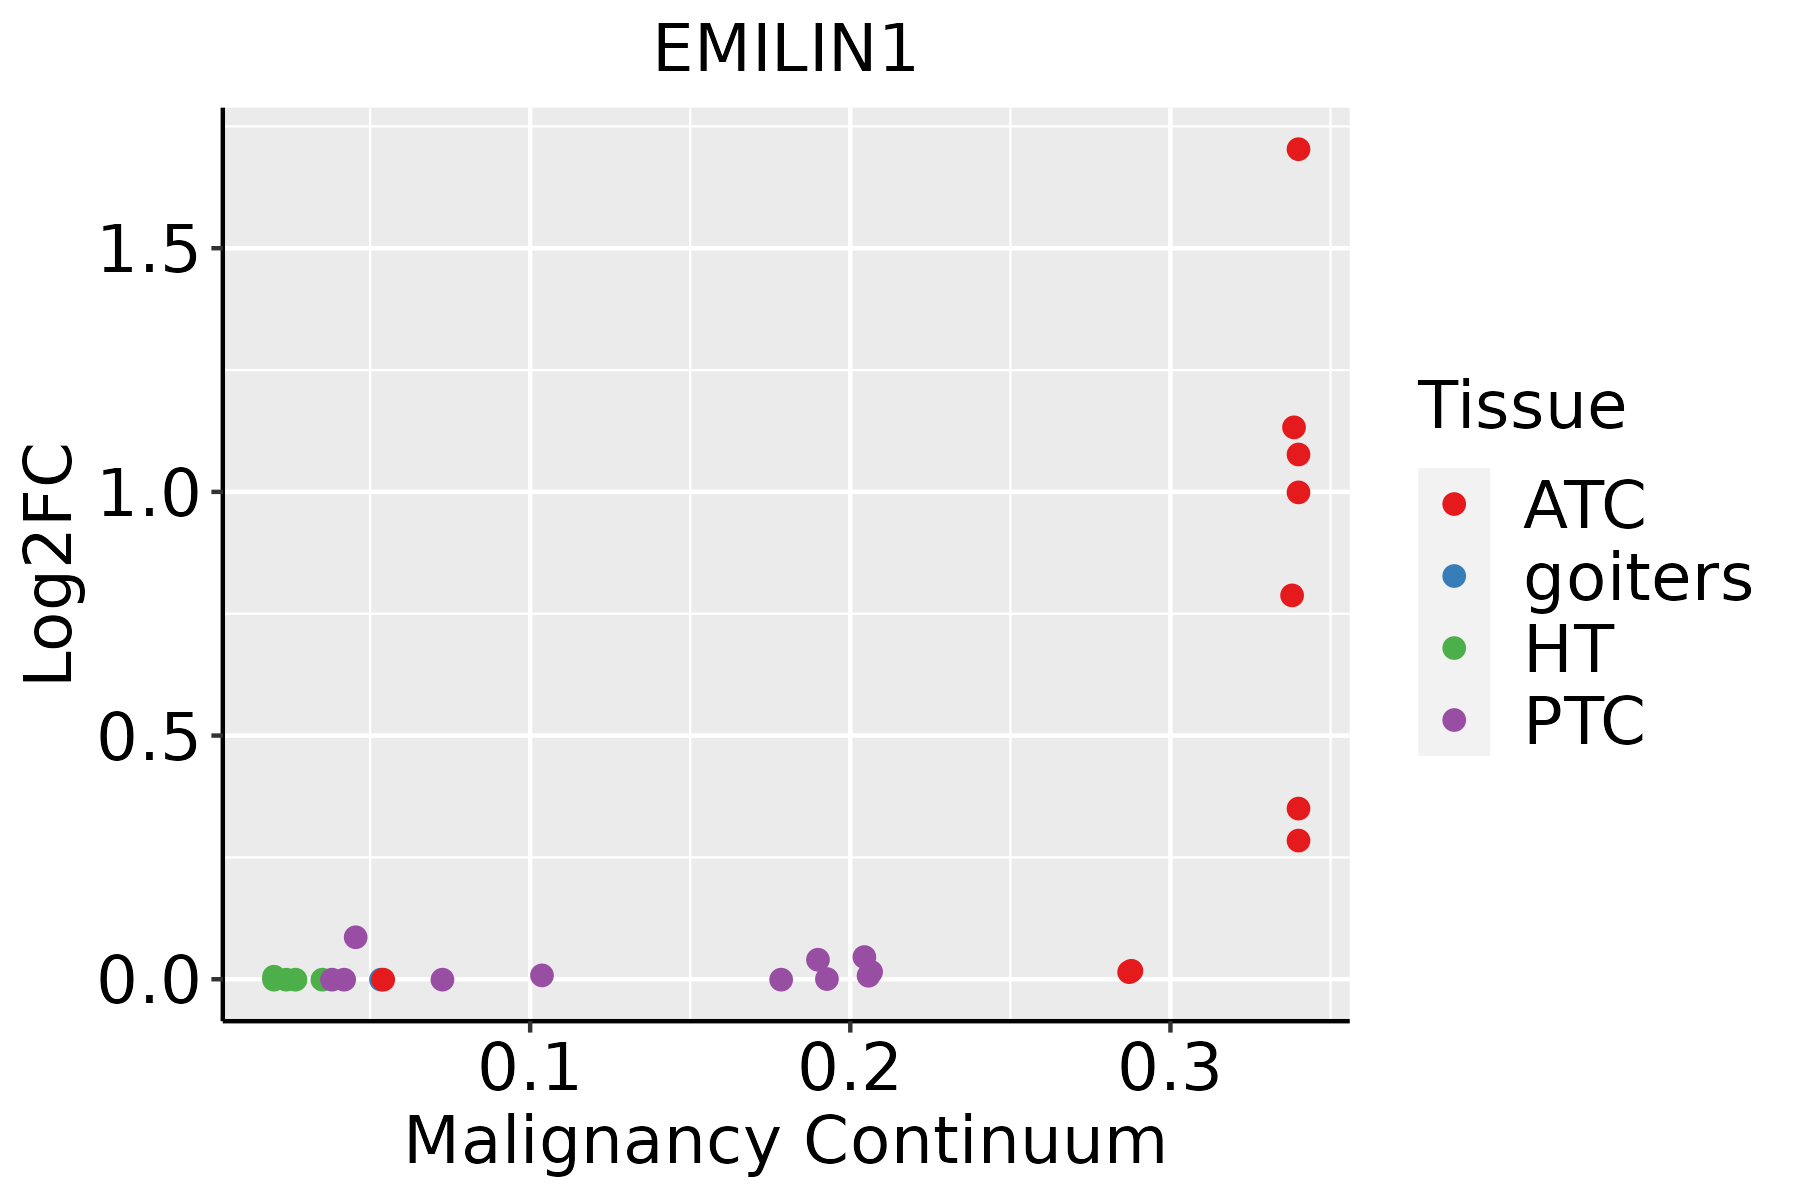
ATC: Anaplastic thyroid cancer
HT: Hashimoto's thyroiditis
PTC: Papillary thyroid cancer
∗log2FC in expression of this searched gene in stem-like cells from each diseased tissue sample relative to stem-like cells in normal samples in each tissue plotted against the malignancy continuum. Samples are colored based on if they are from different disease stage.

Top

Malignant transformation related pathway analysis

check buttonFind out the enriched GO biological processes and KEGG pathways involved in transition from healthy to precancer to cancer
check button Figure of enriched GO biological processes.
TissueDisease StageEnriched GO biological Processes
ColorectumADGO analysis - Figure of enriched GO biological processes: Top 15 enriched GO BP terms are showed in the bar plot of each disease state in each tissue. Each row represents a significant GO biological process which is colored according to the -log10(p.adjust).
ColorectumSERGO analysis - Figure of enriched GO biological processes: Top 15 enriched GO BP terms are showed in the bar plot of each disease state in each tissue. Each row represents a significant GO biological process which is colored according to the -log10(p.adjust).
ColorectumMSSGO analysis - Figure of enriched GO biological processes: Top 15 enriched GO BP terms are showed in the bar plot of each disease state in each tissue. Each row represents a significant GO biological process which is colored according to the -log10(p.adjust).
ColorectumMSI-HGO analysis - Figure of enriched GO biological processes: Top 15 enriched GO BP terms are showed in the bar plot of each disease state in each tissue. Each row represents a significant GO biological process which is colored according to the -log10(p.adjust).
ColorectumFAPGO analysis - Figure of enriched GO biological processes: Top 15 enriched GO BP terms are showed in the bar plot of each disease state in each tissue. Each row represents a significant GO biological process which is colored according to the -log10(p.adjust).
∗Top 15 enriched GO BP terms are showed in the bar plot of each disease state in each tissue. Each row represents a significant GO biological process which is colored according to the -log10(p.adjust).
Page: 1 2 3 4 5 6 7 8 9 

check button Enriched GO biological processes.
GO IDTissueDisease StageDescriptionGene RatioBg Ratiopvaluep.adjustCount
GO:19030532EsophagusESCCregulation of extracellular matrix organization30/855248/187231.40e-024.57e-0230
GO:00031703EsophagusESCCheart valve development39/855265/187231.41e-024.59e-0239
GO:001056320Oral cavityOSCCnegative regulation of phosphorus metabolic process246/7305442/187236.12e-132.89e-11246
GO:004593620Oral cavityOSCCnegative regulation of phosphate metabolic process245/7305441/187238.85e-134.09e-11245
GO:004232619Oral cavityOSCCnegative regulation of phosphorylation214/7305385/187232.30e-117.74e-10214
GO:190290320Oral cavityOSCCregulation of supramolecular fiber organization211/7305383/187239.45e-112.88e-09211
GO:000193319Oral cavityOSCCnegative regulation of protein phosphorylation191/7305342/187231.58e-104.62e-09191
GO:003158917Oral cavityOSCCcell-substrate adhesion193/7305363/187232.48e-084.82e-07193
GO:001081019Oral cavityOSCCregulation of cell-substrate adhesion126/7305221/187234.02e-087.55e-07126
GO:004578520Oral cavityOSCCpositive regulation of cell adhesion225/7305437/187236.06e-081.09e-06225
GO:004340917Oral cavityOSCCnegative regulation of MAPK cascade105/7305180/187231.10e-071.87e-06105
GO:00715598Oral cavityOSCCresponse to transforming growth factor beta140/7305256/187232.34e-073.70e-06140
GO:00715608Oral cavityOSCCcellular response to transforming growth factor beta stimulus137/7305250/187232.68e-074.15e-06137
GO:00071798Oral cavityOSCCtransforming growth factor beta receptor signaling pathway109/7305198/187233.21e-063.86e-05109
GO:000716016Oral cavityOSCCcell-matrix adhesion125/7305233/187233.76e-064.45e-05125
GO:001081120Oral cavityOSCCpositive regulation of cell-substrate adhesion71/7305123/187231.96e-051.87e-0471
GO:00170155Oral cavityOSCCregulation of transforming growth factor beta receptor signaling pathway71/7305128/187231.14e-048.34e-0471
GO:19038446Oral cavityOSCCregulation of cellular response to transforming growth factor beta stimulus72/7305131/187231.51e-041.06e-0372
GO:000268510Oral cavityOSCCregulation of leukocyte migration108/7305210/187231.63e-041.13e-03108
GO:000268310Oral cavityOSCCnegative regulation of immune system process204/7305434/187233.72e-042.27e-03204
Page: 1 2 3 4 5 6 7 8 9 10 11 12 13 

check button Enriched KEGG pathways.
Pathway IDTissueDisease StageDescriptionGene RatioBg Ratiopvaluep.adjustqvalueCount
Page: 1 

Top

Cell-cell communication analysis

check buttonIdentification of potential cell-cell interactions between two cell types and their ligand-receptor pairs for different disease states
LigandReceptorLRpairPathwayTissueDisease Stage
Page: 1 

Top

Single-cell gene regulatory network inference analysis

check buttonFind out the significant the regulons (TFs) and the target genes of each regulon across cell types for different disease states
TFCell TypeTissueDisease StageTarget GeneRSSRegulon Activity
∗The dot plots of a searched regulon are shown for all cell subpopulations in each disease state of each tissue based on the regulon specific score inferred using pySCENIC and by calculating the average expression.
Page: 1 

Top

Somatic mutation of malignant transformation related genes

check buttonAnnotation of somatic variants for genes involved in malignant transformation
Hugo SymbolVariant ClassVariant ClassificationdbSNP RSHGVScHGVSpHGVSp ShortSWISSPROTBIOTYPESIFTPolyPhenTumor Sample BarcodeTissueHistologySexAgeStageTherapy TypesDrugsOutcome
EMILIN1SNVMissense_Mutationnovelc.382N>Cp.Asp128Hisp.D128Hprotein_codingdeleterious(0)probably_damaging(0.979)TCGA-BH-A0B6-01Breastbreast invasive carcinomaFemale<65I/IIUnknownUnknownSD
EMILIN1SNVMissense_Mutationrs554471085c.296G>Ap.Arg99Hisp.R99Hprotein_codingdeleterious(0)probably_damaging(0.998)TCGA-BH-A18G-01Breastbreast invasive carcinomaFemale>=65I/IIUnknownUnknownSD
EMILIN1SNVMissense_Mutationc.2029N>Ap.Asp677Asnp.D677Nprotein_codingdeleterious(0)probably_damaging(0.966)TCGA-D8-A1JA-01Breastbreast invasive carcinomaFemale<65III/IVChemotherapyadriamycinPD
EMILIN1insertionNonsense_Mutationnovelc.2228_2229insCAACCAAGGACCGTATCATTTCTGAGATTAp.Gly743_Leu744insAsnGlnGlyProTyrHisPheTerAspTerp.G743_L744insNQGPYHF*D*protein_codingTCGA-A8-A08H-01Breastbreast invasive carcinomaFemale>=65I/IIUnknownUnknownSD
EMILIN1insertionNonsense_Mutationnovelc.2694_2695insGAGCACAACAGGAGAGCCTCAGCAGATGTTTGCTGAGp.Tyr899GlufsTer12p.Y899Efs*12protein_codingTCGA-BH-A0B3-01Breastbreast invasive carcinomaFemale<65I/IIChemotherapycyclophosphamideSD
EMILIN1insertionIn_Frame_Insnovelc.1526_1527insTTTCATp.Gly509_Gln510insPheMetp.G509_Q510insFMprotein_codingTCGA-DS-A1OB-01Cervixcervical & endocervical cancerFemale<65I/IIChemotherapycarboplatinPD
EMILIN1insertionFrame_Shift_Insnovelc.1529_1530insCCCCAp.Gln510HisfsTer53p.Q510Hfs*53protein_codingTCGA-DS-A1OB-01Cervixcervical & endocervical cancerFemale<65I/IIChemotherapycarboplatinPD
EMILIN1SNVMissense_Mutationc.528G>Tp.Glu176Aspp.E176Dprotein_codingtolerated(0.15)benign(0.135)TCGA-A6-6141-01Colorectumcolon adenocarcinomaMale<65I/IIChemotherapy5-fuSD
EMILIN1SNVMissense_Mutationnovelc.736N>Tp.Leu246Phep.L246Fprotein_codingtolerated(0.08)possibly_damaging(0.596)TCGA-AA-3556-01Colorectumcolon adenocarcinomaMale>=65I/IIUnknownUnknownSD
EMILIN1SNVMissense_Mutationrs781472388c.343N>Ap.Asp115Asnp.D115Nprotein_codingtolerated(0.2)possibly_damaging(0.521)TCGA-AA-A010-01Colorectumcolon adenocarcinomaFemale<65I/IIChemotherapyfolinicCR
Page: 1 2 3 4 5 6 7 8 9 10 

Top

Related drugs of malignant transformation related genes

check buttonIdentification of chemicals and drugs interact with genes involved in malignant transfromation
(DGIdb 4.0)
Entrez IDSymbolCategoryInteraction TypesDrug Claim NameDrug NamePMIDs
Page: 1