
|
|||||
|
 | |
| |
| |
| |
| |
| |
|
Gene: EDAR |
Gene summary for EDAR |
| Gene information | Species | Human | Gene symbol | EDAR | Gene ID | 10913 |
| Gene name | ectodysplasin A receptor | |
| Gene Alias | DL | |
| Cytomap | 2q13 | |
| Gene Type | protein-coding | GO ID | GO:0000165 | UniProtAcc | Q9UNE0 |
Top |
Malignant transformation analysis |
| Identification of the aberrant gene expression in precancerous and cancerous lesions by comparing the gene expression of stem-like cells in diseased tissues with normal stem cells |
| Entrez ID | Symbol | Replicates | Species | Organ | Tissue | Adj P-value | Log2FC | Malignancy |
| 10913 | EDAR | HTA11_6818_2000001021 | Human | Colorectum | AD | 4.37e-02 | 3.18e-01 | 0.0588 |
| 10913 | EDAR | HTA11_99999970781_79442 | Human | Colorectum | MSS | 3.19e-07 | 3.92e-01 | 0.294 |
| 10913 | EDAR | HTA11_99999971662_82457 | Human | Colorectum | MSS | 1.10e-11 | 5.77e-01 | 0.3859 |
| 10913 | EDAR | A002-C-010 | Human | Colorectum | FAP | 6.90e-05 | 3.06e-01 | 0.242 |
| 10913 | EDAR | A001-C-207 | Human | Colorectum | FAP | 2.25e-07 | 5.29e-01 | 0.1278 |
| 10913 | EDAR | A002-C-203 | Human | Colorectum | FAP | 2.54e-03 | 2.55e-01 | 0.2786 |
| 10913 | EDAR | A001-C-119 | Human | Colorectum | FAP | 7.28e-06 | 4.95e-01 | -0.1557 |
| 10913 | EDAR | A001-C-108 | Human | Colorectum | FAP | 5.19e-19 | 6.83e-01 | -0.0272 |
| 10913 | EDAR | A002-C-021 | Human | Colorectum | FAP | 2.26e-13 | 4.75e-01 | 0.1171 |
| 10913 | EDAR | A001-C-104 | Human | Colorectum | FAP | 3.23e-28 | 8.37e-01 | 0.0184 |
| 10913 | EDAR | A015-C-006 | Human | Colorectum | FAP | 4.51e-03 | 4.19e-01 | -0.0994 |
| 10913 | EDAR | A015-C-106 | Human | Colorectum | FAP | 6.49e-10 | 5.85e-01 | -0.0511 |
| 10913 | EDAR | A001-C-014 | Human | Colorectum | FAP | 5.72e-15 | 7.03e-01 | 0.0135 |
| 10913 | EDAR | A001-C-203 | Human | Colorectum | FAP | 5.98e-08 | 4.70e-01 | -0.0481 |
| 10913 | EDAR | CRC-1-8810 | Human | Colorectum | CRC | 1.76e-09 | 5.44e-01 | 0.6257 |
| 10913 | EDAR | P1T-E | Human | Esophagus | ESCC | 1.05e-09 | 4.31e-01 | 0.0875 |
| 10913 | EDAR | P2T-E | Human | Esophagus | ESCC | 4.40e-09 | 2.19e-01 | 0.1177 |
| 10913 | EDAR | P16T-E | Human | Esophagus | ESCC | 4.48e-65 | 1.19e+00 | 0.1153 |
| 10913 | EDAR | P22T-E | Human | Esophagus | ESCC | 2.06e-08 | 1.74e-01 | 0.1236 |
| 10913 | EDAR | P40T-E | Human | Esophagus | ESCC | 1.70e-03 | 1.31e-01 | 0.109 |
| Page: 1 2 |
| Tissue | Expression Dynamics | Abbreviation |
| Colorectum (GSE201348) |  | FAP: Familial adenomatous polyposis |
| CRC: Colorectal cancer | ||
| Colorectum (HTA11) |  | AD: Adenomas |
| SER: Sessile serrated lesions | ||
| MSI-H: Microsatellite-high colorectal cancer | ||
| MSS: Microsatellite stable colorectal cancer | ||
| Esophagus | 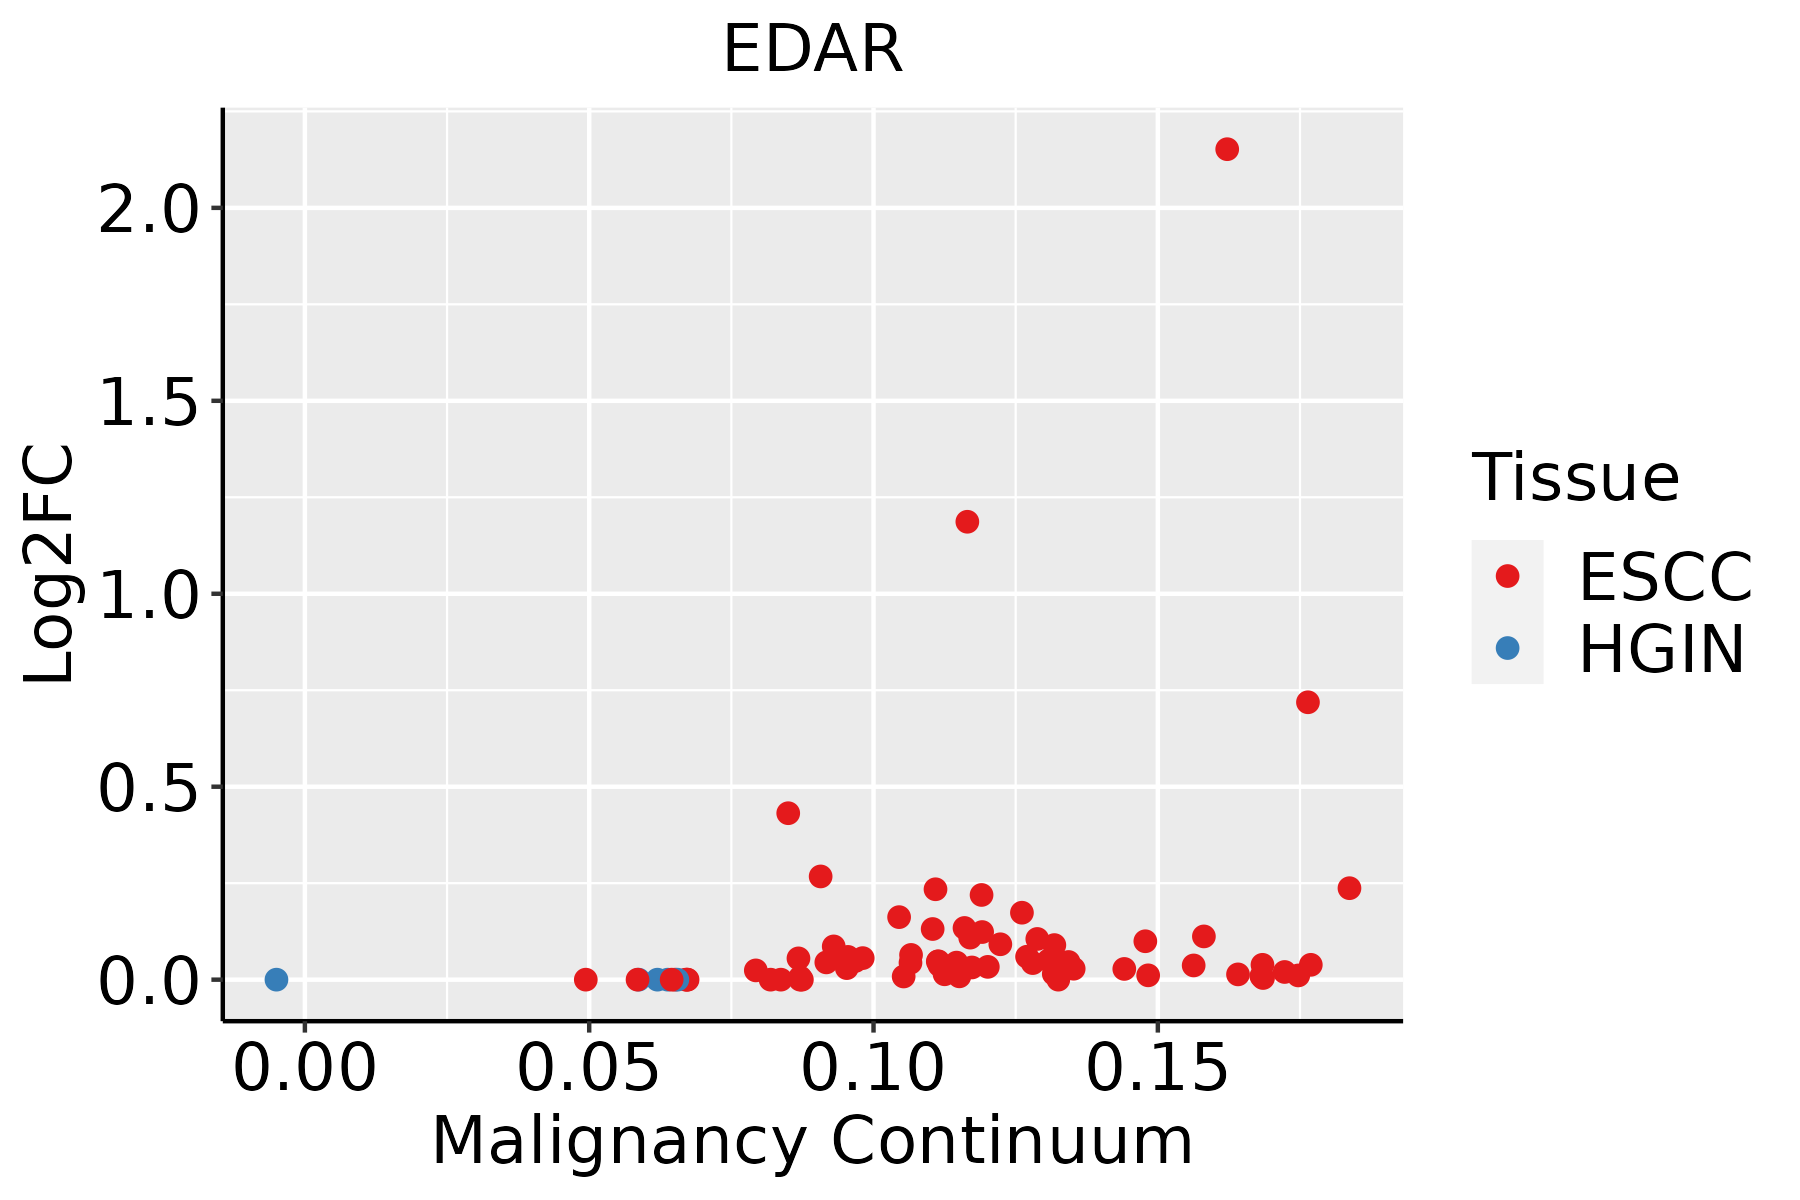 | ESCC: Esophageal squamous cell carcinoma |
| HGIN: High-grade intraepithelial neoplasias | ||
| LGIN: Low-grade intraepithelial neoplasias |
| ∗log2FC in expression of this searched gene in stem-like cells from each diseased tissue sample relative to stem-like cells in normal samples in each tissue plotted against the malignancy continuum. Samples are colored based on if they are from different disease stage. |
Top |
Malignant transformation related pathway analysis |
| Find out the enriched GO biological processes and KEGG pathways involved in transition from healthy to precancer to cancer |
| Tissue | Disease Stage | Enriched GO biological Processes |
| Colorectum | AD |  |
| Colorectum | SER |  |
| Colorectum | MSS |  |
| Colorectum | MSI-H |  |
| Colorectum | FAP |  |
| ∗Top 15 enriched GO BP terms are showed in the bar plot of each disease state in each tissue. Each row represents a significant GO biological process which is colored according to the -log10(p.adjust). |
| Page: 1 2 3 4 5 6 7 8 9 |
| GO ID | Tissue | Disease Stage | Description | Gene Ratio | Bg Ratio | pvalue | p.adjust | Count |
| GO:190122414 | Esophagus | ESCC | positive regulation of NIK/NF-kappaB signaling | 44/8552 | 69/18723 | 1.86e-03 | 8.42e-03 | 44 |
| GO:00423033 | Esophagus | ESCC | molting cycle | 64/8552 | 107/18723 | 2.24e-03 | 9.85e-03 | 64 |
| GO:00426333 | Esophagus | ESCC | hair cycle | 64/8552 | 107/18723 | 2.24e-03 | 9.85e-03 | 64 |
| GO:00434731 | Esophagus | ESCC | pigmentation | 59/8552 | 98/18723 | 2.64e-03 | 1.12e-02 | 59 |
| GO:00703046 | Esophagus | ESCC | positive regulation of stress-activated protein kinase signaling cascade | 74/8552 | 128/18723 | 3.77e-03 | 1.53e-02 | 74 |
| GO:00380615 | Esophagus | ESCC | NIK/NF-kappaB signaling | 81/8552 | 143/18723 | 5.33e-03 | 2.00e-02 | 81 |
| GO:00328745 | Esophagus | ESCC | positive regulation of stress-activated MAPK cascade | 72/8552 | 126/18723 | 6.24e-03 | 2.29e-02 | 72 |
| GO:00463302 | Esophagus | ESCC | positive regulation of JNK cascade | 52/8552 | 89/18723 | 1.04e-02 | 3.56e-02 | 52 |
| GO:00380614 | Oral cavity | OSCC | NIK/NF-kappaB signaling | 78/7305 | 143/18723 | 1.14e-04 | 8.35e-04 | 78 |
| GO:19012246 | Oral cavity | OSCC | positive regulation of NIK/NF-kappaB signaling | 40/7305 | 69/18723 | 1.08e-03 | 5.56e-03 | 40 |
| GO:19012224 | Oral cavity | OSCC | regulation of NIK/NF-kappaB signaling | 59/7305 | 112/18723 | 2.25e-03 | 1.00e-02 | 59 |
| GO:190122212 | Oral cavity | LP | regulation of NIK/NF-kappaB signaling | 44/4623 | 112/18723 | 4.38e-04 | 4.19e-03 | 44 |
| GO:190122413 | Oral cavity | LP | positive regulation of NIK/NF-kappaB signaling | 29/4623 | 69/18723 | 1.15e-03 | 9.40e-03 | 29 |
| GO:003806112 | Oral cavity | LP | NIK/NF-kappaB signaling | 52/4623 | 143/18723 | 1.20e-03 | 9.66e-03 | 52 |
| Page: 1 2 3 4 5 |
| Pathway ID | Tissue | Disease Stage | Description | Gene Ratio | Bg Ratio | pvalue | p.adjust | qvalue | Count |
| hsa040645 | Esophagus | ESCC | NF-kappa B signaling pathway | 67/4205 | 104/8465 | 1.62e-03 | 4.89e-03 | 2.50e-03 | 67 |
| hsa0406412 | Esophagus | ESCC | NF-kappa B signaling pathway | 67/4205 | 104/8465 | 1.62e-03 | 4.89e-03 | 2.50e-03 | 67 |
| Page: 1 |
Top |
Cell-cell communication analysis |
| Identification of potential cell-cell interactions between two cell types and their ligand-receptor pairs for different disease states |
| Ligand | Receptor | LRpair | Pathway | Tissue | Disease Stage |
| EDA | EDAR | EDA_EDAR | EDA | Cervix | CC |
| Page: 1 |
Top |
Single-cell gene regulatory network inference analysis |
| Find out the significant the regulons (TFs) and the target genes of each regulon across cell types for different disease states |
| TF | Cell Type | Tissue | Disease Stage | Target Gene | RSS | Regulon Activity |
| ∗The dot plots of a searched regulon are shown for all cell subpopulations in each disease state of each tissue based on the regulon specific score inferred using pySCENIC and by calculating the average expression. |
| Page: 1 |
Top |
Somatic mutation of malignant transformation related genes |
| Annotation of somatic variants for genes involved in malignant transformation |
| Hugo Symbol | Variant Class | Variant Classification | dbSNP RS | HGVSc | HGVSp | HGVSp Short | SWISSPROT | BIOTYPE | SIFT | PolyPhen | Tumor Sample Barcode | Tissue | Histology | Sex | Age | Stage | Therapy Types | Drugs | Outcome |
| EDAR | SNV | Missense_Mutation | rs144473052 | c.293G>C | p.Arg98Pro | p.R98P | Q9UNE0 | protein_coding | deleterious(0) | possibly_damaging(0.795) | TCGA-3C-AALI-01 | Breast | breast invasive carcinoma | Female | <65 | I/II | Unspecific | Poly E | Complete Response |
| EDAR | SNV | Missense_Mutation | novel | c.88N>C | p.Asn30His | p.N30H | Q9UNE0 | protein_coding | deleterious(0.03) | benign(0.347) | TCGA-AN-A046-01 | Breast | breast invasive carcinoma | Female | >=65 | I/II | Unknown | Unknown | SD |
| EDAR | SNV | Missense_Mutation | novel | c.352C>T | p.Pro118Ser | p.P118S | Q9UNE0 | protein_coding | deleterious(0.01) | benign(0.388) | TCGA-AO-A03P-01 | Breast | breast invasive carcinoma | Female | <65 | I/II | Hormone Therapy | letrozole | PD |
| EDAR | SNV | Missense_Mutation | c.1097N>T | p.Ser366Phe | p.S366F | Q9UNE0 | protein_coding | deleterious(0) | possibly_damaging(0.745) | TCGA-BH-A0HF-01 | Breast | breast invasive carcinoma | Female | >=65 | I/II | Hormone Therapy | arimidex | SD | |
| EDAR | SNV | Missense_Mutation | c.1046N>T | p.Pro349Leu | p.P349L | Q9UNE0 | protein_coding | deleterious(0.01) | probably_damaging(0.997) | TCGA-BH-A18Q-01 | Breast | breast invasive carcinoma | Female | <65 | I/II | Unknown | Unknown | SD | |
| EDAR | SNV | Missense_Mutation | novel | c.152N>A | p.Gly51Glu | p.G51E | Q9UNE0 | protein_coding | tolerated(1) | benign(0) | TCGA-D8-A142-01 | Breast | breast invasive carcinoma | Female | >=65 | I/II | Chemotherapy | cyclophosphamid | SD |
| EDAR | deletion | In_Frame_Del | c.100_105delNNNNNN | p.Asn34_Glu35del | p.N34_E35del | Q9UNE0 | protein_coding | TCGA-D8-A147-01 | Breast | breast invasive carcinoma | Female | <65 | I/II | Chemotherapy | doxorubicine | SD | |||
| EDAR | SNV | Missense_Mutation | c.473N>C | p.Asn158Thr | p.N158T | Q9UNE0 | protein_coding | tolerated(0.43) | benign(0.007) | TCGA-FU-A3HZ-01 | Cervix | cervical & endocervical cancer | Female | <65 | I/II | Chemotherapy | cisplatin | CR | |
| EDAR | SNV | Missense_Mutation | c.1128C>A | p.His376Gln | p.H376Q | Q9UNE0 | protein_coding | deleterious(0) | probably_damaging(0.998) | TCGA-A6-6141-01 | Colorectum | colon adenocarcinoma | Male | <65 | I/II | Chemotherapy | 5-fu | SD | |
| EDAR | SNV | Missense_Mutation | rs764390189 | c.1123C>T | p.Arg375Cys | p.R375C | Q9UNE0 | protein_coding | deleterious(0) | probably_damaging(0.999) | TCGA-AA-3949-01 | Colorectum | colon adenocarcinoma | Female | >=65 | III/IV | Unknown | Unknown | SD |
| Page: 1 2 3 4 5 6 7 |
Top |
Related drugs of malignant transformation related genes |
| Identification of chemicals and drugs interact with genes involved in malignant transfromation |
| (DGIdb 4.0) |
| Entrez ID | Symbol | Category | Interaction Types | Drug Claim Name | Drug Name | PMIDs |
| 10913 | EDAR | DRUGGABLE GENOME | 178102765 |
| Page: 1 |

Copyright 2023-Present -The University of Texas Health Science Center at Houston |