
|
|||||
|
 | |
| |
| |
| |
| |
| |
|
Gene: ECHDC1 |
Gene summary for ECHDC1 |
| Gene information | Species | Human | Gene symbol | ECHDC1 | Gene ID | 55862 |
| Gene name | ethylmalonyl-CoA decarboxylase 1 | |
| Gene Alias | HEL-S-76 | |
| Cytomap | 6q22.33 | |
| Gene Type | protein-coding | GO ID | GO:0006082 | UniProtAcc | Q9NTX5 |
Top |
Malignant transformation analysis |
| Identification of the aberrant gene expression in precancerous and cancerous lesions by comparing the gene expression of stem-like cells in diseased tissues with normal stem cells |
| Entrez ID | Symbol | Replicates | Species | Organ | Tissue | Adj P-value | Log2FC | Malignancy |
| 55862 | ECHDC1 | HTA11_3410_2000001011 | Human | Colorectum | AD | 3.65e-13 | -5.45e-01 | 0.0155 |
| 55862 | ECHDC1 | HTA11_2487_2000001011 | Human | Colorectum | SER | 9.77e-04 | -4.51e-01 | -0.1808 |
| 55862 | ECHDC1 | HTA11_3361_2000001011 | Human | Colorectum | AD | 8.69e-05 | -5.35e-01 | -0.1207 |
| 55862 | ECHDC1 | HTA11_696_2000001011 | Human | Colorectum | AD | 4.12e-06 | -3.74e-01 | -0.1464 |
| 55862 | ECHDC1 | HTA11_866_2000001011 | Human | Colorectum | AD | 3.96e-07 | -3.76e-01 | -0.1001 |
| 55862 | ECHDC1 | HTA11_866_3004761011 | Human | Colorectum | AD | 4.86e-11 | -5.27e-01 | 0.096 |
| 55862 | ECHDC1 | HTA11_10623_2000001011 | Human | Colorectum | AD | 4.89e-02 | -5.51e-01 | -0.0177 |
| 55862 | ECHDC1 | HTA11_10711_2000001011 | Human | Colorectum | AD | 2.49e-05 | -5.23e-01 | 0.0338 |
| 55862 | ECHDC1 | HTA11_7696_3000711011 | Human | Colorectum | AD | 3.58e-17 | -5.06e-01 | 0.0674 |
| 55862 | ECHDC1 | HTA11_99999970781_79442 | Human | Colorectum | MSS | 4.16e-06 | -3.73e-01 | 0.294 |
| 55862 | ECHDC1 | HTA11_99999971662_82457 | Human | Colorectum | MSS | 3.40e-13 | -4.49e-01 | 0.3859 |
| 55862 | ECHDC1 | HTA11_99999973899_84307 | Human | Colorectum | MSS | 1.12e-02 | -5.02e-01 | 0.2585 |
| 55862 | ECHDC1 | HTA11_99999974143_84620 | Human | Colorectum | MSS | 8.67e-19 | -5.53e-01 | 0.3005 |
| 55862 | ECHDC1 | A001-C-207 | Human | Colorectum | FAP | 5.10e-04 | -3.14e-01 | 0.1278 |
| 55862 | ECHDC1 | A015-C-203 | Human | Colorectum | FAP | 9.44e-33 | -5.56e-01 | -0.1294 |
| 55862 | ECHDC1 | A015-C-204 | Human | Colorectum | FAP | 1.61e-07 | -3.98e-01 | -0.0228 |
| 55862 | ECHDC1 | A014-C-040 | Human | Colorectum | FAP | 1.06e-02 | -1.77e-01 | -0.1184 |
| 55862 | ECHDC1 | A002-C-201 | Human | Colorectum | FAP | 2.12e-16 | -4.97e-01 | 0.0324 |
| 55862 | ECHDC1 | A002-C-203 | Human | Colorectum | FAP | 2.92e-09 | -2.88e-01 | 0.2786 |
| 55862 | ECHDC1 | A001-C-119 | Human | Colorectum | FAP | 1.11e-10 | -5.07e-01 | -0.1557 |
| Page: 1 2 3 4 5 6 7 8 |
| Tissue | Expression Dynamics | Abbreviation |
| Colorectum (GSE201348) | 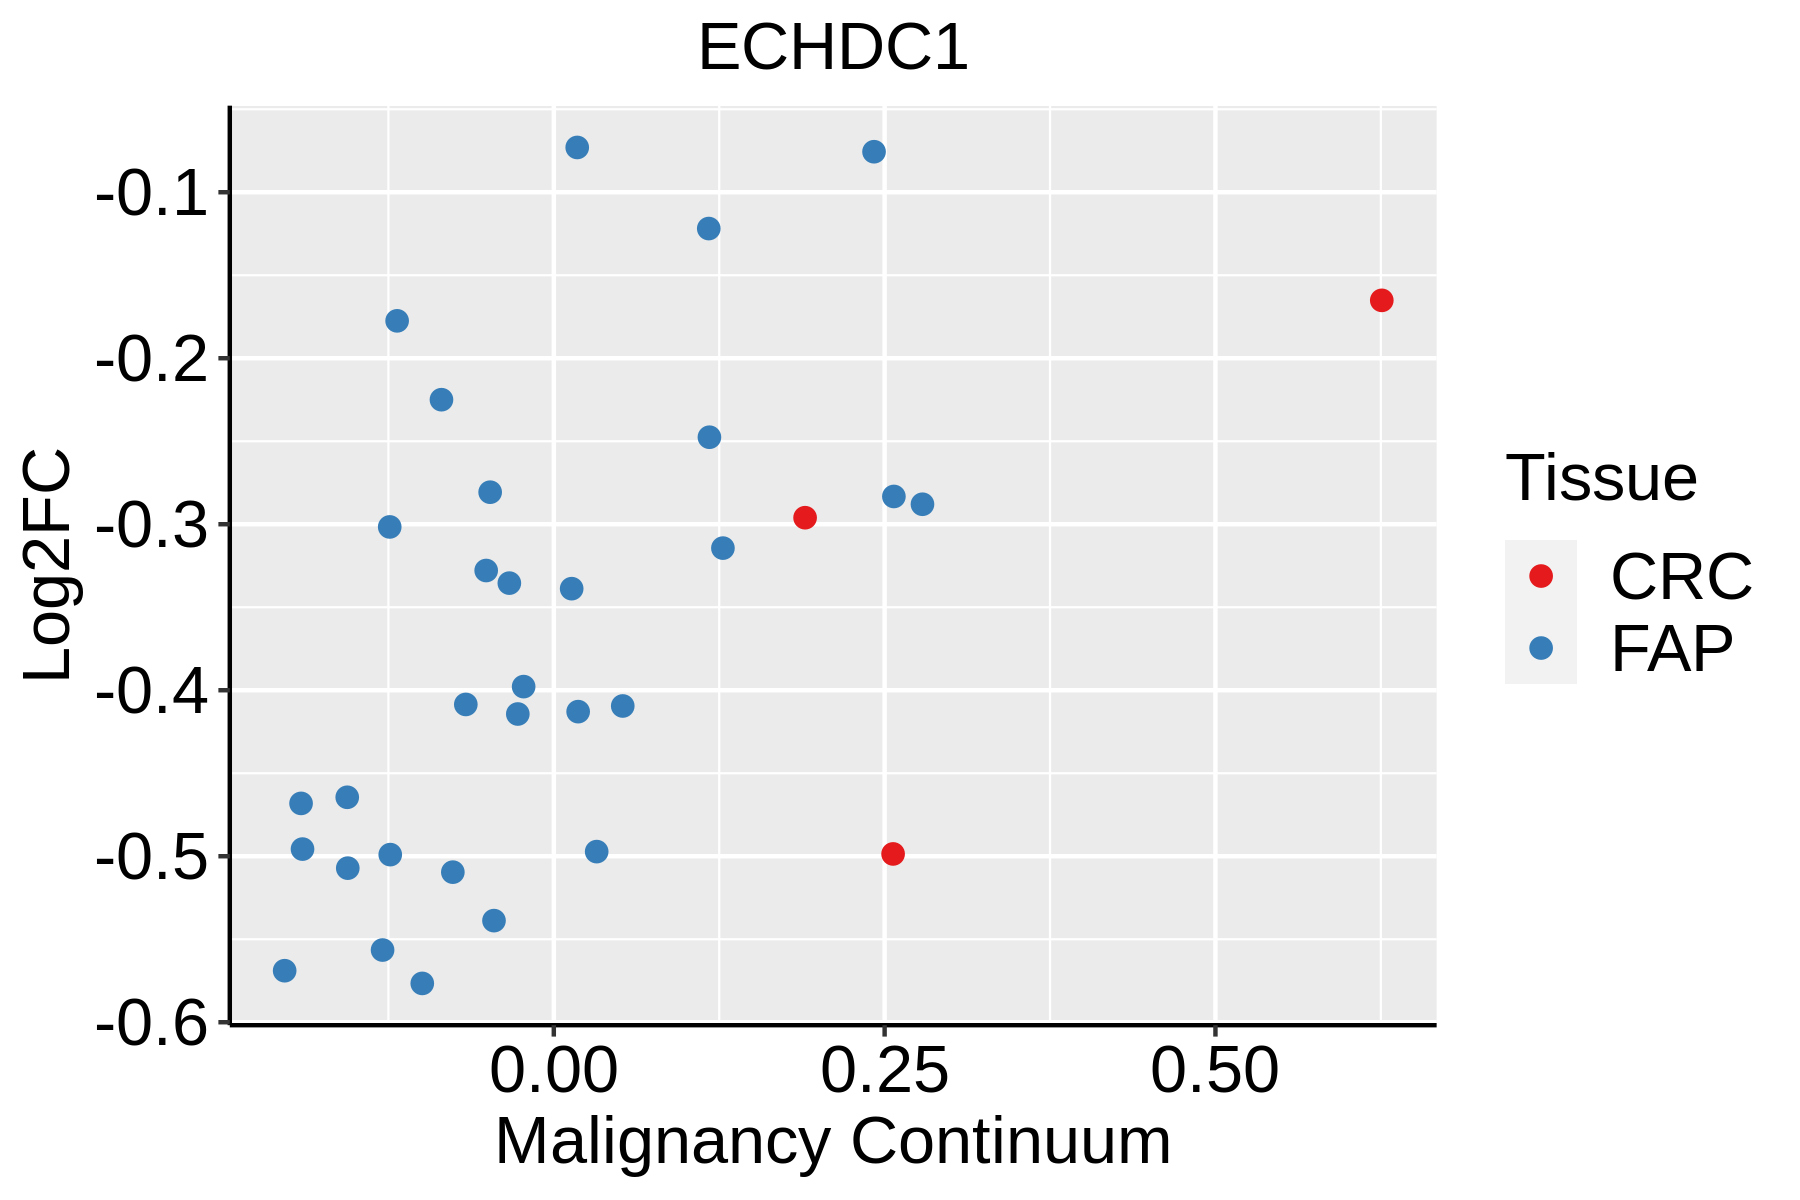 | FAP: Familial adenomatous polyposis |
| CRC: Colorectal cancer | ||
| Colorectum (HTA11) | 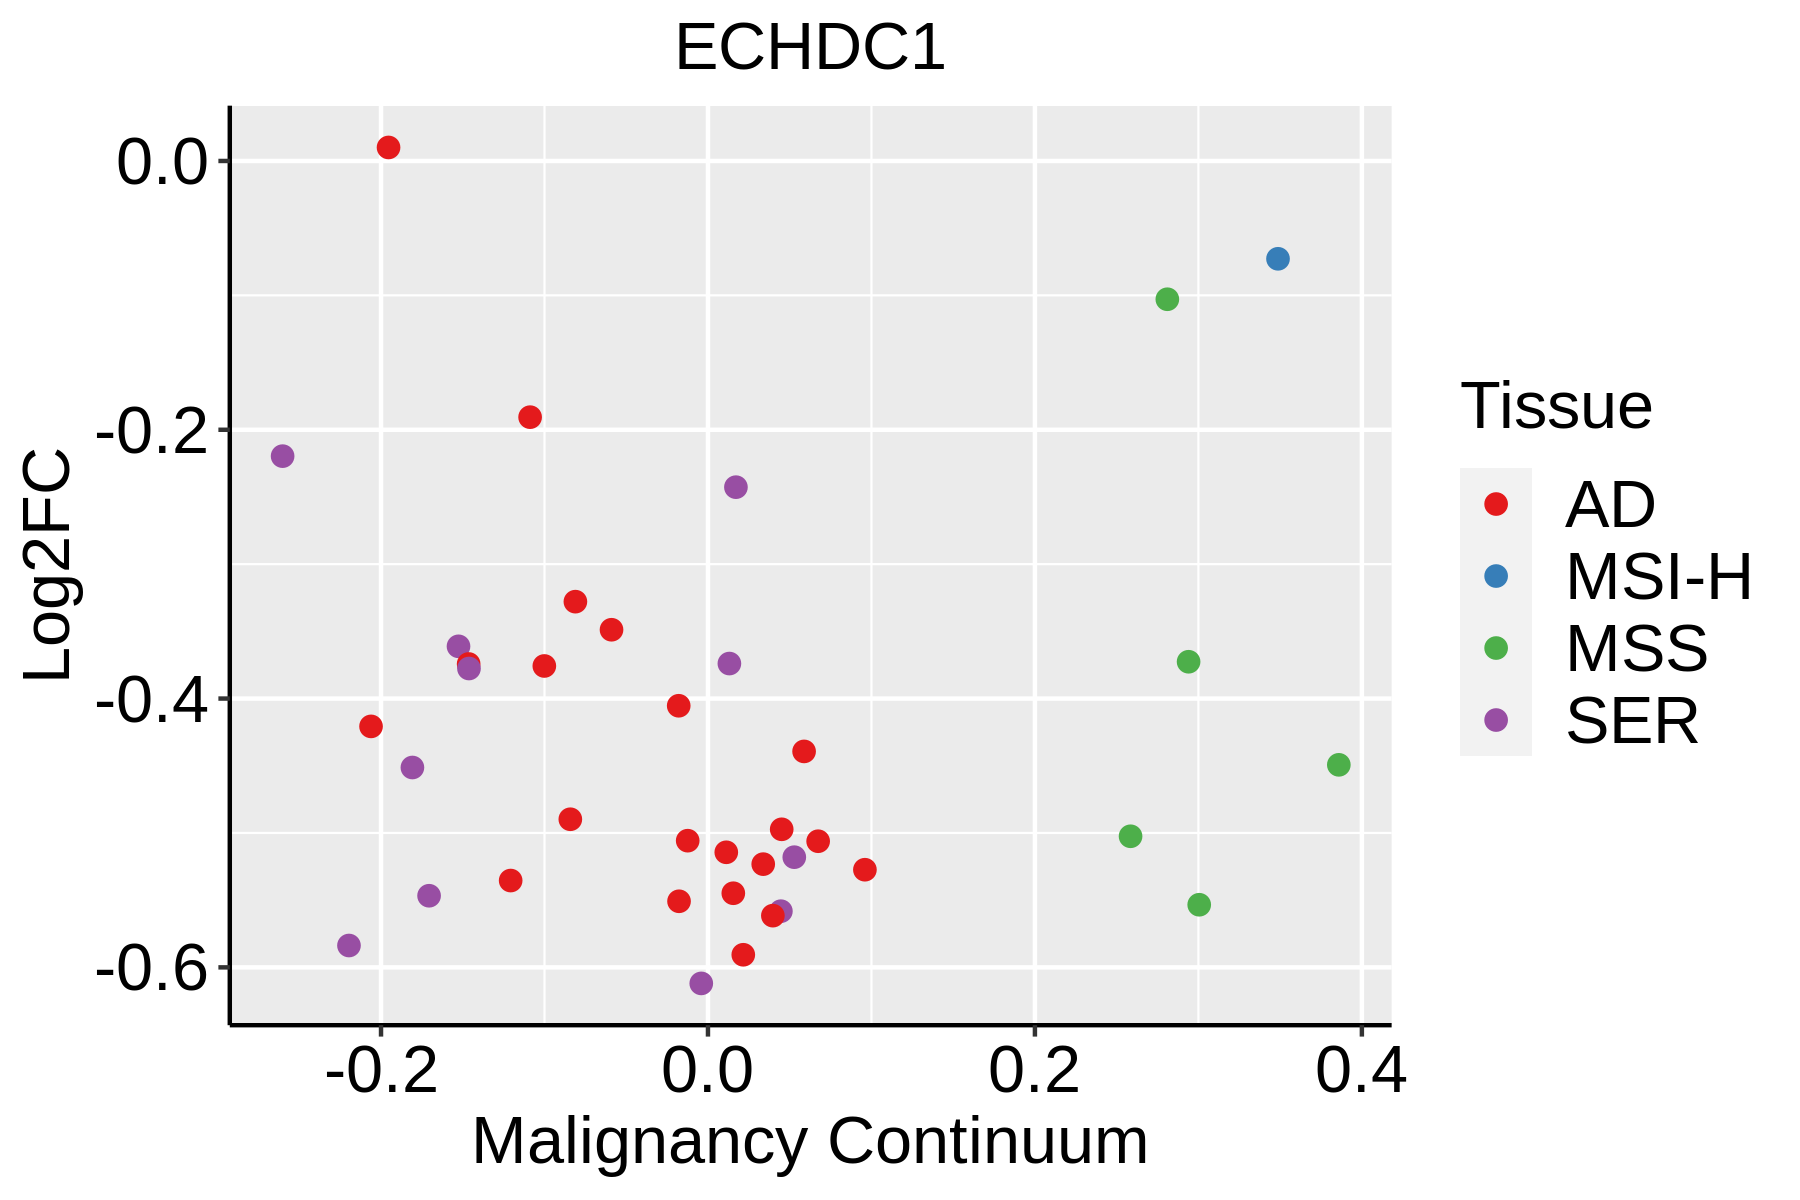 | AD: Adenomas |
| SER: Sessile serrated lesions | ||
| MSI-H: Microsatellite-high colorectal cancer | ||
| MSS: Microsatellite stable colorectal cancer | ||
| Esophagus |  | ESCC: Esophageal squamous cell carcinoma |
| HGIN: High-grade intraepithelial neoplasias | ||
| LGIN: Low-grade intraepithelial neoplasias | ||
| Liver |  | HCC: Hepatocellular carcinoma |
| NAFLD: Non-alcoholic fatty liver disease | ||
| Oral Cavity |  | EOLP: Erosive Oral lichen planus |
| LP: leukoplakia | ||
| NEOLP: Non-erosive oral lichen planus | ||
| OSCC: Oral squamous cell carcinoma | ||
| Skin | 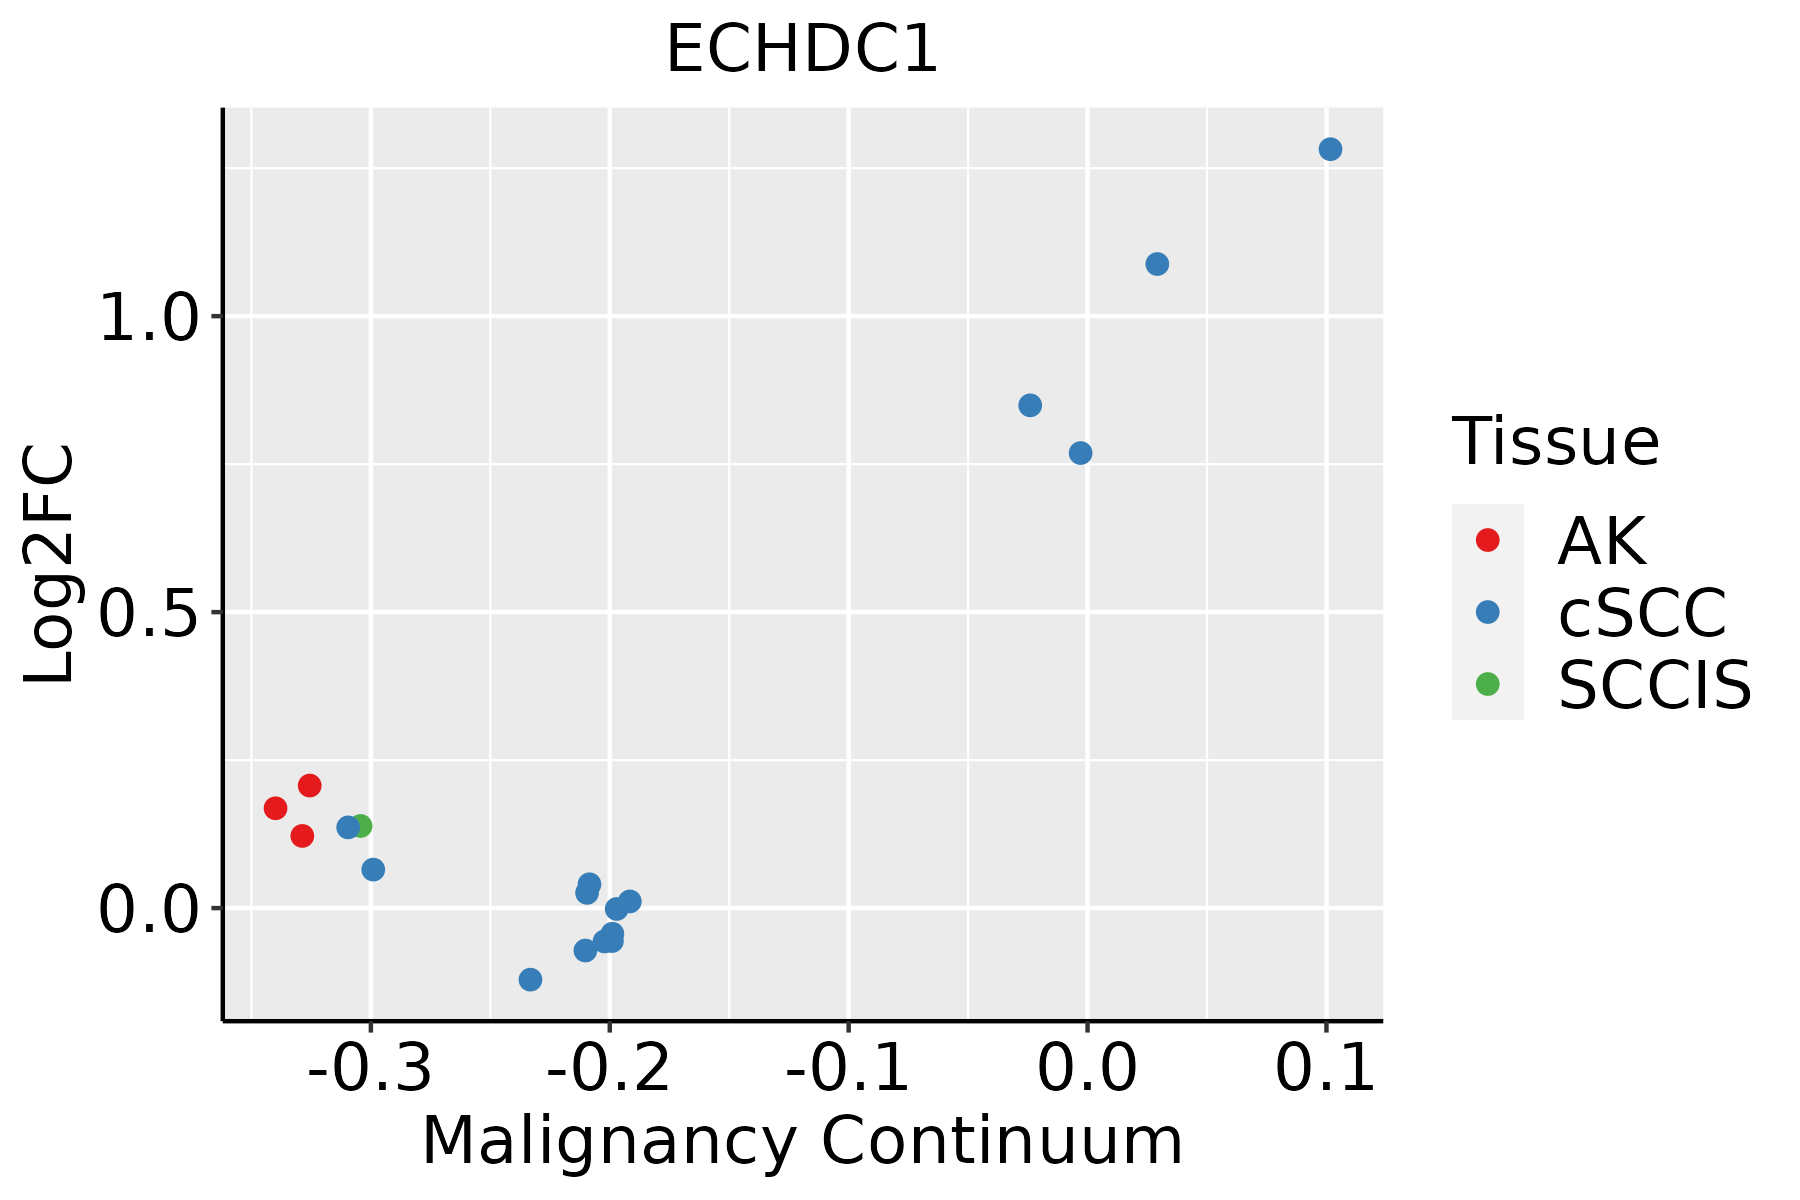 | AK: Actinic keratosis |
| cSCC: Cutaneous squamous cell carcinoma | ||
| SCCIS:squamous cell carcinoma in situ | ||
| Thyroid | 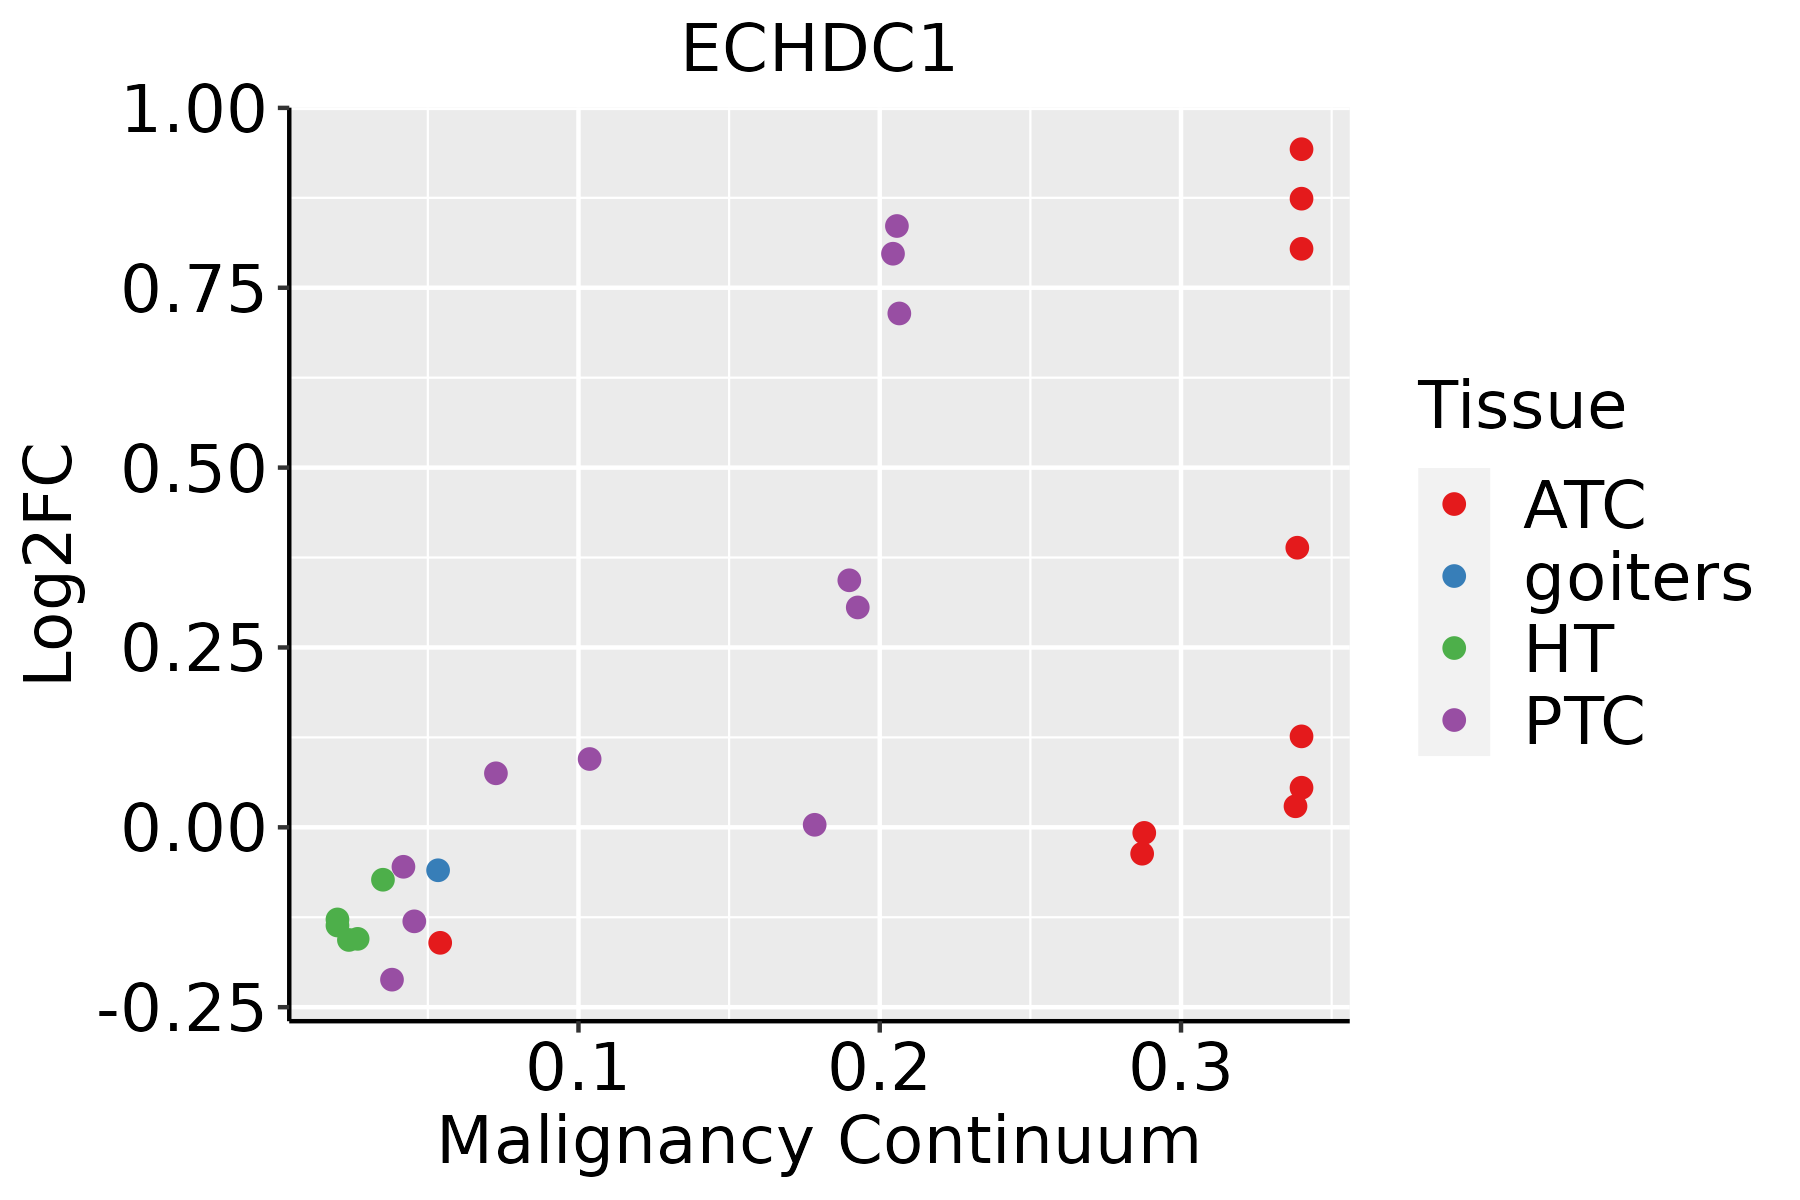 | ATC: Anaplastic thyroid cancer |
| HT: Hashimoto's thyroiditis | ||
| PTC: Papillary thyroid cancer |
| ∗log2FC in expression of this searched gene in stem-like cells from each diseased tissue sample relative to stem-like cells in normal samples in each tissue plotted against the malignancy continuum. Samples are colored based on if they are from different disease stage. |
Top |
Malignant transformation related pathway analysis |
| Find out the enriched GO biological processes and KEGG pathways involved in transition from healthy to precancer to cancer |
| Tissue | Disease Stage | Enriched GO biological Processes |
| Colorectum | AD |  |
| Colorectum | SER |  |
| Colorectum | MSS |  |
| Colorectum | MSI-H |  |
| Colorectum | FAP |  |
| ∗Top 15 enriched GO BP terms are showed in the bar plot of each disease state in each tissue. Each row represents a significant GO biological process which is colored according to the -log10(p.adjust). |
| Page: 1 2 3 4 5 6 7 8 9 |
| GO ID | Tissue | Disease Stage | Description | Gene Ratio | Bg Ratio | pvalue | p.adjust | Count |
| GO:007232911 | Liver | Cirrhotic | monocarboxylic acid catabolic process | 56/4634 | 122/18723 | 2.87e-07 | 7.01e-06 | 56 |
| GO:000906211 | Liver | Cirrhotic | fatty acid catabolic process | 48/4634 | 100/18723 | 3.87e-07 | 9.13e-06 | 48 |
| GO:000663512 | Liver | Cirrhotic | fatty acid beta-oxidation | 38/4634 | 74/18723 | 7.41e-07 | 1.57e-05 | 38 |
| GO:004424212 | Liver | Cirrhotic | cellular lipid catabolic process | 82/4634 | 214/18723 | 6.91e-06 | 1.08e-04 | 82 |
| GO:001604212 | Liver | Cirrhotic | lipid catabolic process | 112/4634 | 320/18723 | 2.31e-05 | 3.03e-04 | 112 |
| GO:003025811 | Liver | Cirrhotic | lipid modification | 75/4634 | 212/18723 | 3.33e-04 | 2.87e-03 | 75 |
| GO:000663122 | Liver | HCC | fatty acid metabolic process | 238/7958 | 390/18723 | 8.24e-14 | 4.84e-12 | 238 |
| GO:004428221 | Liver | HCC | small molecule catabolic process | 225/7958 | 376/18723 | 6.50e-12 | 2.80e-10 | 225 |
| GO:001605421 | Liver | HCC | organic acid catabolic process | 152/7958 | 240/18723 | 5.11e-11 | 1.92e-09 | 152 |
| GO:00463952 | Liver | HCC | carboxylic acid catabolic process | 149/7958 | 236/18723 | 1.11e-10 | 3.87e-09 | 149 |
| GO:004424222 | Liver | HCC | cellular lipid catabolic process | 134/7958 | 214/18723 | 2.07e-09 | 5.79e-08 | 134 |
| GO:001939522 | Liver | HCC | fatty acid oxidation | 72/7958 | 103/18723 | 1.63e-08 | 3.92e-07 | 72 |
| GO:000906221 | Liver | HCC | fatty acid catabolic process | 70/7958 | 100/18723 | 2.34e-08 | 5.44e-07 | 70 |
| GO:003444021 | Liver | HCC | lipid oxidation | 73/7958 | 108/18723 | 1.17e-07 | 2.25e-06 | 73 |
| GO:007232921 | Liver | HCC | monocarboxylic acid catabolic process | 80/7958 | 122/18723 | 2.18e-07 | 3.91e-06 | 80 |
| GO:000663521 | Liver | HCC | fatty acid beta-oxidation | 52/7958 | 74/18723 | 1.22e-06 | 1.80e-05 | 52 |
| GO:003025821 | Liver | HCC | lipid modification | 123/7958 | 212/18723 | 3.50e-06 | 4.58e-05 | 123 |
| GO:001604221 | Liver | HCC | lipid catabolic process | 175/7958 | 320/18723 | 6.50e-06 | 7.88e-05 | 175 |
| GO:00090627 | Oral cavity | OSCC | fatty acid catabolic process | 59/7305 | 100/18723 | 3.99e-05 | 3.48e-04 | 59 |
| GO:00066317 | Oral cavity | OSCC | fatty acid metabolic process | 186/7305 | 390/18723 | 2.65e-04 | 1.69e-03 | 186 |
| Page: 1 2 3 4 5 6 |
| Pathway ID | Tissue | Disease Stage | Description | Gene Ratio | Bg Ratio | pvalue | p.adjust | qvalue | Count |
| hsa00640 | Colorectum | AD | Propanoate metabolism | 18/2092 | 32/8465 | 1.33e-04 | 1.11e-03 | 7.08e-04 | 18 |
| hsa006401 | Colorectum | AD | Propanoate metabolism | 18/2092 | 32/8465 | 1.33e-04 | 1.11e-03 | 7.08e-04 | 18 |
| hsa006402 | Colorectum | SER | Propanoate metabolism | 13/1580 | 32/8465 | 3.20e-03 | 2.12e-02 | 1.54e-02 | 13 |
| hsa006403 | Colorectum | SER | Propanoate metabolism | 13/1580 | 32/8465 | 3.20e-03 | 2.12e-02 | 1.54e-02 | 13 |
| hsa006404 | Colorectum | MSS | Propanoate metabolism | 15/1875 | 32/8465 | 1.68e-03 | 9.05e-03 | 5.55e-03 | 15 |
| hsa006405 | Colorectum | MSS | Propanoate metabolism | 15/1875 | 32/8465 | 1.68e-03 | 9.05e-03 | 5.55e-03 | 15 |
| hsa006406 | Colorectum | FAP | Propanoate metabolism | 15/1404 | 32/8465 | 6.21e-05 | 6.10e-04 | 3.71e-04 | 15 |
| hsa006407 | Colorectum | FAP | Propanoate metabolism | 15/1404 | 32/8465 | 6.21e-05 | 6.10e-04 | 3.71e-04 | 15 |
| hsa006408 | Colorectum | CRC | Propanoate metabolism | 11/1091 | 32/8465 | 1.51e-03 | 1.17e-02 | 7.94e-03 | 11 |
| hsa006409 | Colorectum | CRC | Propanoate metabolism | 11/1091 | 32/8465 | 1.51e-03 | 1.17e-02 | 7.94e-03 | 11 |
| hsa0064010 | Liver | NAFLD | Propanoate metabolism | 12/1043 | 32/8465 | 2.44e-04 | 4.45e-03 | 3.58e-03 | 12 |
| hsa0064011 | Liver | NAFLD | Propanoate metabolism | 12/1043 | 32/8465 | 2.44e-04 | 4.45e-03 | 3.58e-03 | 12 |
| hsa0064041 | Liver | HCC | Propanoate metabolism | 24/4020 | 32/8465 | 1.42e-03 | 5.07e-03 | 2.82e-03 | 24 |
| hsa0064051 | Liver | HCC | Propanoate metabolism | 24/4020 | 32/8465 | 1.42e-03 | 5.07e-03 | 2.82e-03 | 24 |
| Page: 1 |
Top |
Cell-cell communication analysis |
| Identification of potential cell-cell interactions between two cell types and their ligand-receptor pairs for different disease states |
| Ligand | Receptor | LRpair | Pathway | Tissue | Disease Stage |
| Page: 1 |
Top |
Single-cell gene regulatory network inference analysis |
| Find out the significant the regulons (TFs) and the target genes of each regulon across cell types for different disease states |
| TF | Cell Type | Tissue | Disease Stage | Target Gene | RSS | Regulon Activity |
| ∗The dot plots of a searched regulon are shown for all cell subpopulations in each disease state of each tissue based on the regulon specific score inferred using pySCENIC and by calculating the average expression. |
| Page: 1 |
Top |
Somatic mutation of malignant transformation related genes |
| Annotation of somatic variants for genes involved in malignant transformation |
| Hugo Symbol | Variant Class | Variant Classification | dbSNP RS | HGVSc | HGVSp | HGVSp Short | SWISSPROT | BIOTYPE | SIFT | PolyPhen | Tumor Sample Barcode | Tissue | Histology | Sex | Age | Stage | Therapy Types | Drugs | Outcome |
| ECHDC1 | SNV | Missense_Mutation | c.346G>C | p.Asp116His | p.D116H | Q9NTX5 | protein_coding | deleterious(0) | probably_damaging(1) | TCGA-AC-A23H-01 | Breast | breast invasive carcinoma | Female | >=65 | I/II | Unknown | Unknown | PD | |
| ECHDC1 | SNV | Missense_Mutation | novel | c.126A>C | p.Glu42Asp | p.E42D | Q9NTX5 | protein_coding | tolerated(0.2) | benign(0.014) | TCGA-AN-A046-01 | Breast | breast invasive carcinoma | Female | >=65 | I/II | Unknown | Unknown | SD |
| ECHDC1 | SNV | Missense_Mutation | c.333C>G | p.Phe111Leu | p.F111L | Q9NTX5 | protein_coding | deleterious(0.05) | probably_damaging(0.999) | TCGA-BH-A0DZ-01 | Breast | breast invasive carcinoma | Female | <65 | I/II | Chemotherapy | docetaxel | SD | |
| ECHDC1 | insertion | Frame_Shift_Ins | novel | c.326_327insA | p.Asn109LysfsTer8 | p.N109Kfs*8 | Q9NTX5 | protein_coding | TCGA-E9-A1NI-01 | Breast | breast invasive carcinoma | Female | <65 | I/II | Chemotherapy | doxorubicin | CR | ||
| ECHDC1 | SNV | Missense_Mutation | novel | c.712N>A | p.Glu238Lys | p.E238K | Q9NTX5 | protein_coding | tolerated(0.12) | possibly_damaging(0.831) | TCGA-EA-A3HU-01 | Cervix | cervical & endocervical cancer | Female | <65 | I/II | Unknown | Unknown | SD |
| ECHDC1 | insertion | Frame_Shift_Ins | rs753323556 | c.136dupA | p.Thr46AsnfsTer11 | p.T46Nfs*11 | Q9NTX5 | protein_coding | TCGA-2W-A8YY-01 | Cervix | cervical & endocervical cancer | Female | <65 | I/II | Chemotherapy | cisplatin | CR | ||
| ECHDC1 | SNV | Missense_Mutation | c.428N>G | p.Phe143Cys | p.F143C | Q9NTX5 | protein_coding | deleterious(0) | probably_damaging(0.954) | TCGA-AA-A010-01 | Colorectum | colon adenocarcinoma | Female | <65 | I/II | Chemotherapy | folinic | CR | |
| ECHDC1 | SNV | Missense_Mutation | c.64A>G | p.Lys22Glu | p.K22E | Q9NTX5 | protein_coding | deleterious_low_confidence(0.03) | benign(0.058) | TCGA-AA-A03J-01 | Colorectum | colon adenocarcinoma | Female | >=65 | I/II | Unknown | Unknown | SD | |
| ECHDC1 | SNV | Missense_Mutation | novel | c.430N>G | p.Met144Val | p.M144V | Q9NTX5 | protein_coding | tolerated(0.12) | benign(0.05) | TCGA-CA-6717-01 | Colorectum | colon adenocarcinoma | Male | <65 | I/II | Chemotherapy | oxaliplatin | CR |
| ECHDC1 | SNV | Missense_Mutation | c.593G>T | p.Arg198Leu | p.R198L | Q9NTX5 | protein_coding | deleterious(0) | probably_damaging(0.998) | TCGA-G4-6628-01 | Colorectum | colon adenocarcinoma | Male | >=65 | I/II | Unknown | Unknown | SD |
| Page: 1 2 3 4 |
Top |
Related drugs of malignant transformation related genes |
| Identification of chemicals and drugs interact with genes involved in malignant transfromation |
| (DGIdb 4.0) |
| Entrez ID | Symbol | Category | Interaction Types | Drug Claim Name | Drug Name | PMIDs |
| Page: 1 |

Copyright 2023-Present -The University of Texas Health Science Center at Houston |