
|
|||||
|
 | |
| |
| |
| |
| |
| |
|
Gene: DUSP3 |
Gene summary for DUSP3 |
| Gene information | Species | Human | Gene symbol | DUSP3 | Gene ID | 1845 |
| Gene name | dual specificity phosphatase 3 | |
| Gene Alias | VHR | |
| Cytomap | 17q21.31 | |
| Gene Type | protein-coding | GO ID | GO:0000165 | UniProtAcc | P51452 |
Top |
Malignant transformation analysis |
| Identification of the aberrant gene expression in precancerous and cancerous lesions by comparing the gene expression of stem-like cells in diseased tissues with normal stem cells |
| Entrez ID | Symbol | Replicates | Species | Organ | Tissue | Adj P-value | Log2FC | Malignancy |
| 1845 | DUSP3 | LZE4T | Human | Esophagus | ESCC | 7.22e-14 | 3.50e-01 | 0.0811 |
| 1845 | DUSP3 | LZE5T | Human | Esophagus | ESCC | 1.29e-04 | 1.87e-01 | 0.0514 |
| 1845 | DUSP3 | LZE20T | Human | Esophagus | ESCC | 6.65e-06 | 9.11e-02 | 0.0662 |
| 1845 | DUSP3 | LZE24T | Human | Esophagus | ESCC | 1.59e-15 | 5.79e-01 | 0.0596 |
| 1845 | DUSP3 | LZE6T | Human | Esophagus | ESCC | 1.97e-03 | 1.02e-01 | 0.0845 |
| 1845 | DUSP3 | P1T-E | Human | Esophagus | ESCC | 2.72e-07 | 3.61e-01 | 0.0875 |
| 1845 | DUSP3 | P2T-E | Human | Esophagus | ESCC | 3.04e-20 | 3.15e-01 | 0.1177 |
| 1845 | DUSP3 | P4T-E | Human | Esophagus | ESCC | 7.00e-26 | 4.76e-01 | 0.1323 |
| 1845 | DUSP3 | P5T-E | Human | Esophagus | ESCC | 7.61e-35 | 6.54e-01 | 0.1327 |
| 1845 | DUSP3 | P8T-E | Human | Esophagus | ESCC | 5.80e-17 | 3.91e-01 | 0.0889 |
| 1845 | DUSP3 | P9T-E | Human | Esophagus | ESCC | 4.81e-15 | 3.67e-01 | 0.1131 |
| 1845 | DUSP3 | P10T-E | Human | Esophagus | ESCC | 2.65e-18 | 1.29e-01 | 0.116 |
| 1845 | DUSP3 | P11T-E | Human | Esophagus | ESCC | 3.67e-19 | 5.14e-01 | 0.1426 |
| 1845 | DUSP3 | P12T-E | Human | Esophagus | ESCC | 1.46e-22 | 3.56e-01 | 0.1122 |
| 1845 | DUSP3 | P15T-E | Human | Esophagus | ESCC | 3.73e-28 | 7.89e-01 | 0.1149 |
| 1845 | DUSP3 | P16T-E | Human | Esophagus | ESCC | 1.47e-12 | 1.02e-01 | 0.1153 |
| 1845 | DUSP3 | P17T-E | Human | Esophagus | ESCC | 6.94e-21 | 7.05e-01 | 0.1278 |
| 1845 | DUSP3 | P19T-E | Human | Esophagus | ESCC | 5.27e-11 | 9.27e-01 | 0.1662 |
| 1845 | DUSP3 | P20T-E | Human | Esophagus | ESCC | 4.50e-18 | 2.57e-01 | 0.1124 |
| 1845 | DUSP3 | P21T-E | Human | Esophagus | ESCC | 1.15e-25 | 4.50e-01 | 0.1617 |
| Page: 1 2 3 4 5 6 |
| Tissue | Expression Dynamics | Abbreviation |
| Esophagus | 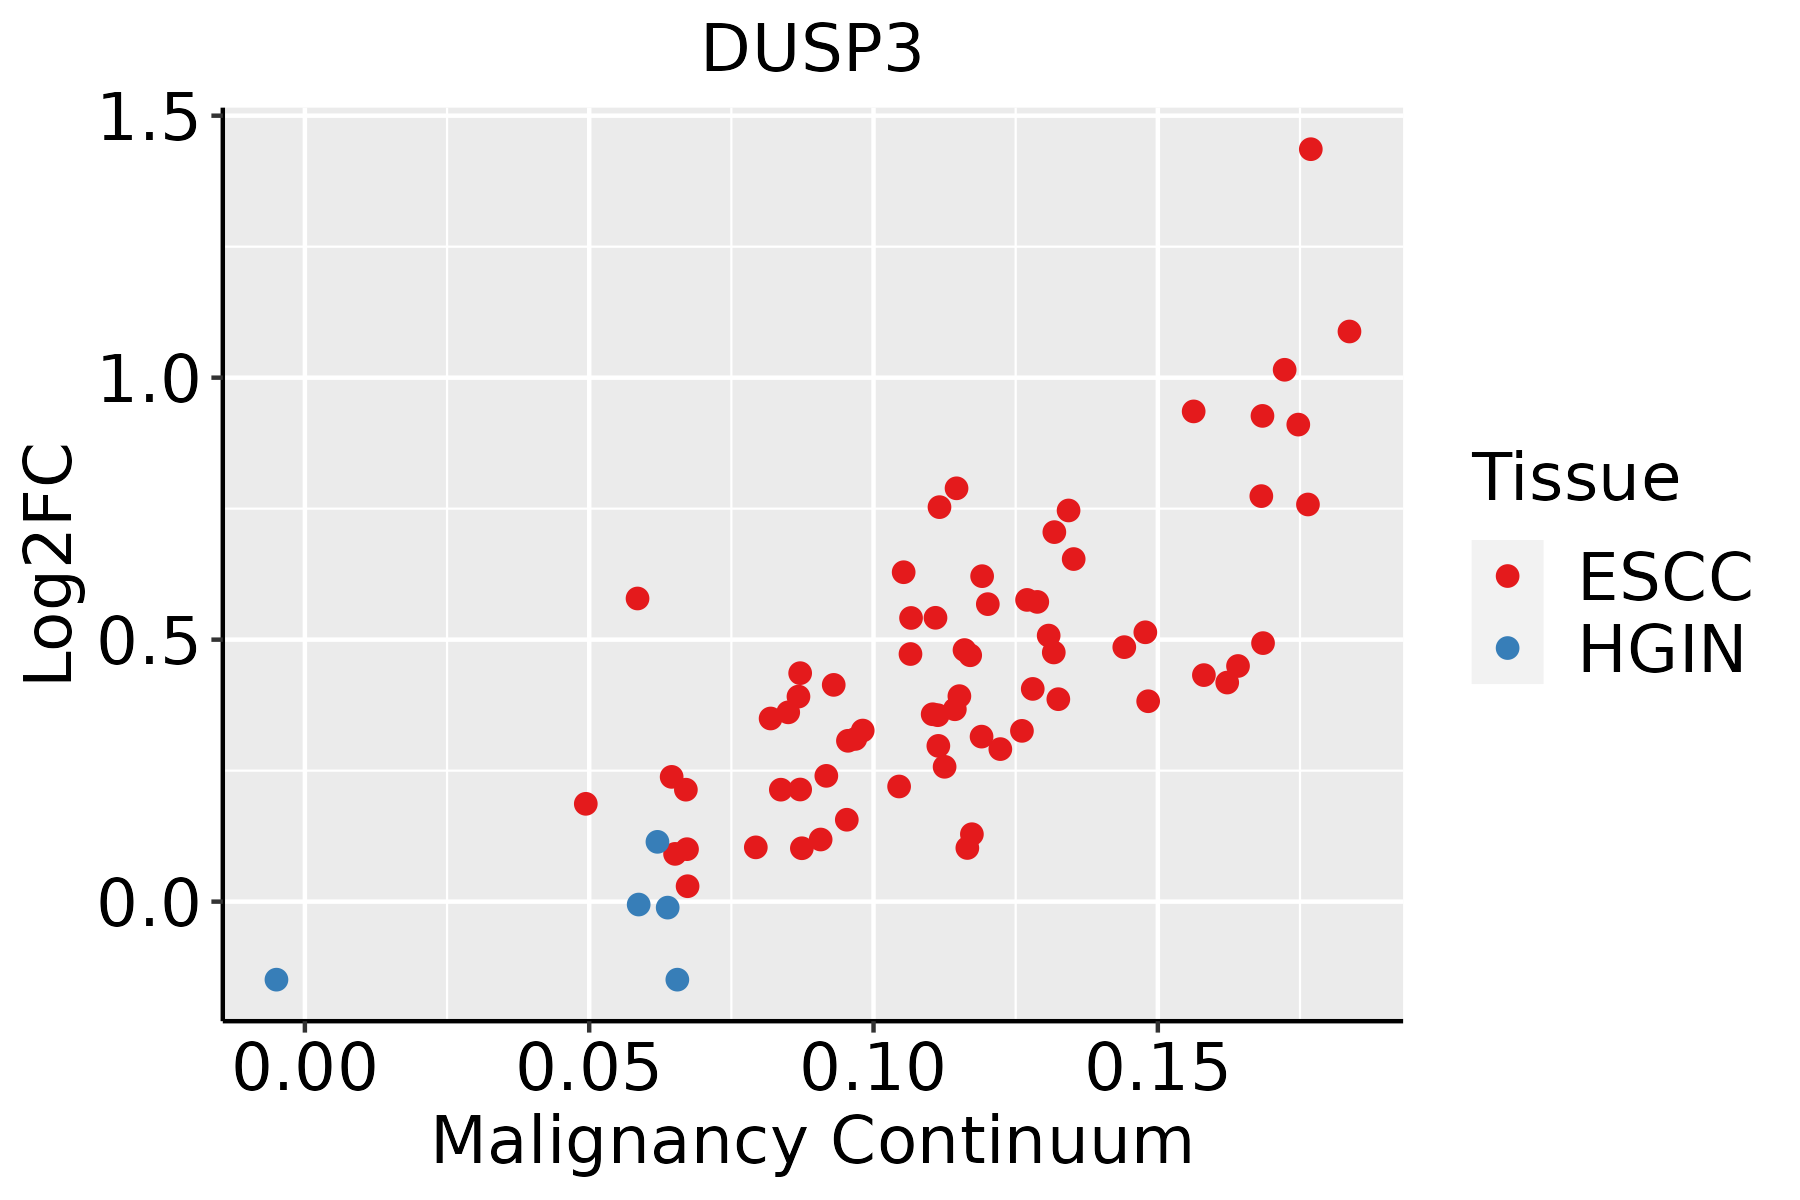 | ESCC: Esophageal squamous cell carcinoma |
| HGIN: High-grade intraepithelial neoplasias | ||
| LGIN: Low-grade intraepithelial neoplasias | ||
| Liver | 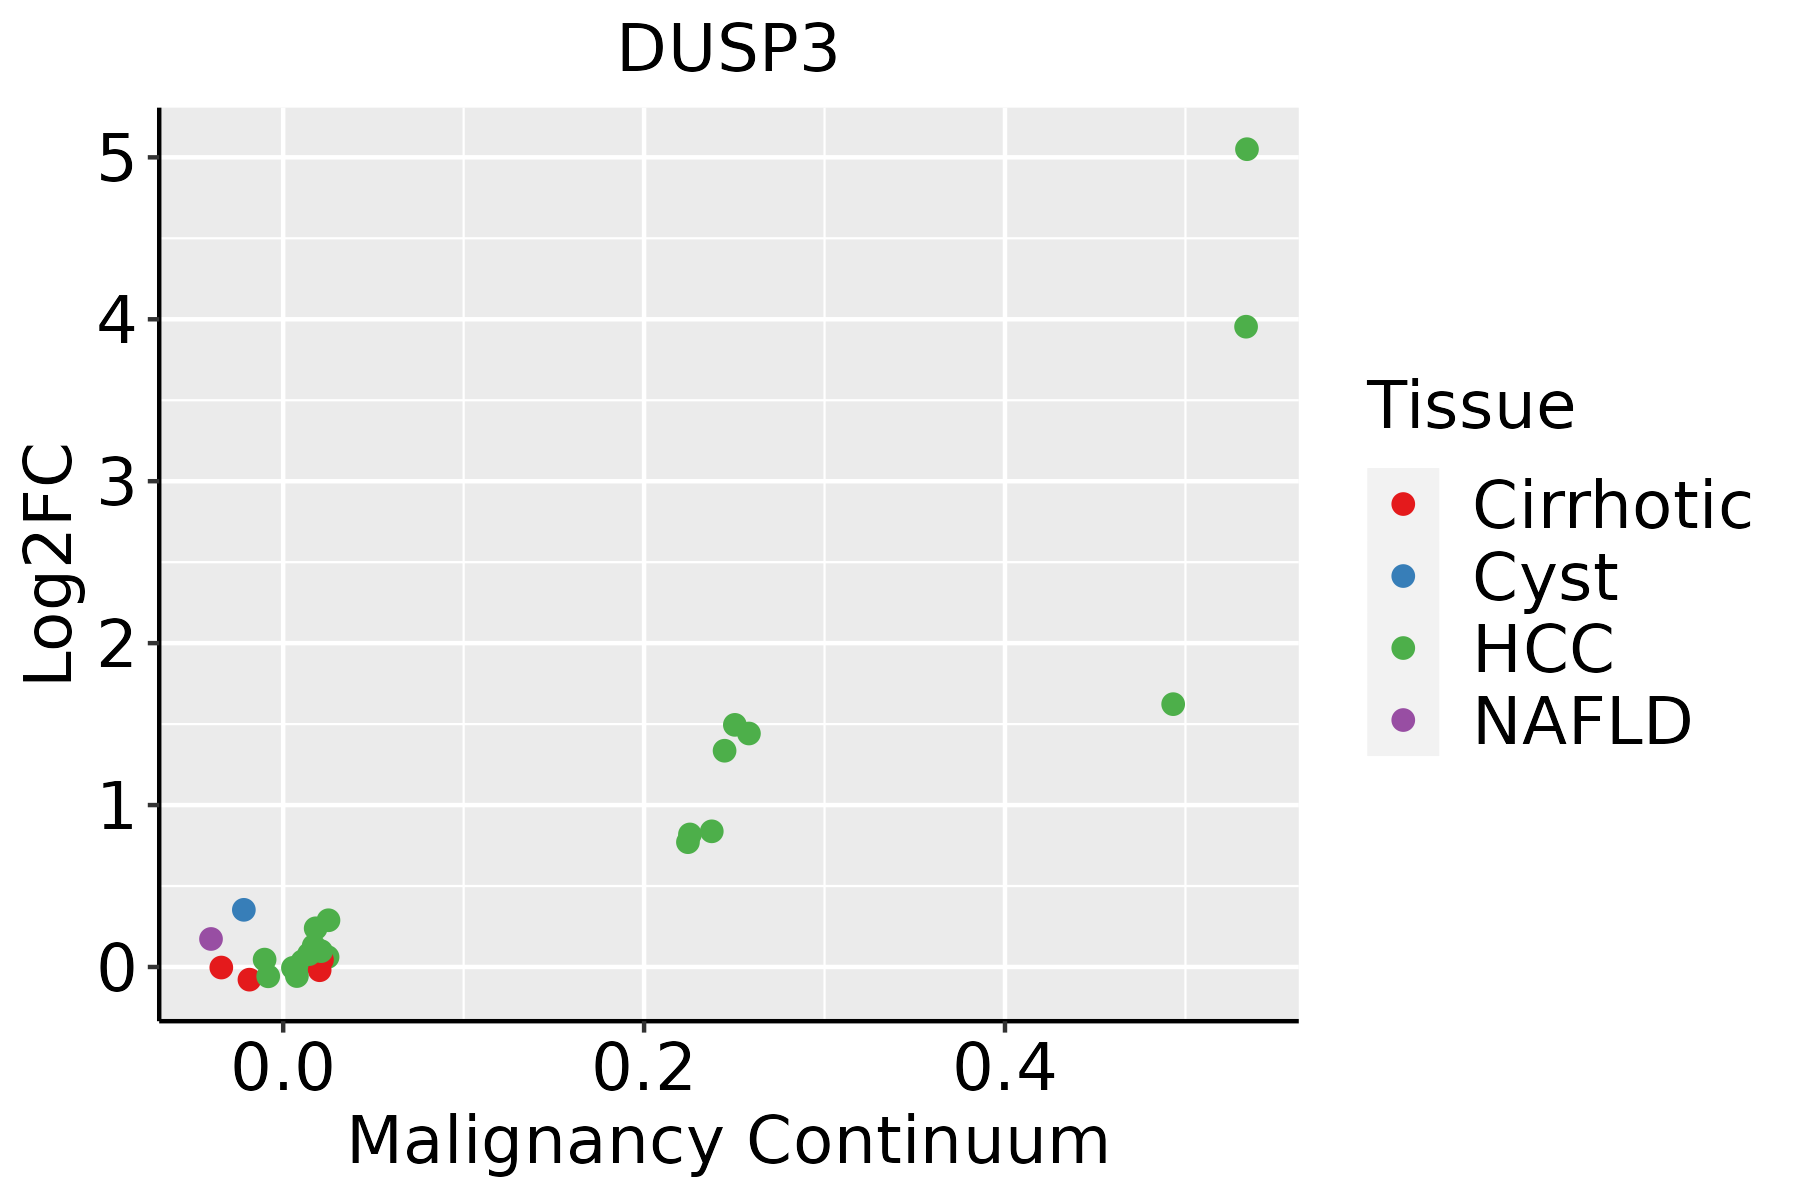 | HCC: Hepatocellular carcinoma |
| NAFLD: Non-alcoholic fatty liver disease | ||
| Oral Cavity | 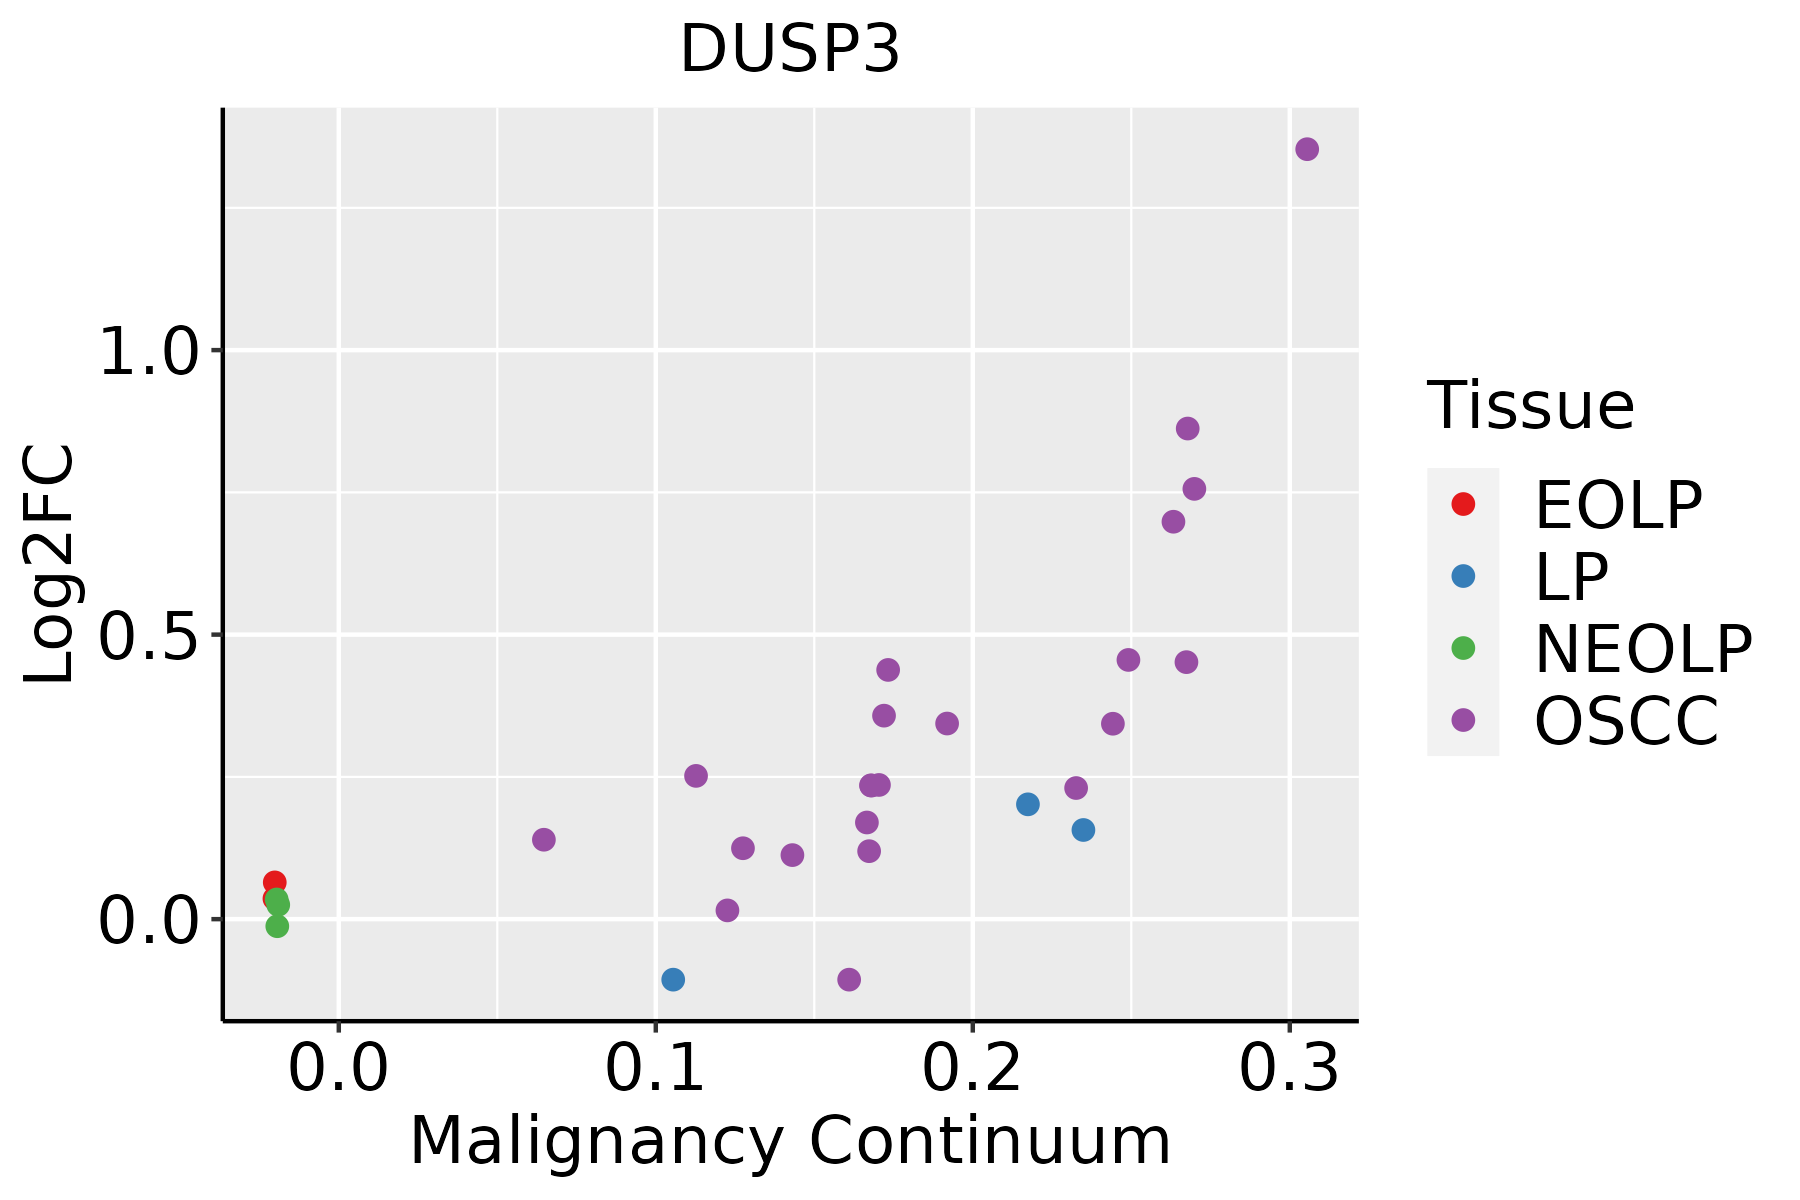 | EOLP: Erosive Oral lichen planus |
| LP: leukoplakia | ||
| NEOLP: Non-erosive oral lichen planus | ||
| OSCC: Oral squamous cell carcinoma | ||
| Thyroid | 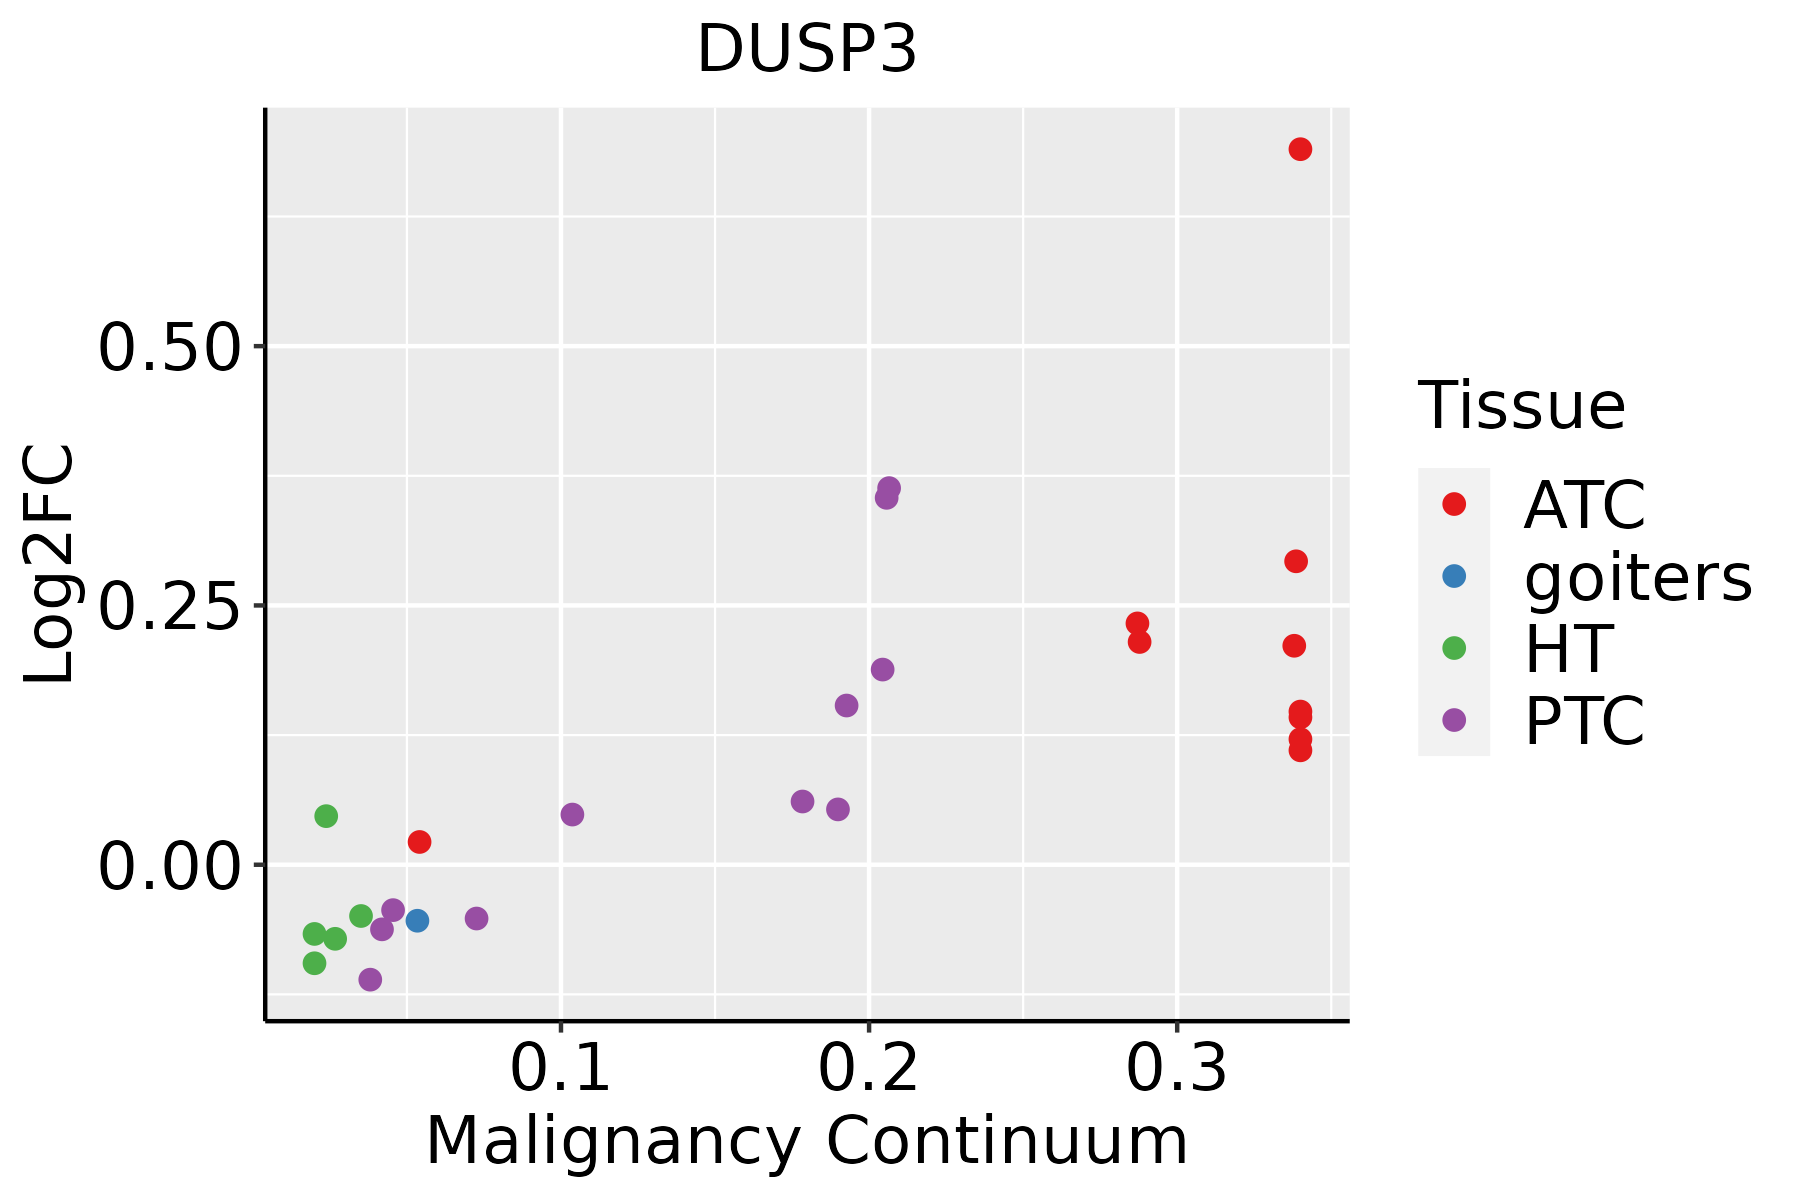 | ATC: Anaplastic thyroid cancer |
| HT: Hashimoto's thyroiditis | ||
| PTC: Papillary thyroid cancer |
| ∗log2FC in expression of this searched gene in stem-like cells from each diseased tissue sample relative to stem-like cells in normal samples in each tissue plotted against the malignancy continuum. Samples are colored based on if they are from different disease stage. |
Top |
Malignant transformation related pathway analysis |
| Find out the enriched GO biological processes and KEGG pathways involved in transition from healthy to precancer to cancer |
| Tissue | Disease Stage | Enriched GO biological Processes |
| Colorectum | AD |  |
| Colorectum | SER |  |
| Colorectum | MSS |  |
| Colorectum | MSI-H |  |
| Colorectum | FAP |  |
| ∗Top 15 enriched GO BP terms are showed in the bar plot of each disease state in each tissue. Each row represents a significant GO biological process which is colored according to the -log10(p.adjust). |
| Page: 1 2 3 4 5 6 7 8 9 |
| GO ID | Tissue | Disease Stage | Description | Gene Ratio | Bg Ratio | pvalue | p.adjust | Count |
| GO:00508602 | Liver | Cirrhotic | negative regulation of T cell receptor signaling pathway | 12/4634 | 22/18723 | 2.61e-03 | 1.53e-02 | 12 |
| GO:003367312 | Liver | Cirrhotic | negative regulation of kinase activity | 78/4634 | 237/18723 | 2.73e-03 | 1.59e-02 | 78 |
| GO:000717311 | Liver | Cirrhotic | epidermal growth factor receptor signaling pathway | 39/4634 | 108/18723 | 5.49e-03 | 2.79e-02 | 39 |
| GO:007030212 | Liver | Cirrhotic | regulation of stress-activated protein kinase signaling cascade | 64/4634 | 195/18723 | 6.61e-03 | 3.27e-02 | 64 |
| GO:00457874 | Liver | Cirrhotic | positive regulation of cell cycle | 97/4634 | 313/18723 | 6.88e-03 | 3.38e-02 | 97 |
| GO:00064697 | Liver | Cirrhotic | negative regulation of protein kinase activity | 68/4634 | 212/18723 | 9.35e-03 | 4.29e-02 | 68 |
| GO:00071624 | Liver | Cirrhotic | negative regulation of cell adhesion | 93/4634 | 303/18723 | 1.06e-02 | 4.66e-02 | 93 |
| GO:003287212 | Liver | Cirrhotic | regulation of stress-activated MAPK cascade | 62/4634 | 192/18723 | 1.08e-02 | 4.77e-02 | 62 |
| GO:002241112 | Liver | HCC | cellular component disassembly | 282/7958 | 443/18723 | 1.02e-19 | 1.38e-17 | 282 |
| GO:001056322 | Liver | HCC | negative regulation of phosphorus metabolic process | 259/7958 | 442/18723 | 4.29e-12 | 1.92e-10 | 259 |
| GO:004593622 | Liver | HCC | negative regulation of phosphate metabolic process | 258/7958 | 441/18723 | 6.00e-12 | 2.60e-10 | 258 |
| GO:004232622 | Liver | HCC | negative regulation of phosphorylation | 227/7958 | 385/18723 | 3.98e-11 | 1.52e-09 | 227 |
| GO:005134822 | Liver | HCC | negative regulation of transferase activity | 166/7958 | 268/18723 | 8.97e-11 | 3.18e-09 | 166 |
| GO:000734611 | Liver | HCC | regulation of mitotic cell cycle | 255/7958 | 457/18723 | 4.96e-09 | 1.30e-07 | 255 |
| GO:003367322 | Liver | HCC | negative regulation of kinase activity | 144/7958 | 237/18723 | 9.76e-09 | 2.45e-07 | 144 |
| GO:000193322 | Liver | HCC | negative regulation of protein phosphorylation | 196/7958 | 342/18723 | 1.95e-08 | 4.63e-07 | 196 |
| GO:001631121 | Liver | HCC | dephosphorylation | 230/7958 | 417/18723 | 1.00e-07 | 1.96e-06 | 230 |
| GO:015011522 | Liver | HCC | cell-substrate junction organization | 69/7958 | 101/18723 | 1.36e-07 | 2.57e-06 | 69 |
| GO:000647021 | Liver | HCC | protein dephosphorylation | 162/7958 | 281/18723 | 1.91e-07 | 3.46e-06 | 162 |
| GO:000646912 | Liver | HCC | negative regulation of protein kinase activity | 126/7958 | 212/18723 | 4.55e-07 | 7.49e-06 | 126 |
| Page: 1 2 3 4 5 6 7 8 9 10 11 12 13 14 |
| Pathway ID | Tissue | Disease Stage | Description | Gene Ratio | Bg Ratio | pvalue | p.adjust | qvalue | Count |
| hsa0401014 | Oral cavity | OSCC | MAPK signaling pathway | 165/3704 | 302/8465 | 7.11e-05 | 2.74e-04 | 1.40e-04 | 165 |
| hsa0401015 | Oral cavity | OSCC | MAPK signaling pathway | 165/3704 | 302/8465 | 7.11e-05 | 2.74e-04 | 1.40e-04 | 165 |
| Page: 1 |
Top |
Cell-cell communication analysis |
| Identification of potential cell-cell interactions between two cell types and their ligand-receptor pairs for different disease states |
| Ligand | Receptor | LRpair | Pathway | Tissue | Disease Stage |
| Page: 1 |
Top |
Single-cell gene regulatory network inference analysis |
| Find out the significant the regulons (TFs) and the target genes of each regulon across cell types for different disease states |
| TF | Cell Type | Tissue | Disease Stage | Target Gene | RSS | Regulon Activity |
| ∗The dot plots of a searched regulon are shown for all cell subpopulations in each disease state of each tissue based on the regulon specific score inferred using pySCENIC and by calculating the average expression. |
| Page: 1 |
Top |
Somatic mutation of malignant transformation related genes |
| Annotation of somatic variants for genes involved in malignant transformation |
| Hugo Symbol | Variant Class | Variant Classification | dbSNP RS | HGVSc | HGVSp | HGVSp Short | SWISSPROT | BIOTYPE | SIFT | PolyPhen | Tumor Sample Barcode | Tissue | Histology | Sex | Age | Stage | Therapy Types | Drugs | Outcome |
| DUSP3 | SNV | Missense_Mutation | rs200022065 | c.364N>A | p.Val122Ile | p.V122I | P51452 | protein_coding | deleterious(0.05) | probably_damaging(0.993) | TCGA-AZ-4681-01 | Colorectum | colon adenocarcinoma | Female | >=65 | I/II | Unknown | Unknown | SD |
| DUSP3 | SNV | Missense_Mutation | c.494N>A | p.Gly165Asp | p.G165D | P51452 | protein_coding | deleterious(0) | probably_damaging(0.999) | TCGA-AZ-6598-01 | Colorectum | colon adenocarcinoma | Female | >=65 | I/II | Unknown | Unknown | SD | |
| DUSP3 | SNV | Missense_Mutation | rs200022065 | c.364N>A | p.Val122Ile | p.V122I | P51452 | protein_coding | deleterious(0.05) | probably_damaging(0.993) | TCGA-D5-6927-01 | Colorectum | colon adenocarcinoma | Male | <65 | I/II | Unknown | Unknown | SD |
| DUSP3 | SNV | Missense_Mutation | novel | c.245N>T | p.Gly82Val | p.G82V | P51452 | protein_coding | deleterious(0) | probably_damaging(0.979) | TCGA-A5-A0G1-01 | Endometrium | uterine corpus endometrioid carcinoma | Female | >=65 | I/II | Unknown | Unknown | SD |
| DUSP3 | SNV | Missense_Mutation | novel | c.245N>T | p.Gly82Val | p.G82V | P51452 | protein_coding | deleterious(0) | probably_damaging(0.979) | TCGA-A5-A0GG-01 | Endometrium | uterine corpus endometrioid carcinoma | Female | >=65 | I/II | Unknown | Unknown | SD |
| DUSP3 | SNV | Missense_Mutation | rs202171863 | c.409N>A | p.Ala137Thr | p.A137T | P51452 | protein_coding | deleterious(0) | probably_damaging(1) | TCGA-AP-A1DK-01 | Endometrium | uterine corpus endometrioid carcinoma | Female | <65 | I/II | Unknown | Unknown | SD |
| DUSP3 | SNV | Missense_Mutation | novel | c.328N>T | p.Asp110Tyr | p.D110Y | P51452 | protein_coding | deleterious(0) | benign(0.423) | TCGA-AP-A1DV-01 | Endometrium | uterine corpus endometrioid carcinoma | Female | <65 | I/II | Unknown | Unknown | SD |
| DUSP3 | SNV | Missense_Mutation | c.231N>A | p.Phe77Leu | p.F77L | P51452 | protein_coding | deleterious(0) | possibly_damaging(0.482) | TCGA-AX-A0J0-01 | Endometrium | uterine corpus endometrioid carcinoma | Female | <65 | I/II | Unknown | Unknown | SD | |
| DUSP3 | SNV | Missense_Mutation | rs758918021 | c.298N>A | p.Ala100Thr | p.A100T | P51452 | protein_coding | tolerated(0.6) | benign(0.033) | TCGA-AX-A2HD-01 | Endometrium | uterine corpus endometrioid carcinoma | Female | >=65 | III/IV | Unknown | Unknown | SD |
| DUSP3 | SNV | Missense_Mutation | c.473N>A | p.Arg158His | p.R158H | P51452 | protein_coding | deleterious(0) | probably_damaging(1) | TCGA-B5-A11Y-01 | Endometrium | uterine corpus endometrioid carcinoma | Female | <65 | I/II | Unknown | Unknown | SD |
| Page: 1 2 |
Top |
Related drugs of malignant transformation related genes |
| Identification of chemicals and drugs interact with genes involved in malignant transfromation |
| (DGIdb 4.0) |
| Entrez ID | Symbol | Category | Interaction Types | Drug Claim Name | Drug Name | PMIDs |
| 1845 | DUSP3 | DRUGGABLE GENOME, PROTEIN PHOSPHATASE, KINASE | LOMOFUNGIN | LOMOFUNGIN | ||
| 1845 | DUSP3 | DRUGGABLE GENOME, PROTEIN PHOSPHATASE, KINASE | 1,4-DIMETHOXYANTHRAQUINONE | 1,4-DIMETHOXYANTHRAQUINONE | ||
| 1845 | DUSP3 | DRUGGABLE GENOME, PROTEIN PHOSPHATASE, KINASE | TDR77585 | CHEMBL1333386 | ||
| 1845 | DUSP3 | DRUGGABLE GENOME, PROTEIN PHOSPHATASE, KINASE | GNF-PF-159 | CHEMBL599924 | ||
| 1845 | DUSP3 | DRUGGABLE GENOME, PROTEIN PHOSPHATASE, KINASE | GNF-PF-67 | CHEMBL578512 | ||
| 1845 | DUSP3 | DRUGGABLE GENOME, PROTEIN PHOSPHATASE, KINASE | MESO-2,3-DIMERCAPTOSUCCINIC ACID | CHEMBL28721 | ||
| 1845 | DUSP3 | DRUGGABLE GENOME, PROTEIN PHOSPHATASE, KINASE | GNF-PF-231 | CHEMBL601167 |
| Page: 1 |

Copyright 2023-Present -The University of Texas Health Science Center at Houston |