
|
|||||
|
 | |
| |
| |
| |
| |
| |
|
Gene: DEDD2 |
Gene summary for DEDD2 |
| Gene information | Species | Human | Gene symbol | DEDD2 | Gene ID | 162989 |
| Gene name | death effector domain containing 2 | |
| Gene Alias | FLAME-3 | |
| Cytomap | 19q13.2 | |
| Gene Type | protein-coding | GO ID | GO:0006139 | UniProtAcc | Q8WXF8 |
Top |
Malignant transformation analysis |
| Identification of the aberrant gene expression in precancerous and cancerous lesions by comparing the gene expression of stem-like cells in diseased tissues with normal stem cells |
| Entrez ID | Symbol | Replicates | Species | Organ | Tissue | Adj P-value | Log2FC | Malignancy |
| 162989 | DEDD2 | LZE4T | Human | Esophagus | ESCC | 3.39e-13 | 4.06e-01 | 0.0811 |
| 162989 | DEDD2 | LZE7T | Human | Esophagus | ESCC | 2.37e-08 | 2.74e-01 | 0.0667 |
| 162989 | DEDD2 | LZE8T | Human | Esophagus | ESCC | 4.02e-04 | 2.04e-02 | 0.067 |
| 162989 | DEDD2 | LZE20T | Human | Esophagus | ESCC | 1.06e-05 | 3.83e-01 | 0.0662 |
| 162989 | DEDD2 | LZE22D1 | Human | Esophagus | HGIN | 1.91e-03 | 3.57e-02 | 0.0595 |
| 162989 | DEDD2 | LZE22T | Human | Esophagus | ESCC | 1.29e-03 | 7.98e-01 | 0.068 |
| 162989 | DEDD2 | LZE24T | Human | Esophagus | ESCC | 3.18e-14 | 4.37e-01 | 0.0596 |
| 162989 | DEDD2 | LZE6T | Human | Esophagus | ESCC | 3.82e-02 | 1.38e-01 | 0.0845 |
| 162989 | DEDD2 | P1T-E | Human | Esophagus | ESCC | 1.40e-04 | 5.99e-01 | 0.0875 |
| 162989 | DEDD2 | P2T-E | Human | Esophagus | ESCC | 1.28e-36 | 6.04e-01 | 0.1177 |
| 162989 | DEDD2 | P4T-E | Human | Esophagus | ESCC | 1.10e-28 | 8.28e-01 | 0.1323 |
| 162989 | DEDD2 | P5T-E | Human | Esophagus | ESCC | 1.35e-32 | 7.54e-01 | 0.1327 |
| 162989 | DEDD2 | P8T-E | Human | Esophagus | ESCC | 3.06e-19 | 6.50e-01 | 0.0889 |
| 162989 | DEDD2 | P9T-E | Human | Esophagus | ESCC | 4.97e-15 | 1.42e-01 | 0.1131 |
| 162989 | DEDD2 | P10T-E | Human | Esophagus | ESCC | 6.53e-17 | 4.08e-01 | 0.116 |
| 162989 | DEDD2 | P11T-E | Human | Esophagus | ESCC | 1.40e-25 | 1.64e+00 | 0.1426 |
| 162989 | DEDD2 | P12T-E | Human | Esophagus | ESCC | 5.76e-40 | 1.15e+00 | 0.1122 |
| 162989 | DEDD2 | P15T-E | Human | Esophagus | ESCC | 1.86e-24 | 7.85e-01 | 0.1149 |
| 162989 | DEDD2 | P16T-E | Human | Esophagus | ESCC | 6.33e-17 | 5.72e-01 | 0.1153 |
| 162989 | DEDD2 | P19T-E | Human | Esophagus | ESCC | 5.68e-06 | 2.03e-01 | 0.1662 |
| Page: 1 2 3 4 5 6 |
| Tissue | Expression Dynamics | Abbreviation |
| Esophagus |  | ESCC: Esophageal squamous cell carcinoma |
| HGIN: High-grade intraepithelial neoplasias | ||
| LGIN: Low-grade intraepithelial neoplasias | ||
| Liver | 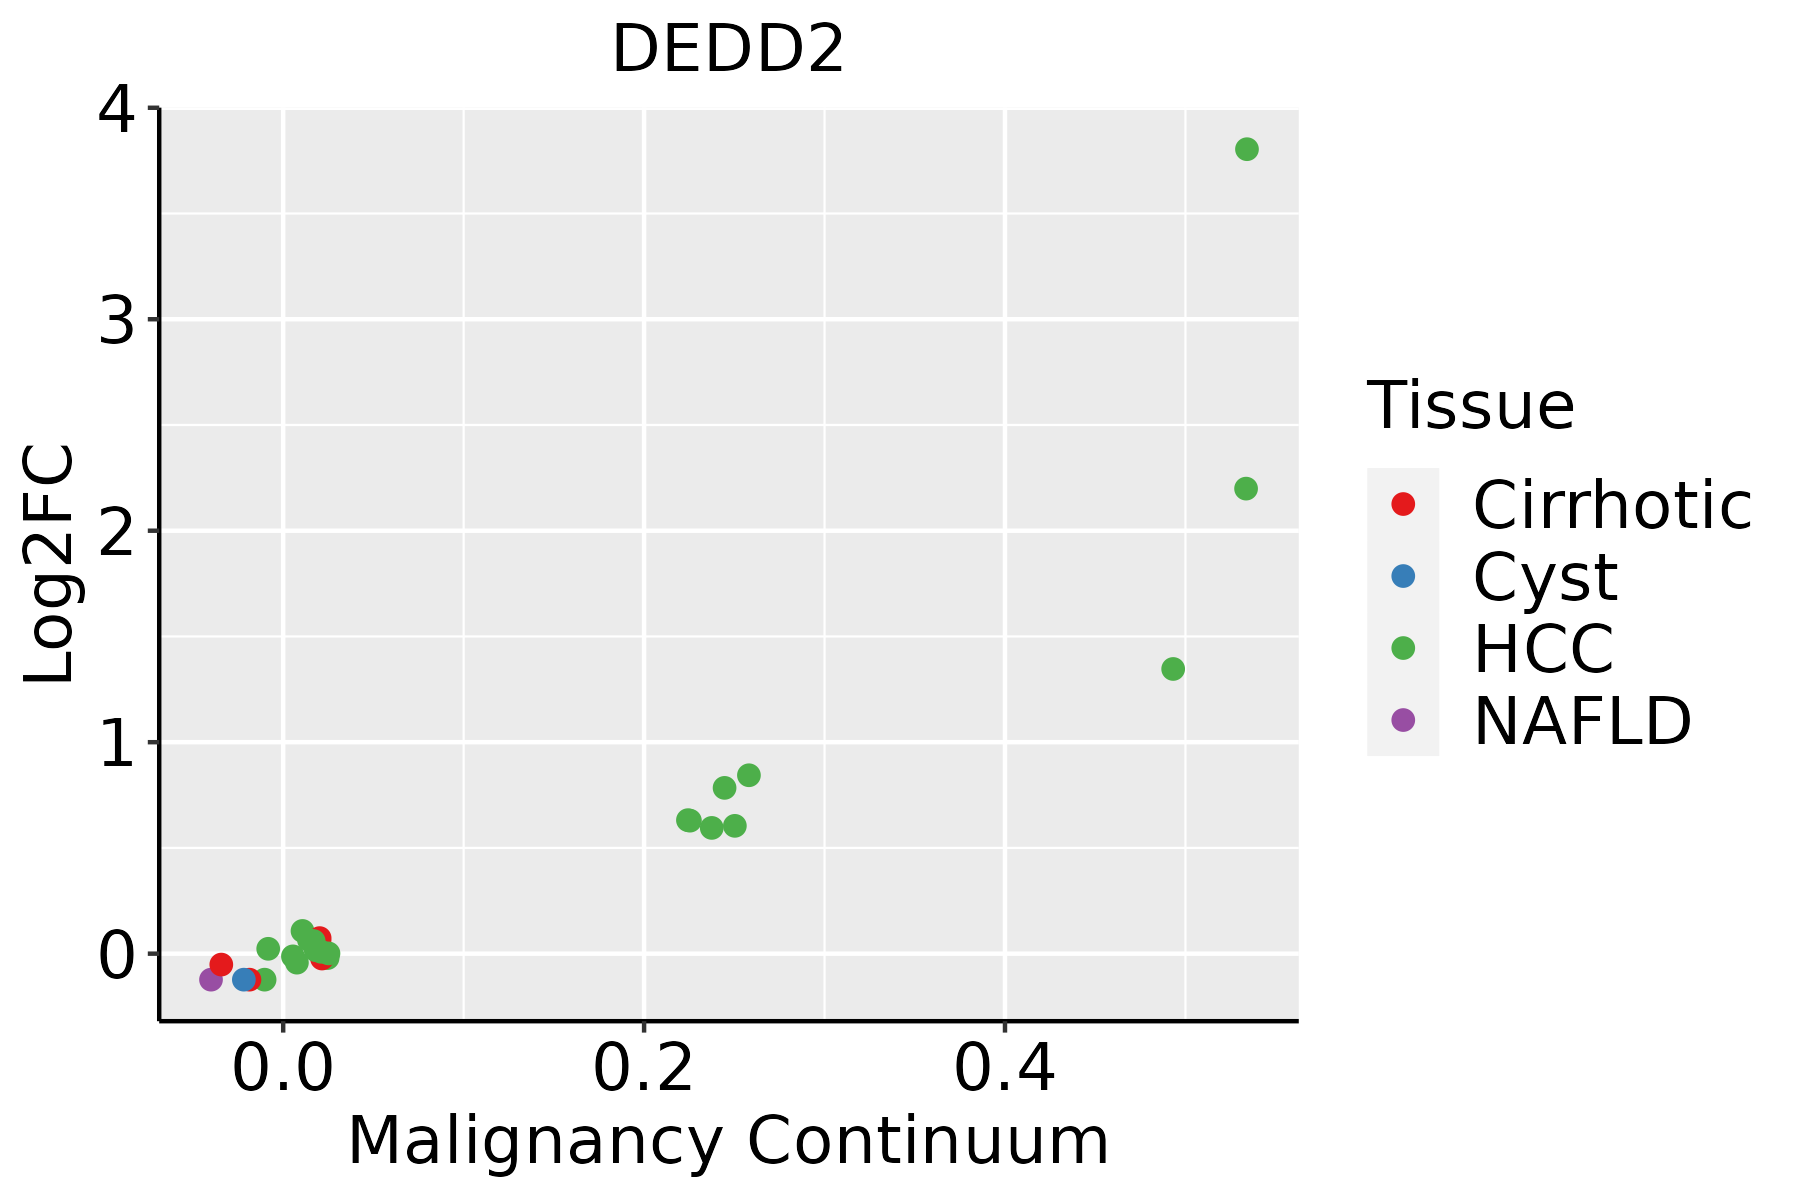 | HCC: Hepatocellular carcinoma |
| NAFLD: Non-alcoholic fatty liver disease | ||
| Oral Cavity | 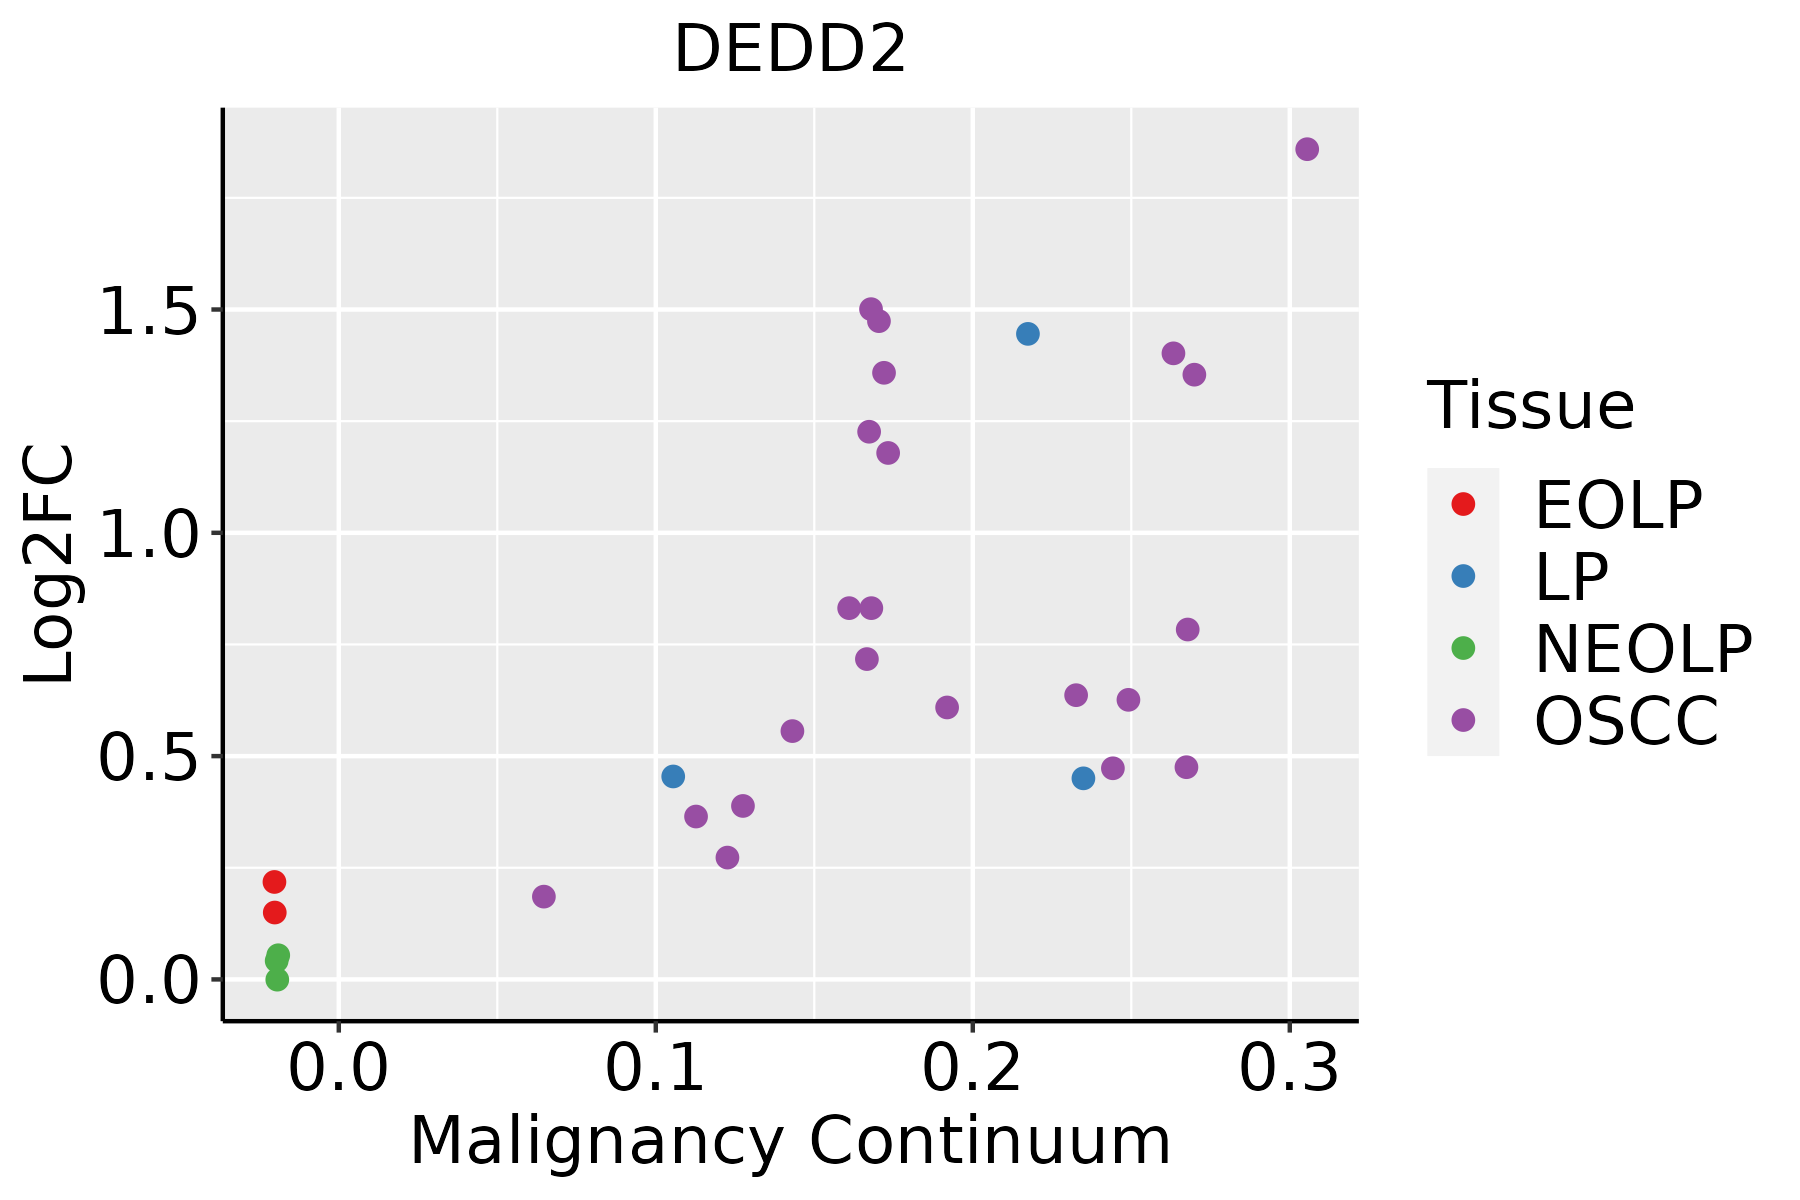 | EOLP: Erosive Oral lichen planus |
| LP: leukoplakia | ||
| NEOLP: Non-erosive oral lichen planus | ||
| OSCC: Oral squamous cell carcinoma | ||
| Thyroid | 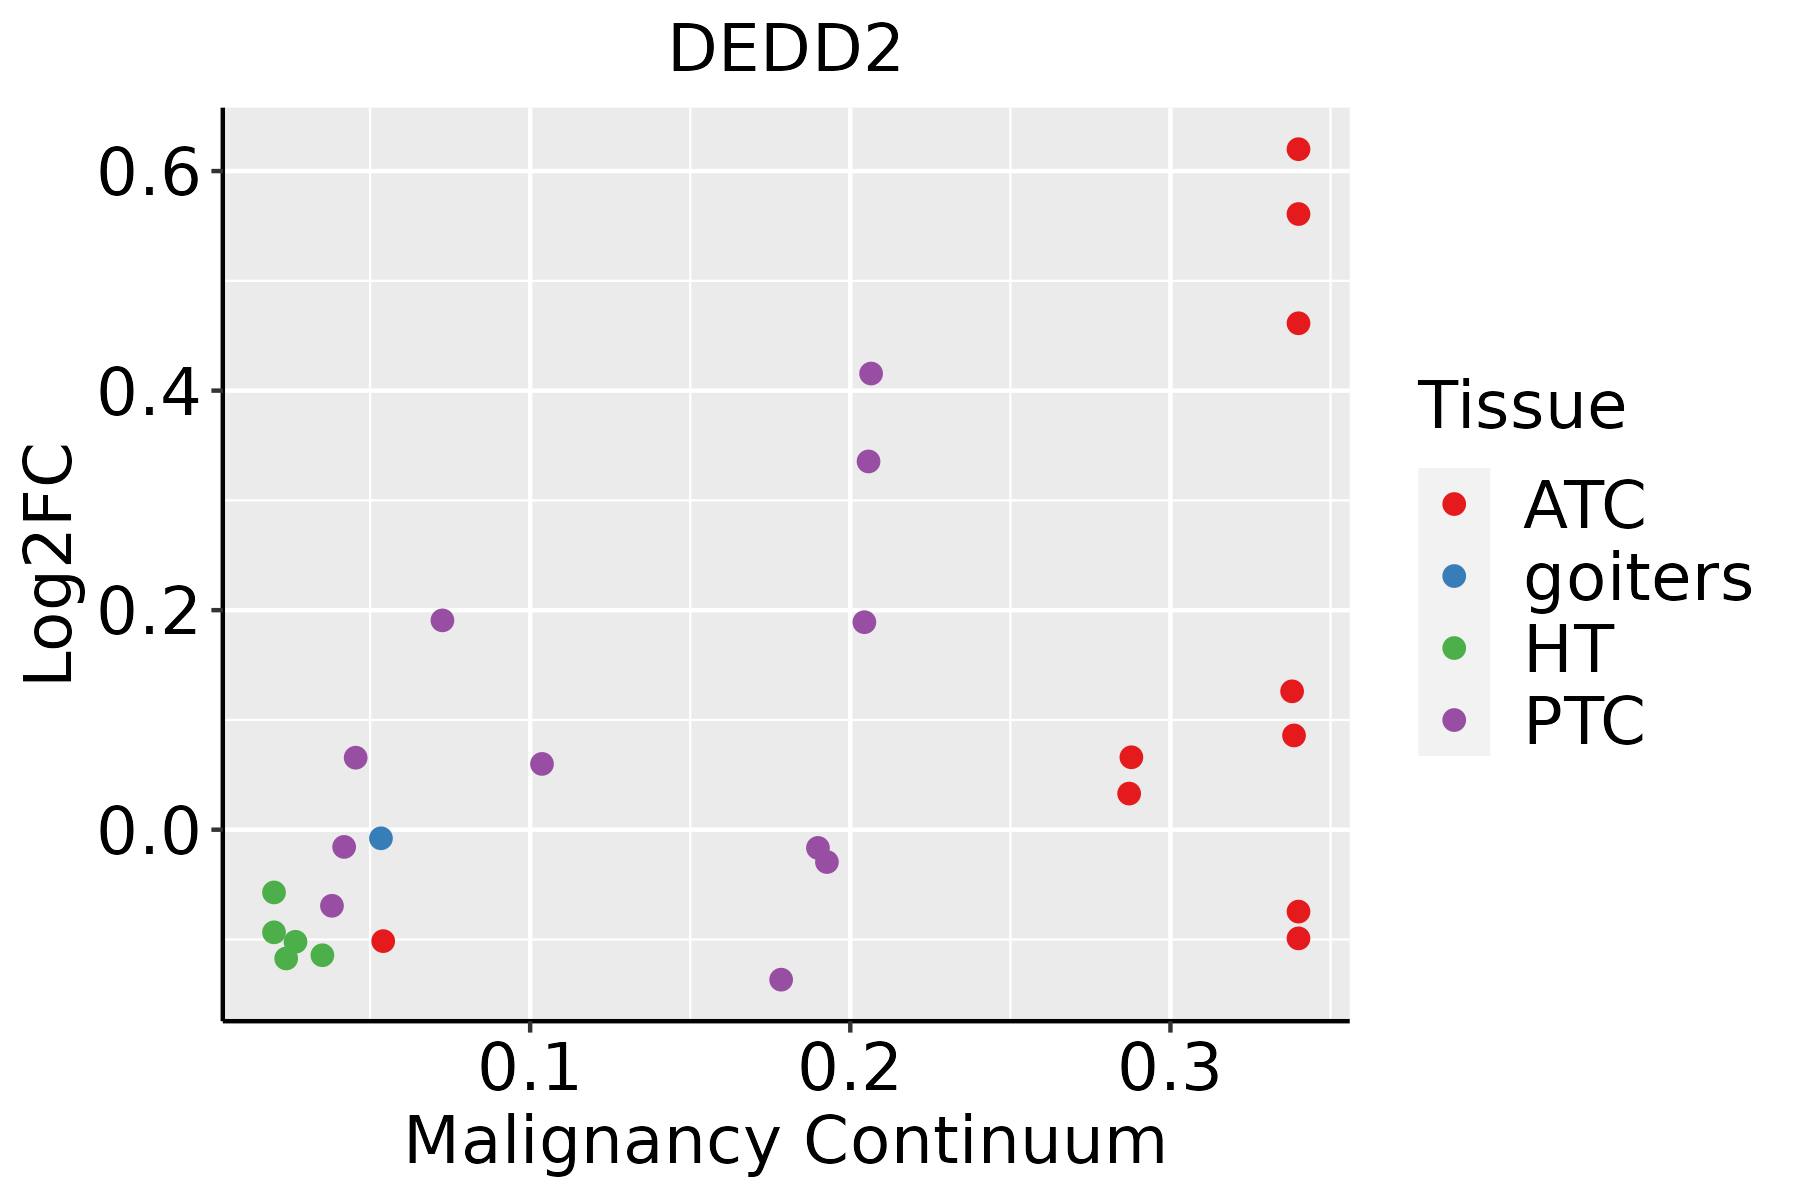 | ATC: Anaplastic thyroid cancer |
| HT: Hashimoto's thyroiditis | ||
| PTC: Papillary thyroid cancer |
| ∗log2FC in expression of this searched gene in stem-like cells from each diseased tissue sample relative to stem-like cells in normal samples in each tissue plotted against the malignancy continuum. Samples are colored based on if they are from different disease stage. |
Top |
Malignant transformation related pathway analysis |
| Find out the enriched GO biological processes and KEGG pathways involved in transition from healthy to precancer to cancer |
| Tissue | Disease Stage | Enriched GO biological Processes |
| Colorectum | AD |  |
| Colorectum | SER |  |
| Colorectum | MSS |  |
| Colorectum | MSI-H |  |
| Colorectum | FAP |  |
| ∗Top 15 enriched GO BP terms are showed in the bar plot of each disease state in each tissue. Each row represents a significant GO biological process which is colored according to the -log10(p.adjust). |
| Page: 1 2 3 4 5 6 7 8 9 |
| GO ID | Tissue | Disease Stage | Description | Gene Ratio | Bg Ratio | pvalue | p.adjust | Count |
| GO:000862516 | Oral cavity | OSCC | extrinsic apoptotic signaling pathway via death domain receptors | 53/7305 | 82/18723 | 2.30e-06 | 2.92e-05 | 53 |
| GO:00346612 | Oral cavity | OSCC | ncRNA catabolic process | 28/7305 | 43/18723 | 4.71e-04 | 2.79e-03 | 28 |
| GO:00160751 | Oral cavity | OSCC | rRNA catabolic process | 15/7305 | 21/18723 | 2.65e-03 | 1.16e-02 | 15 |
| GO:001607218 | Oral cavity | LP | rRNA metabolic process | 136/4623 | 236/18723 | 2.37e-27 | 1.48e-24 | 136 |
| GO:2001233110 | Oral cavity | LP | regulation of apoptotic signaling pathway | 168/4623 | 356/18723 | 1.35e-20 | 3.02e-18 | 168 |
| GO:003466011 | Oral cavity | LP | ncRNA metabolic process | 205/4623 | 485/18723 | 6.46e-18 | 1.09e-15 | 205 |
| GO:0022411110 | Oral cavity | LP | cellular component disassembly | 173/4623 | 443/18723 | 9.97e-12 | 7.44e-10 | 173 |
| GO:003465518 | Oral cavity | LP | nucleobase-containing compound catabolic process | 161/4623 | 407/18723 | 1.61e-11 | 1.15e-09 | 161 |
| GO:000640119 | Oral cavity | LP | RNA catabolic process | 118/4623 | 278/18723 | 4.98e-11 | 3.12e-09 | 118 |
| GO:001943916 | Oral cavity | LP | aromatic compound catabolic process | 176/4623 | 467/18723 | 1.96e-10 | 1.08e-08 | 176 |
| GO:004427017 | Oral cavity | LP | cellular nitrogen compound catabolic process | 170/4623 | 451/18723 | 3.93e-10 | 2.02e-08 | 170 |
| GO:004670016 | Oral cavity | LP | heterocycle catabolic process | 168/4623 | 445/18723 | 4.35e-10 | 2.20e-08 | 168 |
| GO:200123518 | Oral cavity | LP | positive regulation of apoptotic signaling pathway | 63/4623 | 126/18723 | 7.17e-10 | 3.43e-08 | 63 |
| GO:190136116 | Oral cavity | LP | organic cyclic compound catabolic process | 180/4623 | 495/18723 | 3.11e-09 | 1.35e-07 | 180 |
| GO:0097191110 | Oral cavity | LP | extrinsic apoptotic signaling pathway | 91/4623 | 219/18723 | 2.69e-08 | 9.80e-07 | 91 |
| GO:2001236110 | Oral cavity | LP | regulation of extrinsic apoptotic signaling pathway | 63/4623 | 151/18723 | 2.98e-06 | 6.47e-05 | 63 |
| GO:000862517 | Oral cavity | LP | extrinsic apoptotic signaling pathway via death domain receptors | 37/4623 | 82/18723 | 4.28e-05 | 6.15e-04 | 37 |
| GO:200123816 | Oral cavity | LP | positive regulation of extrinsic apoptotic signaling pathway | 24/4623 | 48/18723 | 1.33e-04 | 1.53e-03 | 24 |
| GO:0016072112 | Thyroid | PTC | rRNA metabolic process | 160/5968 | 236/18723 | 5.68e-30 | 3.58e-27 | 160 |
| GO:0006401112 | Thyroid | PTC | RNA catabolic process | 163/5968 | 278/18723 | 2.13e-20 | 3.27e-18 | 163 |
| Page: 1 2 3 4 5 6 7 |
| Pathway ID | Tissue | Disease Stage | Description | Gene Ratio | Bg Ratio | pvalue | p.adjust | qvalue | Count |
| Page: 1 |
Top |
Cell-cell communication analysis |
| Identification of potential cell-cell interactions between two cell types and their ligand-receptor pairs for different disease states |
| Ligand | Receptor | LRpair | Pathway | Tissue | Disease Stage |
| Page: 1 |
Top |
Single-cell gene regulatory network inference analysis |
| Find out the significant the regulons (TFs) and the target genes of each regulon across cell types for different disease states |
| TF | Cell Type | Tissue | Disease Stage | Target Gene | RSS | Regulon Activity |
| ∗The dot plots of a searched regulon are shown for all cell subpopulations in each disease state of each tissue based on the regulon specific score inferred using pySCENIC and by calculating the average expression. |
| Page: 1 |
Top |
Somatic mutation of malignant transformation related genes |
| Annotation of somatic variants for genes involved in malignant transformation |
| Hugo Symbol | Variant Class | Variant Classification | dbSNP RS | HGVSc | HGVSp | HGVSp Short | SWISSPROT | BIOTYPE | SIFT | PolyPhen | Tumor Sample Barcode | Tissue | Histology | Sex | Age | Stage | Therapy Types | Drugs | Outcome |
| DEDD2 | insertion | Nonsense_Mutation | novel | c.394_395insAAGCAATTCTCCTGCCTCAGCCTCCCAAGTAGCTGGAACTACAG | p.Arg132GlnfsTer11 | p.R132Qfs*11 | Q8WXF8 | protein_coding | TCGA-A8-A09B-01 | Breast | breast invasive carcinoma | Female | <65 | III/IV | Chemotherapy | 5-fluorouracil | SD | ||
| DEDD2 | SNV | Missense_Mutation | novel | c.795C>G | p.Asp265Glu | p.D265E | Q8WXF8 | protein_coding | deleterious(0) | benign(0.151) | TCGA-5M-AAT6-01 | Colorectum | colon adenocarcinoma | Female | <65 | III/IV | Unknown | Unknown | PD |
| DEDD2 | SNV | Missense_Mutation | rs376459217 | c.881N>A | p.Arg294His | p.R294H | Q8WXF8 | protein_coding | deleterious(0) | possibly_damaging(0.454) | TCGA-AZ-6598-01 | Colorectum | colon adenocarcinoma | Female | >=65 | I/II | Unknown | Unknown | SD |
| DEDD2 | SNV | Missense_Mutation | c.743N>A | p.Val248Asp | p.V248D | Q8WXF8 | protein_coding | deleterious(0) | possibly_damaging(0.796) | TCGA-CM-6676-01 | Colorectum | colon adenocarcinoma | Male | >=65 | I/II | Unknown | Unknown | SD | |
| DEDD2 | SNV | Missense_Mutation | rs535277377 | c.398N>A | p.Arg133His | p.R133H | Q8WXF8 | protein_coding | tolerated(0.61) | possibly_damaging(0.865) | TCGA-NH-A5IV-01 | Colorectum | colon adenocarcinoma | Female | >=65 | I/II | Unknown | Unknown | SD |
| DEDD2 | SNV | Missense_Mutation | rs781250383 | c.556N>A | p.Ala186Thr | p.A186T | Q8WXF8 | protein_coding | tolerated(0.57) | benign(0.003) | TCGA-EI-6507-01 | Colorectum | rectum adenocarcinoma | Male | <65 | I/II | Unknown | Unknown | SD |
| DEDD2 | SNV | Missense_Mutation | c.569N>G | p.Ser190Cys | p.S190C | Q8WXF8 | protein_coding | tolerated(0.19) | benign(0.21) | TCGA-A5-A0G5-01 | Endometrium | uterine corpus endometrioid carcinoma | Female | >=65 | I/II | Unknown | Unknown | SD | |
| DEDD2 | SNV | Missense_Mutation | novel | c.709N>A | p.Ala237Thr | p.A237T | Q8WXF8 | protein_coding | tolerated(1) | benign(0.007) | TCGA-A5-A1OF-01 | Endometrium | uterine corpus endometrioid carcinoma | Female | <65 | I/II | Unknown | Unknown | SD |
| DEDD2 | SNV | Missense_Mutation | rs750217130 | c.395G>A | p.Arg132His | p.R132H | Q8WXF8 | protein_coding | tolerated(0.15) | benign(0.007) | TCGA-AJ-A3EL-01 | Endometrium | uterine corpus endometrioid carcinoma | Female | <65 | I/II | Unknown | Unknown | SD |
| DEDD2 | SNV | Missense_Mutation | rs781250383 | c.556N>A | p.Ala186Thr | p.A186T | Q8WXF8 | protein_coding | tolerated(0.57) | benign(0.003) | TCGA-AJ-A8CW-01 | Endometrium | uterine corpus endometrioid carcinoma | Female | <65 | I/II | Unknown | Unknown | SD |
| Page: 1 2 3 4 |
Top |
Related drugs of malignant transformation related genes |
| Identification of chemicals and drugs interact with genes involved in malignant transfromation |
| (DGIdb 4.0) |
| Entrez ID | Symbol | Category | Interaction Types | Drug Claim Name | Drug Name | PMIDs |
| Page: 1 |

Copyright 2023-Present -The University of Texas Health Science Center at Houston |