| Tissue | Expression Dynamics | Abbreviation |
| Colorectum (GSE201348) | 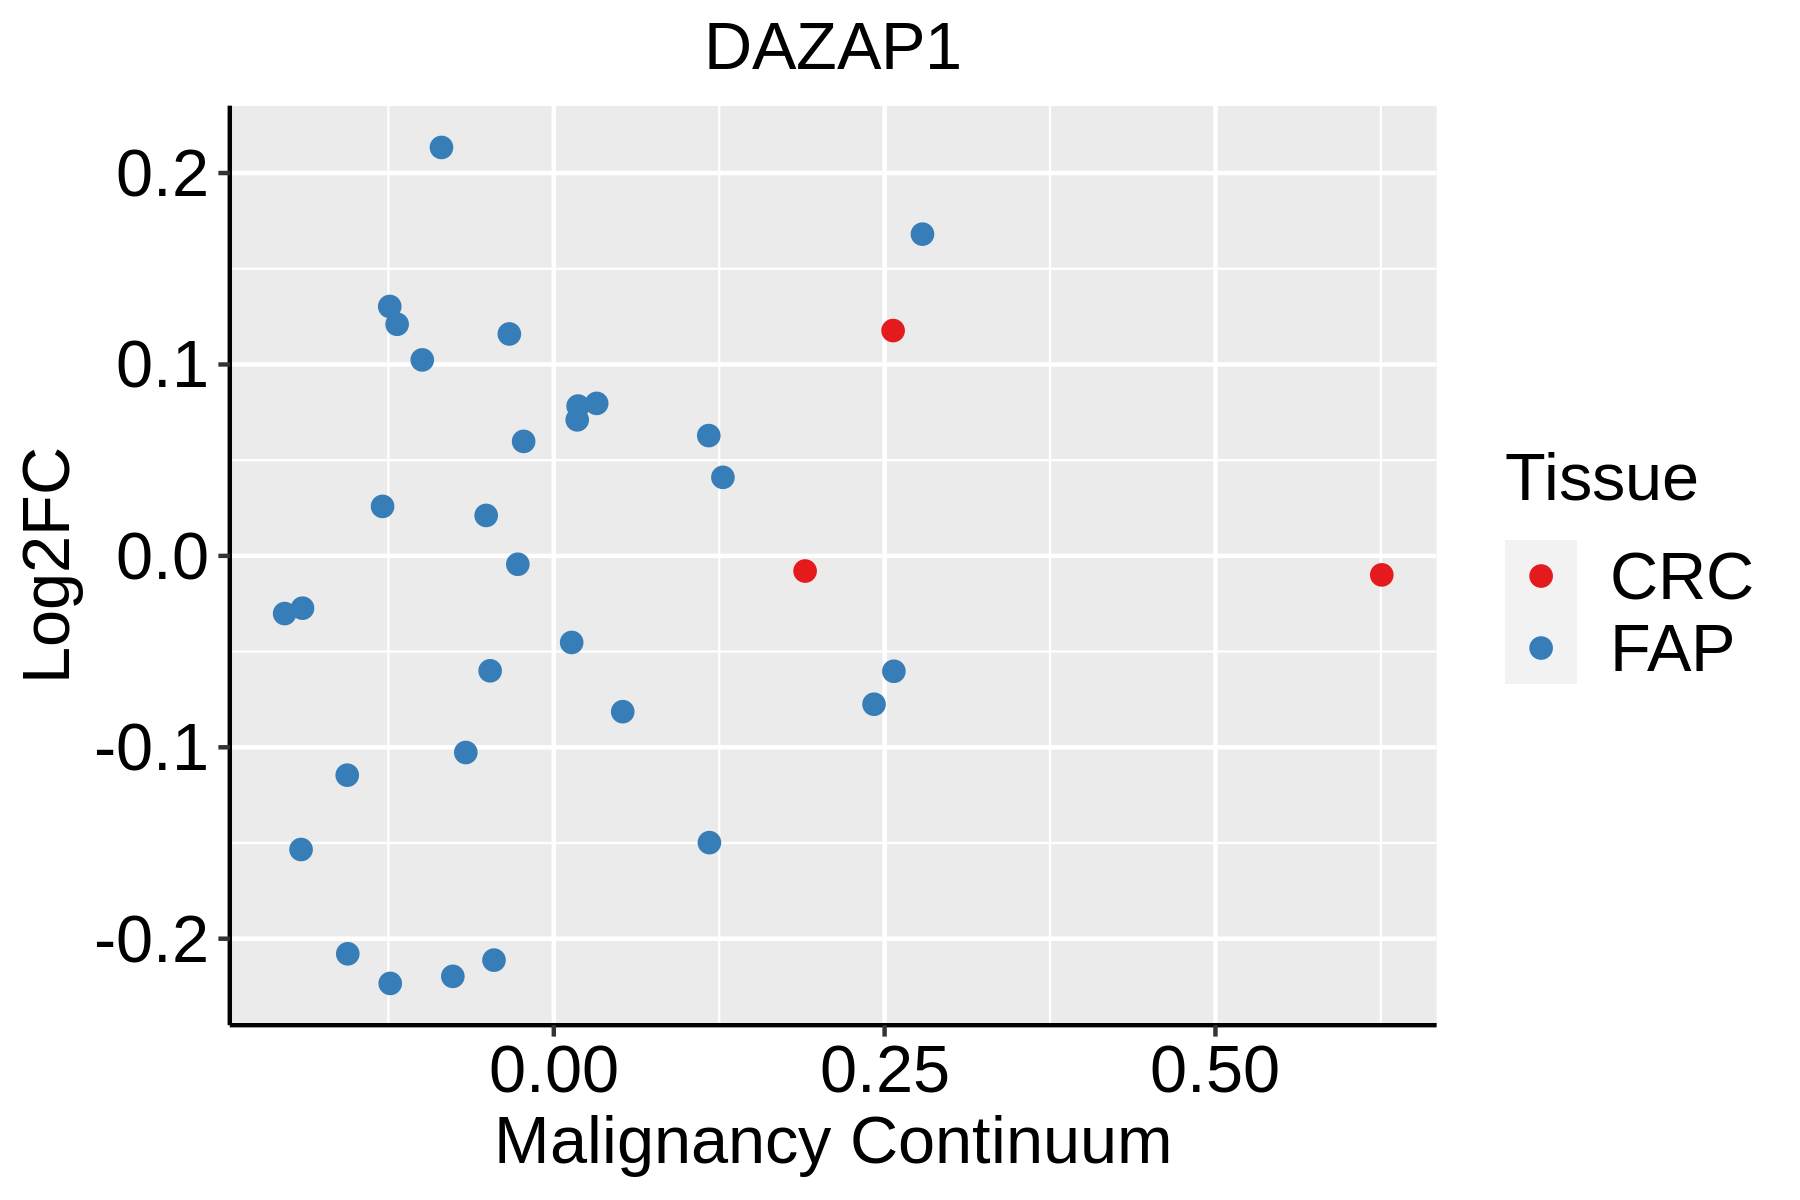 | FAP: Familial adenomatous polyposis |
| CRC: Colorectal cancer |
| Colorectum (HTA11) |  | AD: Adenomas |
| SER: Sessile serrated lesions |
| MSI-H: Microsatellite-high colorectal cancer |
| MSS: Microsatellite stable colorectal cancer |
| Esophagus | 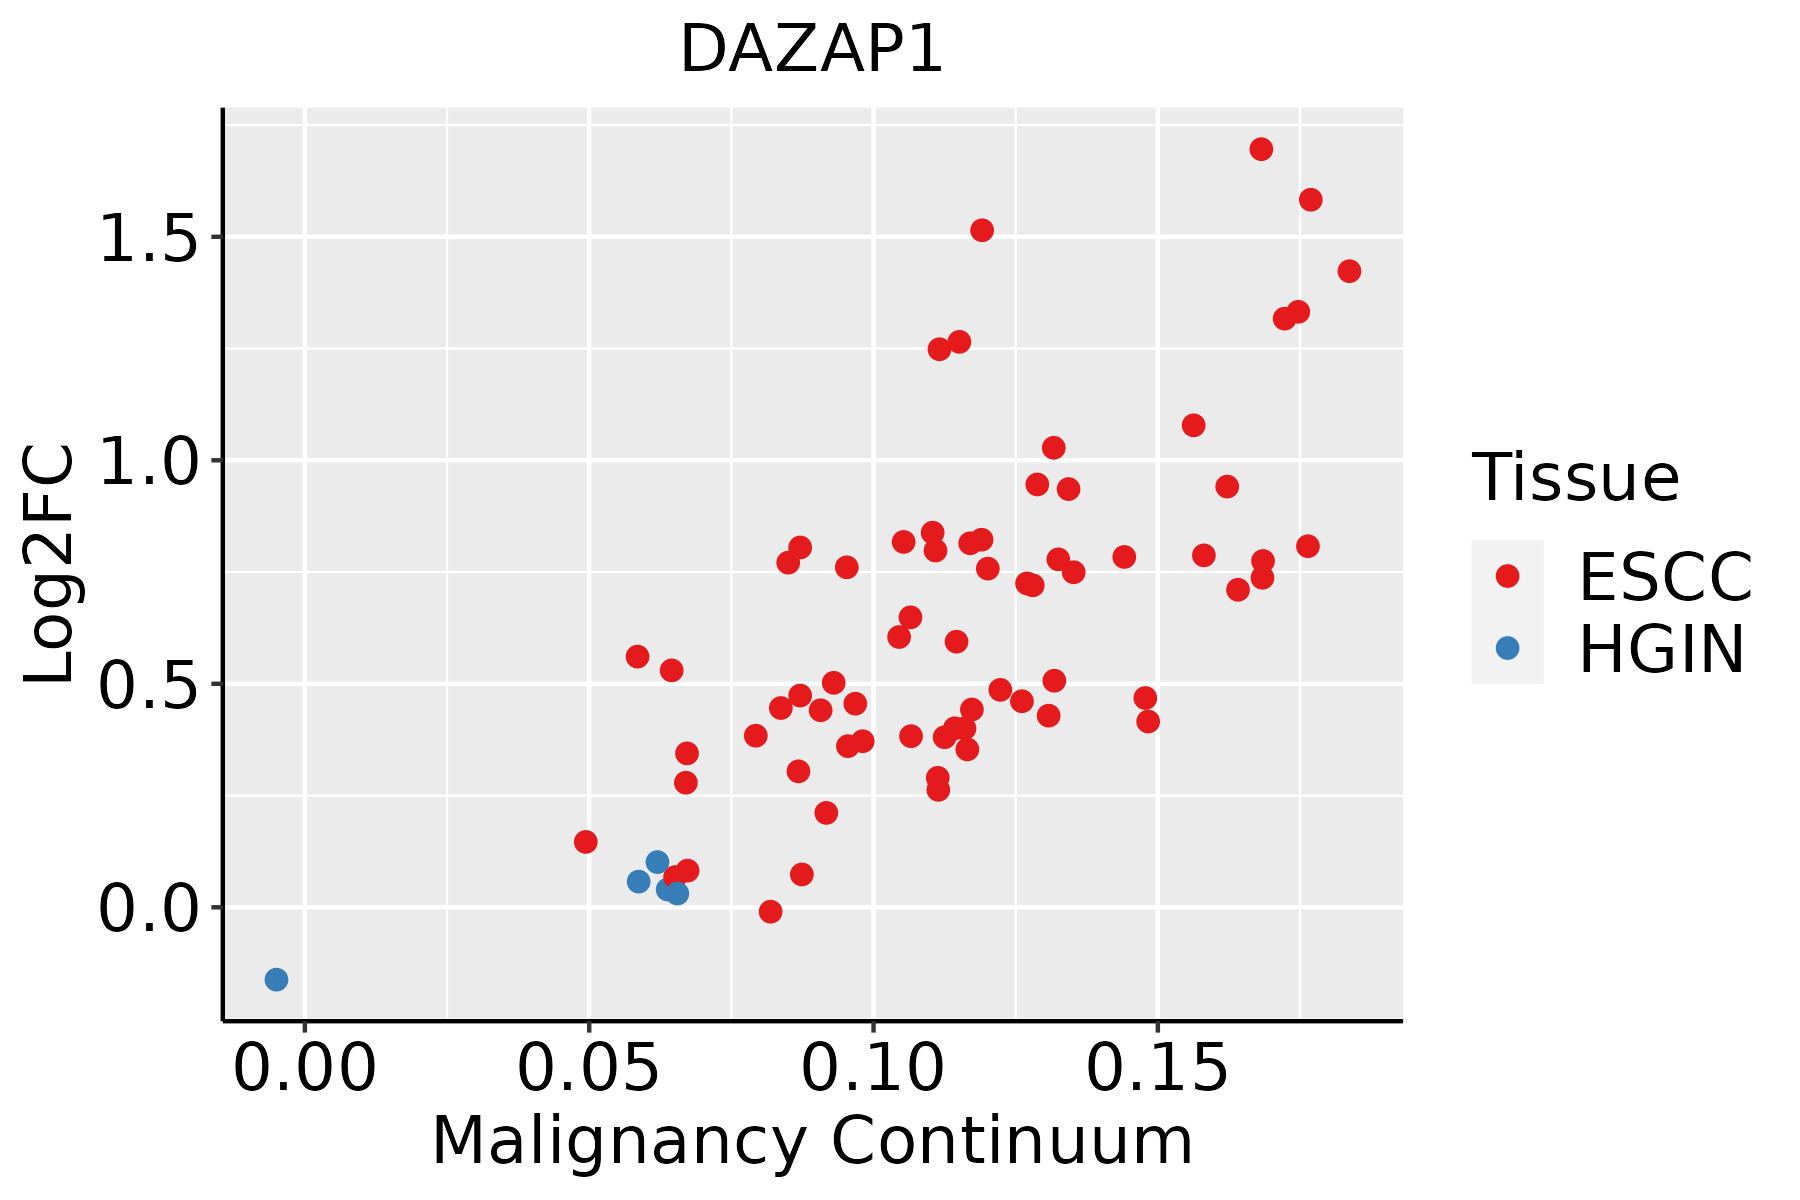 | ESCC: Esophageal squamous cell carcinoma |
| HGIN: High-grade intraepithelial neoplasias |
| LGIN: Low-grade intraepithelial neoplasias |
| Liver | 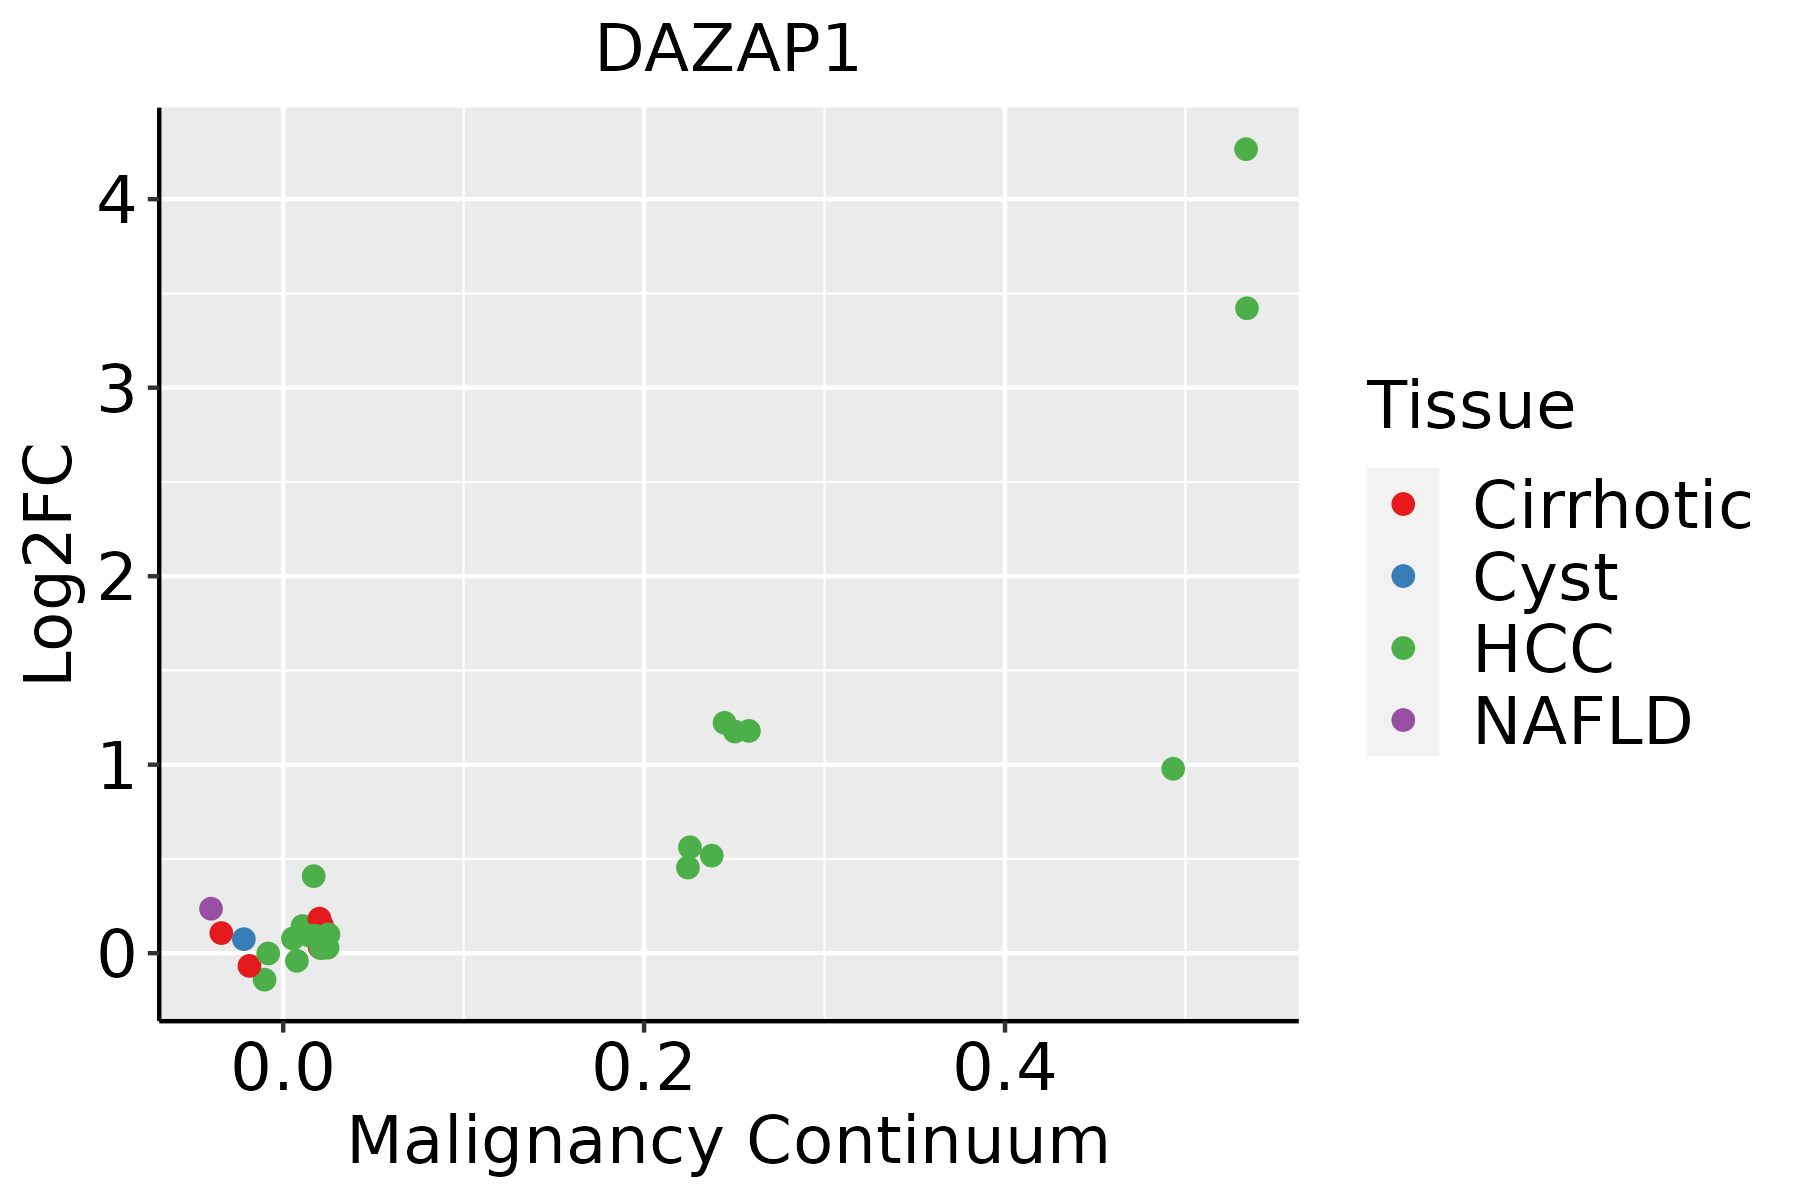 | HCC: Hepatocellular carcinoma |
| NAFLD: Non-alcoholic fatty liver disease |
| Oral Cavity | 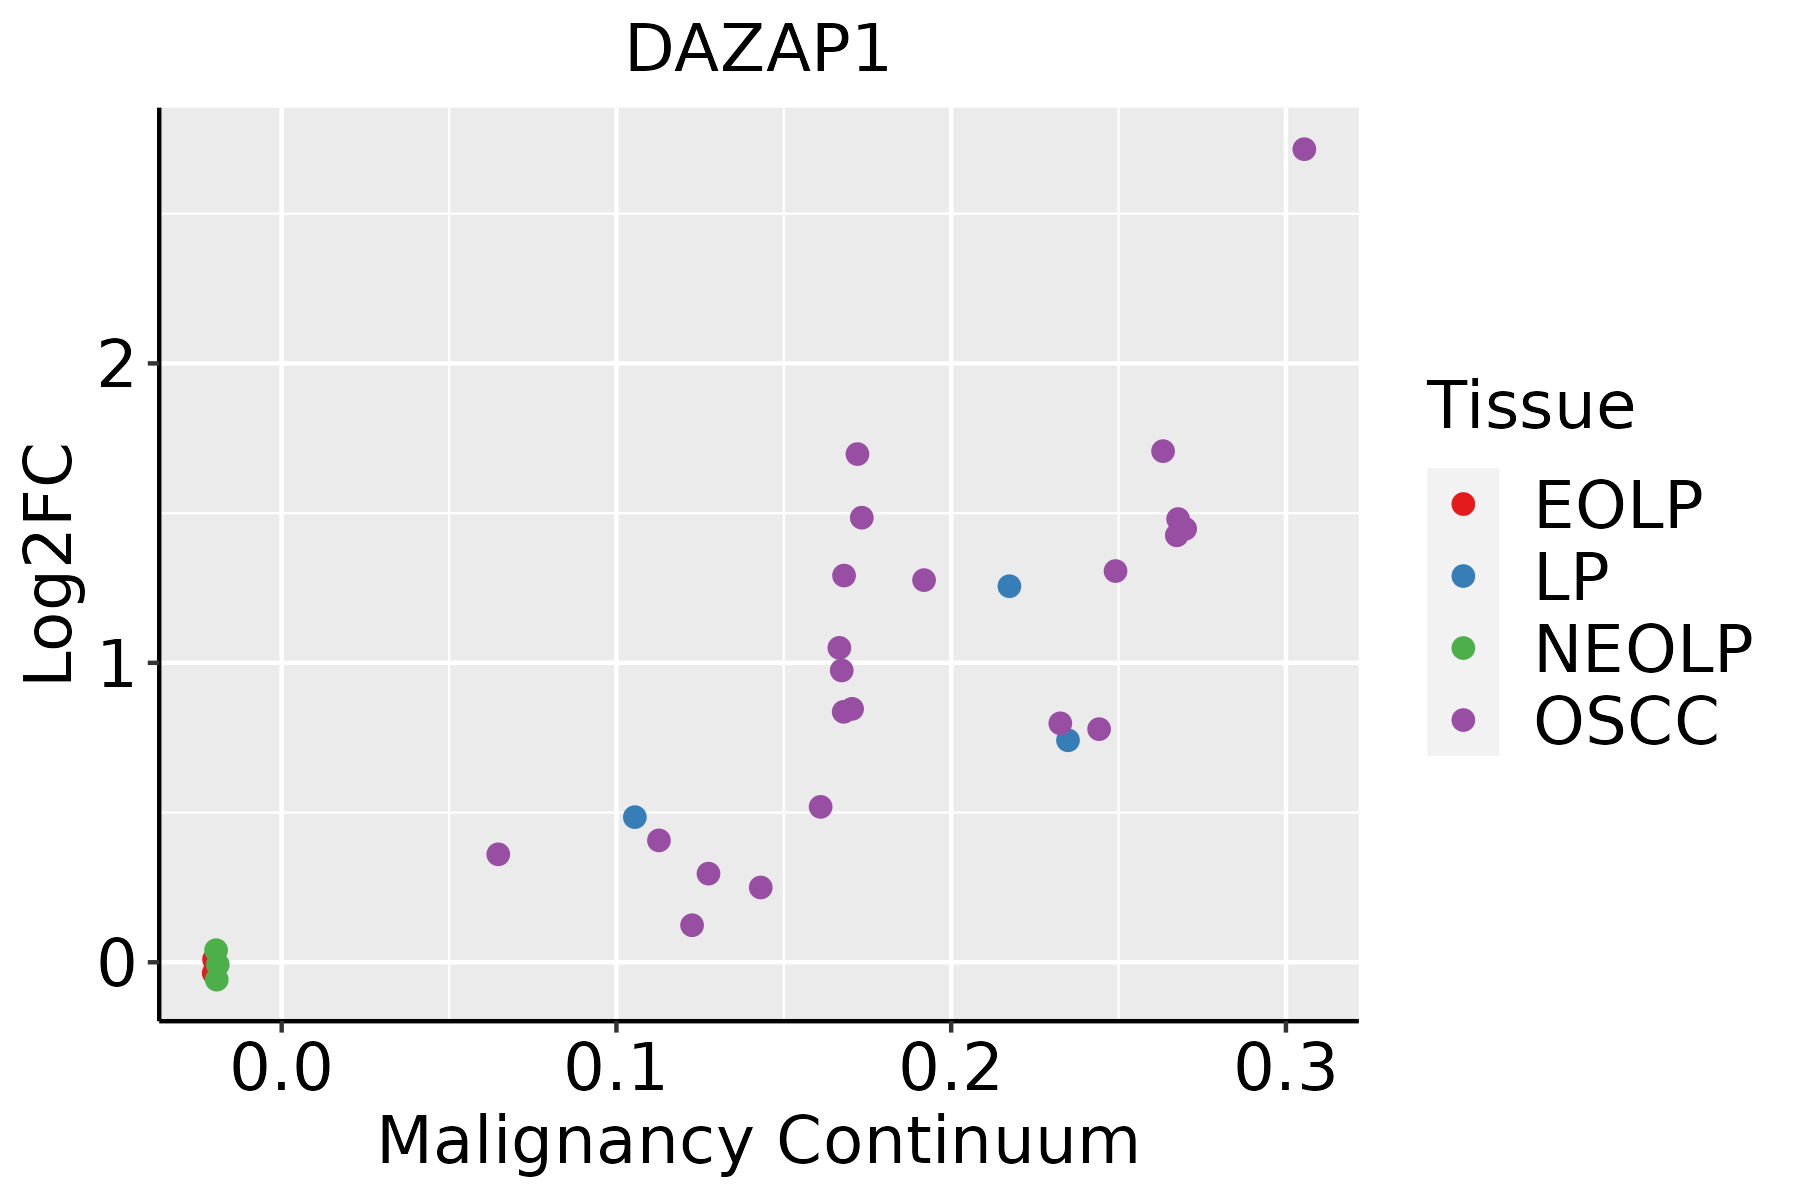 | EOLP: Erosive Oral lichen planus |
| LP: leukoplakia |
| NEOLP: Non-erosive oral lichen planus |
| OSCC: Oral squamous cell carcinoma |
| Skin |  | AK: Actinic keratosis |
| cSCC: Cutaneous squamous cell carcinoma |
| SCCIS:squamous cell carcinoma in situ |
| Thyroid |  | ATC: Anaplastic thyroid cancer |
| HT: Hashimoto's thyroiditis |
| PTC: Papillary thyroid cancer |
| GO ID | Tissue | Disease Stage | Description | Gene Ratio | Bg Ratio | pvalue | p.adjust | Count |
| GO:004348412 | Liver | Cirrhotic | regulation of RNA splicing | 85/4634 | 148/18723 | 2.03e-17 | 2.83e-15 | 85 |
| GO:004802412 | Liver | Cirrhotic | regulation of mRNA splicing, via spliceosome | 62/4634 | 101/18723 | 5.83e-15 | 6.20e-13 | 62 |
| GO:190331311 | Liver | Cirrhotic | positive regulation of mRNA metabolic process | 56/4634 | 118/18723 | 7.05e-08 | 2.14e-06 | 56 |
| GO:00331205 | Liver | Cirrhotic | positive regulation of RNA splicing | 24/4634 | 37/18723 | 2.87e-07 | 7.01e-06 | 24 |
| GO:0050685 | Liver | Cirrhotic | positive regulation of mRNA processing | 20/4634 | 32/18723 | 6.64e-06 | 1.04e-04 | 20 |
| GO:00480265 | Liver | Cirrhotic | positive regulation of mRNA splicing, via spliceosome | 15/4634 | 22/18723 | 2.14e-05 | 2.81e-04 | 15 |
| GO:00018905 | Liver | Cirrhotic | placenta development | 57/4634 | 144/18723 | 5.74e-05 | 6.58e-04 | 57 |
| GO:00614585 | Liver | Cirrhotic | reproductive system development | 132/4634 | 427/18723 | 2.07e-03 | 1.28e-02 | 132 |
| GO:00486085 | Liver | Cirrhotic | reproductive structure development | 131/4634 | 424/18723 | 2.19e-03 | 1.34e-02 | 131 |
| GO:0007565 | Liver | Cirrhotic | female pregnancy | 65/4634 | 193/18723 | 3.21e-03 | 1.80e-02 | 65 |
| GO:00018932 | Liver | Cirrhotic | maternal placenta development | 16/4634 | 35/18723 | 5.53e-03 | 2.80e-02 | 16 |
| GO:0044706 | Liver | Cirrhotic | multi-multicellular organism process | 70/4634 | 220/18723 | 1.03e-02 | 4.61e-02 | 70 |
| GO:0060135 | Liver | Cirrhotic | maternal process involved in female pregnancy | 24/4634 | 62/18723 | 1.03e-02 | 4.61e-02 | 24 |
| GO:000838022 | Liver | HCC | RNA splicing | 313/7958 | 434/18723 | 1.36e-36 | 1.73e-33 | 313 |
| GO:000037522 | Liver | HCC | RNA splicing, via transesterification reactions | 228/7958 | 324/18723 | 1.47e-24 | 4.06e-22 | 228 |
| GO:000037722 | Liver | HCC | RNA splicing, via transesterification reactions with bulged adenosine as nucleophile | 224/7958 | 320/18723 | 1.16e-23 | 2.62e-21 | 224 |
| GO:000039822 | Liver | HCC | mRNA splicing, via spliceosome | 224/7958 | 320/18723 | 1.16e-23 | 2.62e-21 | 224 |
| GO:190331121 | Liver | HCC | regulation of mRNA metabolic process | 205/7958 | 288/18723 | 3.38e-23 | 6.90e-21 | 205 |
| GO:004348422 | Liver | HCC | regulation of RNA splicing | 113/7958 | 148/18723 | 4.32e-17 | 4.15e-15 | 113 |
| GO:005068421 | Liver | HCC | regulation of mRNA processing | 106/7958 | 137/18723 | 7.64e-17 | 7.12e-15 | 106 |
| Pathway ID | Tissue | Disease Stage | Description | Gene Ratio | Bg Ratio | pvalue | p.adjust | qvalue | Count |
| hsa030152 | Colorectum | FAP | mRNA surveillance pathway | 26/1404 | 97/8465 | 7.11e-03 | 2.64e-02 | 1.60e-02 | 26 |
| hsa030153 | Colorectum | FAP | mRNA surveillance pathway | 26/1404 | 97/8465 | 7.11e-03 | 2.64e-02 | 1.60e-02 | 26 |
| hsa030159 | Esophagus | HGIN | mRNA surveillance pathway | 30/1383 | 97/8465 | 2.48e-04 | 2.69e-03 | 2.14e-03 | 30 |
| hsa0301514 | Esophagus | HGIN | mRNA surveillance pathway | 30/1383 | 97/8465 | 2.48e-04 | 2.69e-03 | 2.14e-03 | 30 |
| hsa0301524 | Esophagus | ESCC | mRNA surveillance pathway | 72/4205 | 97/8465 | 6.12e-07 | 4.10e-06 | 2.10e-06 | 72 |
| hsa0301534 | Esophagus | ESCC | mRNA surveillance pathway | 72/4205 | 97/8465 | 6.12e-07 | 4.10e-06 | 2.10e-06 | 72 |
| hsa030154 | Liver | Cirrhotic | mRNA surveillance pathway | 46/2530 | 97/8465 | 1.92e-04 | 1.30e-03 | 8.03e-04 | 46 |
| hsa0301511 | Liver | Cirrhotic | mRNA surveillance pathway | 46/2530 | 97/8465 | 1.92e-04 | 1.30e-03 | 8.03e-04 | 46 |
| hsa0301521 | Liver | HCC | mRNA surveillance pathway | 66/4020 | 97/8465 | 3.16e-05 | 1.88e-04 | 1.04e-04 | 66 |
| hsa0301531 | Liver | HCC | mRNA surveillance pathway | 66/4020 | 97/8465 | 3.16e-05 | 1.88e-04 | 1.04e-04 | 66 |
| hsa030158 | Oral cavity | OSCC | mRNA surveillance pathway | 75/3704 | 97/8465 | 1.30e-11 | 2.01e-10 | 1.02e-10 | 75 |
| hsa0301513 | Oral cavity | OSCC | mRNA surveillance pathway | 75/3704 | 97/8465 | 1.30e-11 | 2.01e-10 | 1.02e-10 | 75 |
| hsa0301523 | Oral cavity | LP | mRNA surveillance pathway | 50/2418 | 97/8465 | 1.39e-06 | 1.50e-05 | 9.66e-06 | 50 |
| hsa0301533 | Oral cavity | LP | mRNA surveillance pathway | 50/2418 | 97/8465 | 1.39e-06 | 1.50e-05 | 9.66e-06 | 50 |
| Hugo Symbol | Variant Class | Variant Classification | dbSNP RS | HGVSc | HGVSp | HGVSp Short | SWISSPROT | BIOTYPE | SIFT | PolyPhen | Tumor Sample Barcode | Tissue | Histology | Sex | Age | Stage | Therapy Types | Drugs | Outcome |
| DAZAP1 | SNV | Missense_Mutation | rs770991534 | c.320N>A | p.Ser107Asn | p.S107N | Q96EP5 | protein_coding | tolerated(0.28) | benign(0.009) | TCGA-AC-A23H-01 | Breast | breast invasive carcinoma | Female | >=65 | I/II | Unknown | Unknown | PD |
| DAZAP1 | insertion | Frame_Shift_Ins | novel | c.801_802insACAGCTGGTGGACACGGCGCCAACC | p.Ser268ThrfsTer167 | p.S268Tfs*167 | Q96EP5 | protein_coding | | | TCGA-A8-A097-01 | Breast | breast invasive carcinoma | Female | >=65 | I/II | Hormone Therapy | tamoxiphen | SD |
| DAZAP1 | insertion | Nonsense_Mutation | novel | c.208_209insTCTAAGGCGAGCGCTGTCTTGATCCTGAATGTTTTCTCATTGAATC | p.Ser70IlefsTer2 | p.S70Ifs*2 | Q96EP5 | protein_coding | | | TCGA-AR-A0TY-01 | Breast | breast invasive carcinoma | Female | <65 | I/II | Unspecific | Paclitaxel | PD |
| DAZAP1 | deletion | Frame_Shift_Del | | c.764delN | p.Pro257ArgfsTer78 | p.P257Rfs*78 | Q96EP5 | protein_coding | | | TCGA-BH-A0HA-01 | Breast | breast invasive carcinoma | Female | <65 | I/II | Unknown | Unknown | SD |
| DAZAP1 | deletion | Frame_Shift_Del | | c.764delN | p.Pro257ArgfsTer78 | p.P257Rfs*78 | Q96EP5 | protein_coding | | | TCGA-E2-A154-01 | Breast | breast invasive carcinoma | Female | >=65 | I/II | Hormone Therapy | arimidex | SD |
| DAZAP1 | SNV | Missense_Mutation | rs771366198 | c.853N>A | p.Gly285Ser | p.G285S | Q96EP5 | protein_coding | tolerated(0.24) | benign(0.001) | TCGA-2W-A8YY-01 | Cervix | cervical & endocervical cancer | Female | <65 | I/II | Chemotherapy | cisplatin | CR |
| DAZAP1 | SNV | Missense_Mutation | novel | c.352N>A | p.Gly118Ser | p.G118S | Q96EP5 | protein_coding | deleterious(0) | probably_damaging(1) | TCGA-C5-A8XK-01 | Cervix | cervical & endocervical cancer | Female | <65 | I/II | Chemotherapy | cisplatin | SD |
| DAZAP1 | SNV | Missense_Mutation | rs771366198 | c.853N>A | p.Gly285Ser | p.G285S | Q96EP5 | protein_coding | tolerated(0.24) | benign(0.001) | TCGA-EK-A2RJ-01 | Cervix | cervical & endocervical cancer | Female | <65 | I/II | Unknown | Unknown | SD |
| DAZAP1 | SNV | Missense_Mutation | novel | c.57N>T | p.Trp19Cys | p.W19C | Q96EP5 | protein_coding | deleterious(0) | probably_damaging(0.999) | TCGA-VS-A9UY-01 | Cervix | cervical & endocervical cancer | Female | <65 | I/II | Chemotherapy | cisplatin | PD |
| DAZAP1 | SNV | Missense_Mutation | | c.920C>T | p.Pro307Leu | p.P307L | Q96EP5 | protein_coding | deleterious(0.03) | benign(0.06) | TCGA-DM-A0X9-01 | Colorectum | colon adenocarcinoma | Female | >=65 | I/II | Unknown | Unknown | SD |


