
|
|||||
|
 | |
| |
| |
| |
| |
| |
|
Gene: DAG1 |
Gene summary for DAG1 |
| Gene information | Species | Human | Gene symbol | DAG1 | Gene ID | 1605 |
| Gene name | dystroglycan 1 | |
| Gene Alias | 156DAG | |
| Cytomap | 3p21.31 | |
| Gene Type | protein-coding | GO ID | GO:0000165 | UniProtAcc | A0A024R2W4 |
Top |
Malignant transformation analysis |
| Identification of the aberrant gene expression in precancerous and cancerous lesions by comparing the gene expression of stem-like cells in diseased tissues with normal stem cells |
| Entrez ID | Symbol | Replicates | Species | Organ | Tissue | Adj P-value | Log2FC | Malignancy |
| 1605 | DAG1 | HTA11_1938_2000001011 | Human | Colorectum | AD | 3.22e-11 | 6.63e-01 | -0.0811 |
| 1605 | DAG1 | HTA11_78_2000001011 | Human | Colorectum | AD | 3.67e-02 | 2.93e-01 | -0.1088 |
| 1605 | DAG1 | HTA11_347_2000001011 | Human | Colorectum | AD | 1.72e-08 | 3.92e-01 | -0.1954 |
| 1605 | DAG1 | HTA11_83_2000001011 | Human | Colorectum | SER | 1.91e-02 | 1.97e-01 | -0.1526 |
| 1605 | DAG1 | HTA11_1391_2000001011 | Human | Colorectum | AD | 3.20e-12 | 6.31e-01 | -0.059 |
| 1605 | DAG1 | HTA11_866_3004761011 | Human | Colorectum | AD | 2.36e-05 | 3.07e-01 | 0.096 |
| 1605 | DAG1 | HTA11_99999970781_79442 | Human | Colorectum | MSS | 5.15e-03 | 3.57e-01 | 0.294 |
| 1605 | DAG1 | HTA11_99999965062_69753 | Human | Colorectum | MSI-H | 4.35e-04 | 9.04e-01 | 0.3487 |
| 1605 | DAG1 | HTA11_99999971662_82457 | Human | Colorectum | MSS | 1.89e-09 | 5.51e-01 | 0.3859 |
| 1605 | DAG1 | A015-C-203 | Human | Colorectum | FAP | 6.70e-04 | -1.37e-01 | -0.1294 |
| 1605 | DAG1 | A015-C-104 | Human | Colorectum | FAP | 4.77e-04 | -1.40e-01 | -0.1899 |
| 1605 | DAG1 | A002-C-016 | Human | Colorectum | FAP | 8.81e-03 | -1.05e-01 | 0.0521 |
| 1605 | DAG1 | A002-C-116 | Human | Colorectum | FAP | 8.22e-03 | -1.01e-01 | -0.0452 |
| 1605 | DAG1 | LZE2T | Human | Esophagus | ESCC | 2.55e-02 | 4.36e-01 | 0.082 |
| 1605 | DAG1 | LZE4T | Human | Esophagus | ESCC | 4.25e-04 | 1.73e-01 | 0.0811 |
| 1605 | DAG1 | LZE7T | Human | Esophagus | ESCC | 4.60e-03 | 4.42e-01 | 0.0667 |
| 1605 | DAG1 | LZE8T | Human | Esophagus | ESCC | 1.12e-02 | 5.43e-02 | 0.067 |
| 1605 | DAG1 | LZE24T | Human | Esophagus | ESCC | 2.33e-11 | 2.82e-01 | 0.0596 |
| 1605 | DAG1 | LZE21T | Human | Esophagus | ESCC | 1.68e-05 | 2.87e-01 | 0.0655 |
| 1605 | DAG1 | P2T-E | Human | Esophagus | ESCC | 3.63e-15 | 2.63e-01 | 0.1177 |
| Page: 1 2 3 4 5 6 7 |
| Tissue | Expression Dynamics | Abbreviation |
| Colorectum (GSE201348) | 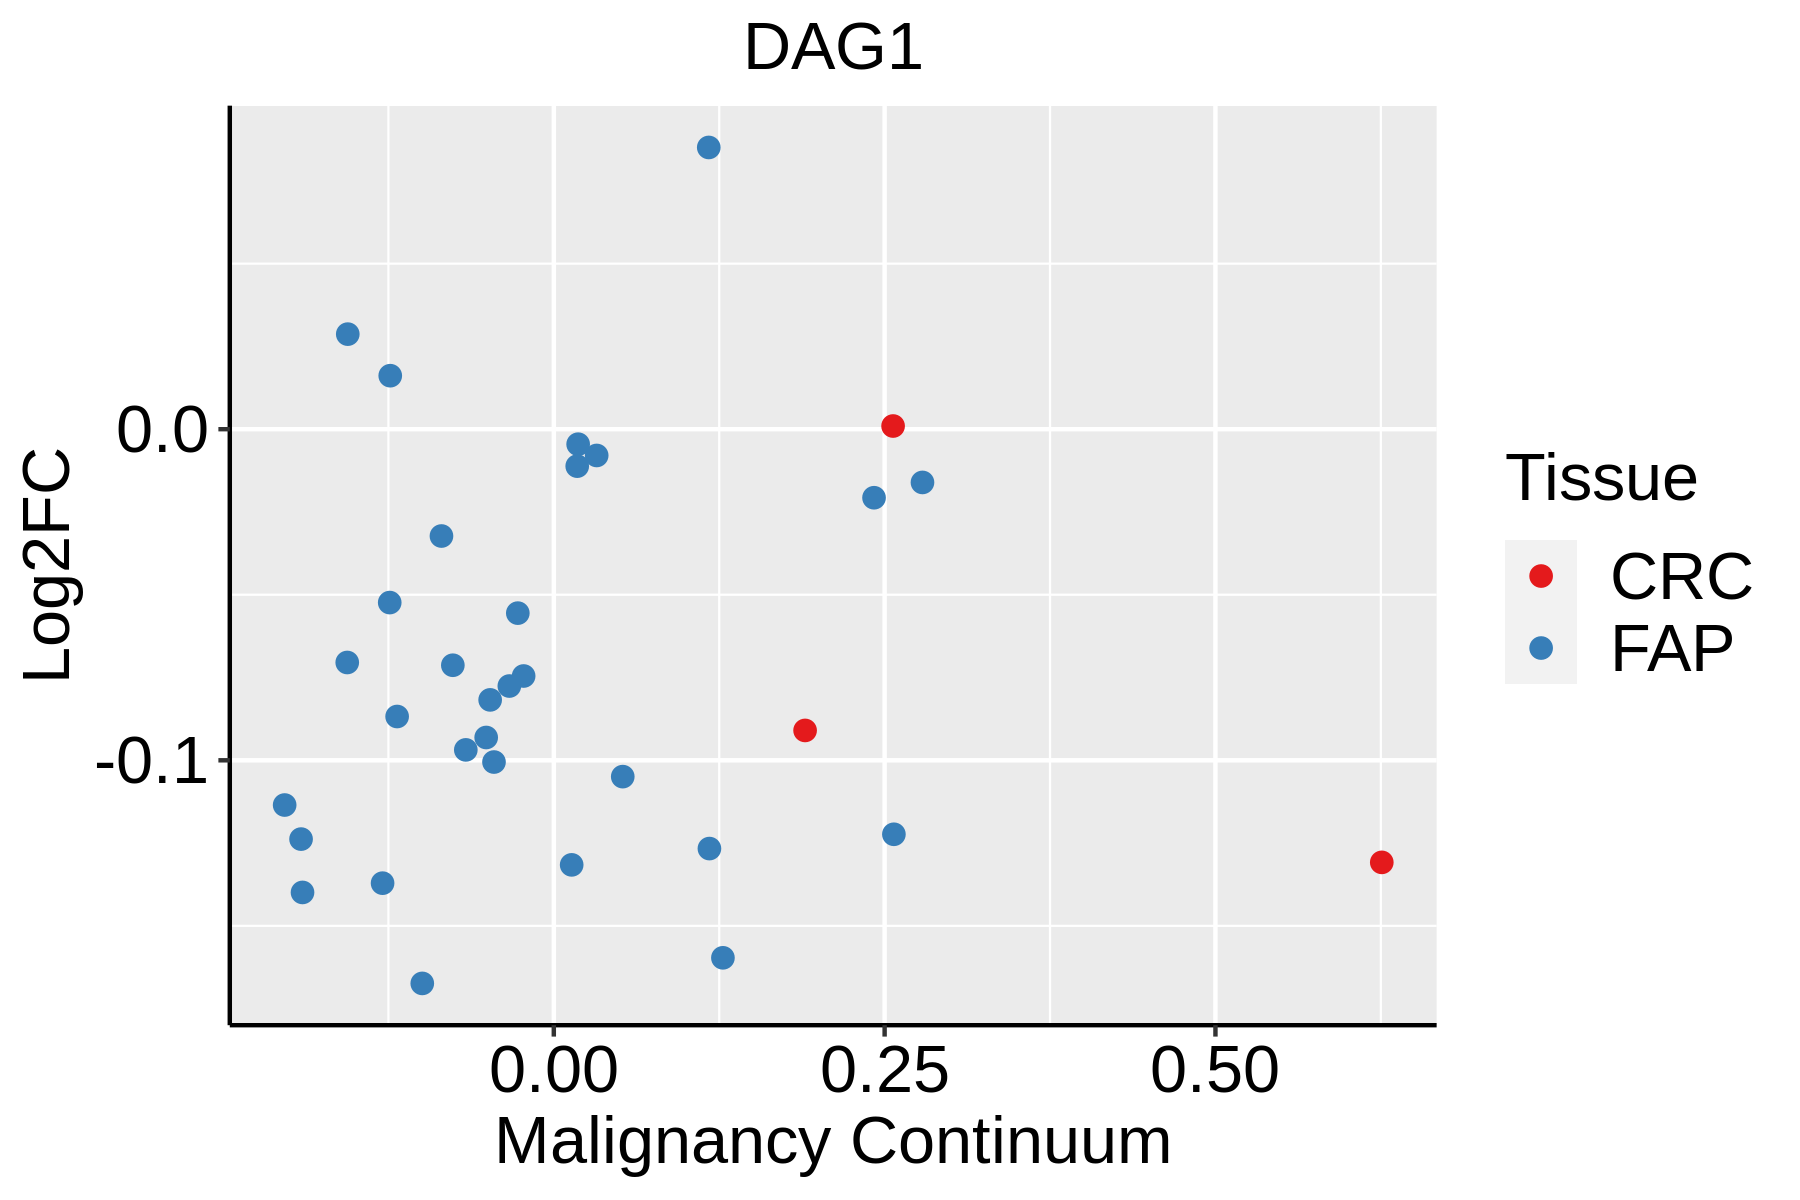 | FAP: Familial adenomatous polyposis |
| CRC: Colorectal cancer | ||
| Colorectum (HTA11) |  | AD: Adenomas |
| SER: Sessile serrated lesions | ||
| MSI-H: Microsatellite-high colorectal cancer | ||
| MSS: Microsatellite stable colorectal cancer | ||
| Esophagus |  | ESCC: Esophageal squamous cell carcinoma |
| HGIN: High-grade intraepithelial neoplasias | ||
| LGIN: Low-grade intraepithelial neoplasias | ||
| Liver |  | HCC: Hepatocellular carcinoma |
| NAFLD: Non-alcoholic fatty liver disease | ||
| Oral Cavity | 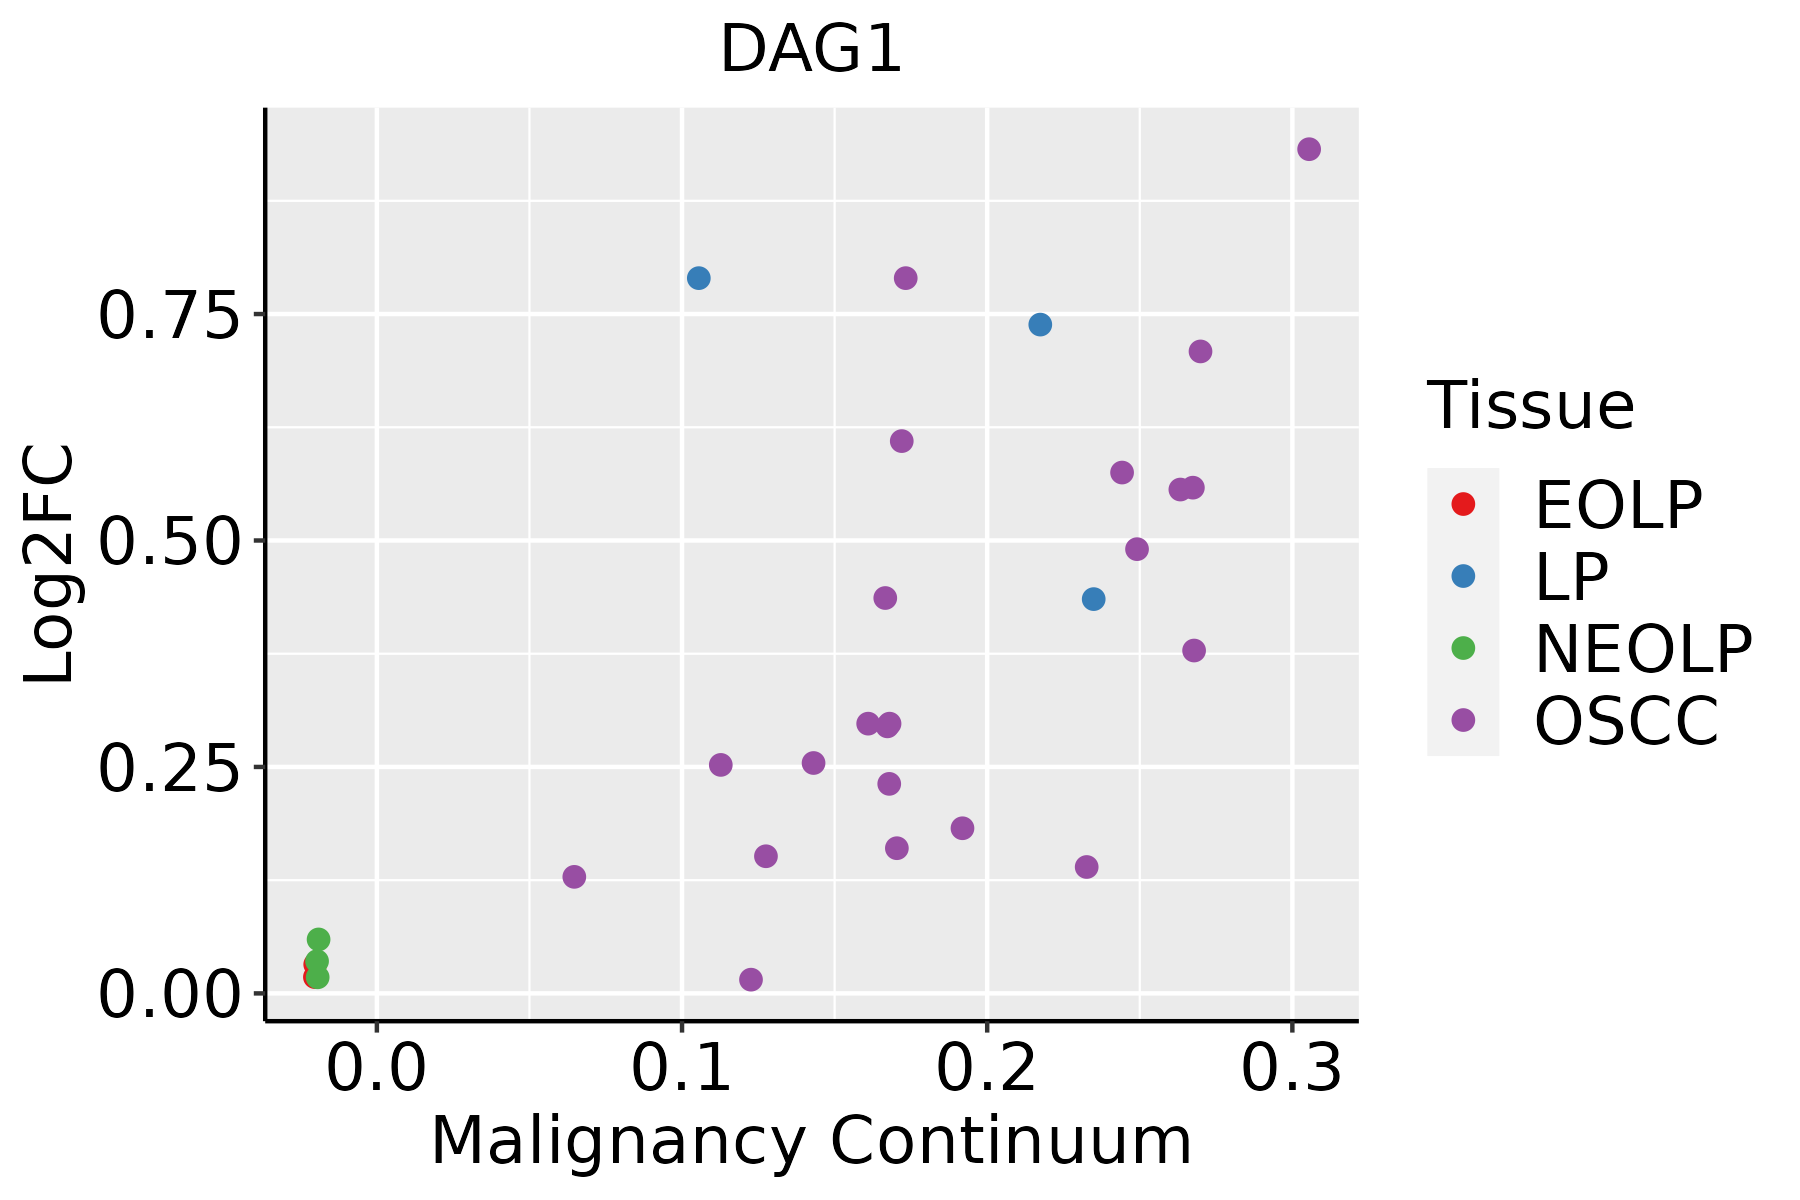 | EOLP: Erosive Oral lichen planus |
| LP: leukoplakia | ||
| NEOLP: Non-erosive oral lichen planus | ||
| OSCC: Oral squamous cell carcinoma | ||
| Prostate | 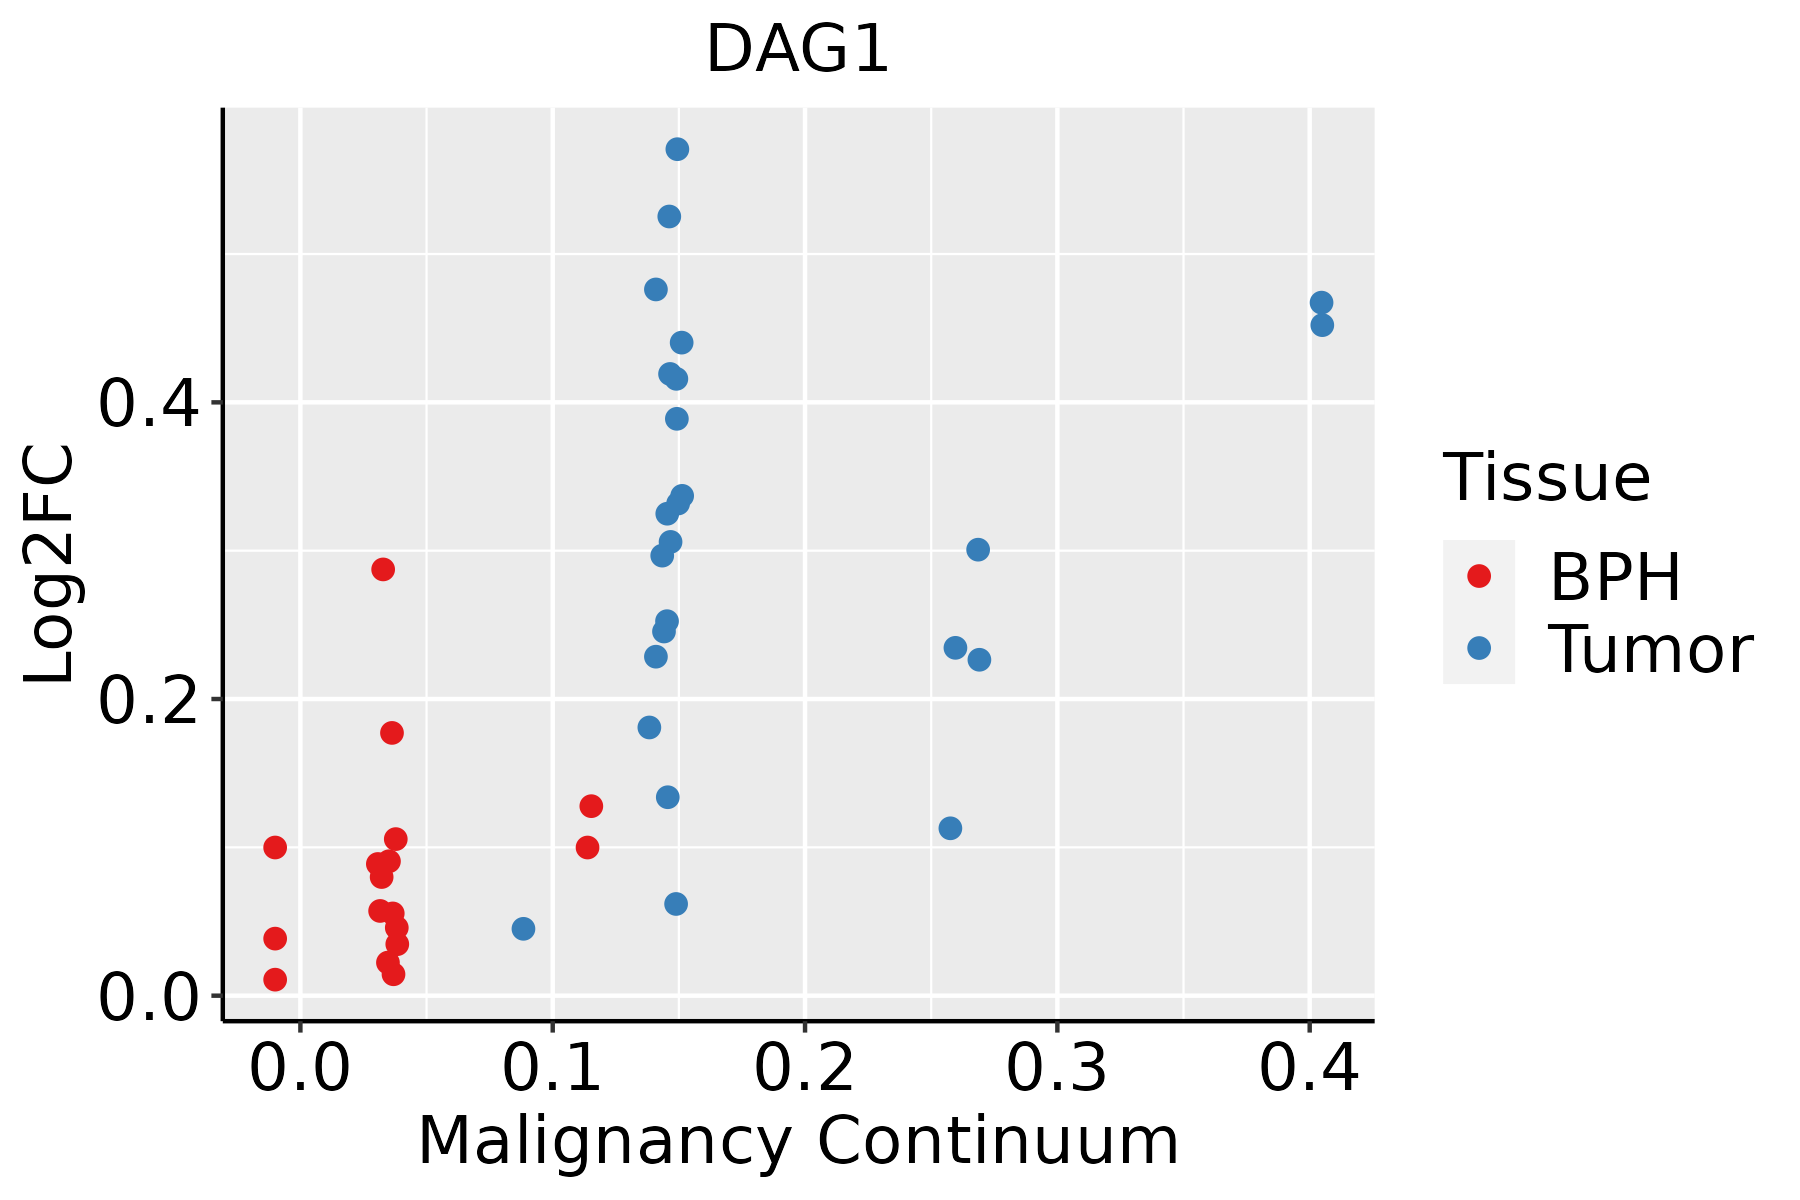 | BPH: Benign Prostatic Hyperplasia |
| Thyroid | 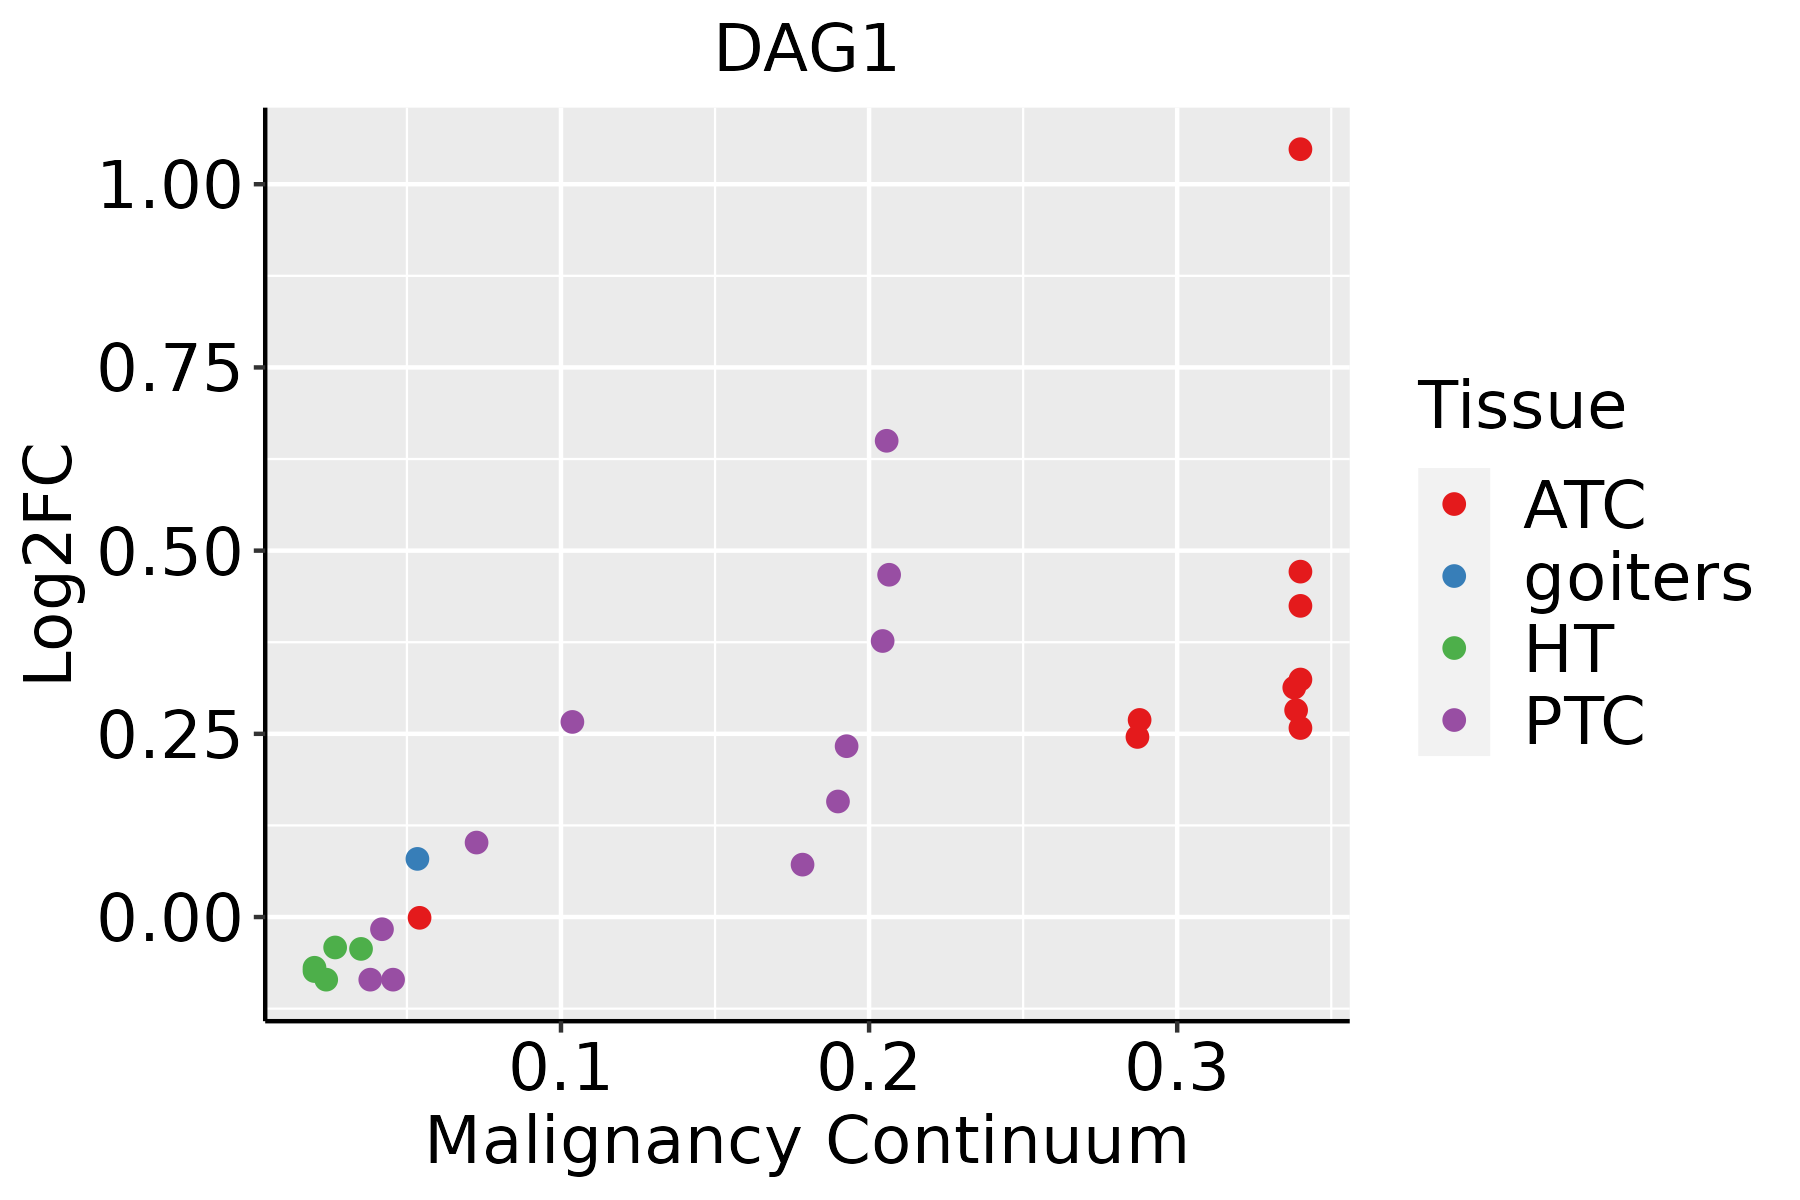 | ATC: Anaplastic thyroid cancer |
| HT: Hashimoto's thyroiditis | ||
| PTC: Papillary thyroid cancer |
| ∗log2FC in expression of this searched gene in stem-like cells from each diseased tissue sample relative to stem-like cells in normal samples in each tissue plotted against the malignancy continuum. Samples are colored based on if they are from different disease stage. |
Top |
Malignant transformation related pathway analysis |
| Find out the enriched GO biological processes and KEGG pathways involved in transition from healthy to precancer to cancer |
| Tissue | Disease Stage | Enriched GO biological Processes |
| Colorectum | AD |  |
| Colorectum | SER |  |
| Colorectum | MSS |  |
| Colorectum | MSI-H |  |
| Colorectum | FAP |  |
| ∗Top 15 enriched GO BP terms are showed in the bar plot of each disease state in each tissue. Each row represents a significant GO biological process which is colored according to the -log10(p.adjust). |
| Page: 1 2 3 4 5 6 7 8 9 |
| GO ID | Tissue | Disease Stage | Description | Gene Ratio | Bg Ratio | pvalue | p.adjust | Count |
| GO:00074111 | Colorectum | SER | axon guidance | 51/2897 | 227/18723 | 3.29e-03 | 2.82e-02 | 51 |
| GO:00073691 | Colorectum | SER | gastrulation | 43/2897 | 185/18723 | 3.44e-03 | 2.92e-02 | 43 |
| GO:00974851 | Colorectum | SER | neuron projection guidance | 51/2897 | 228/18723 | 3.61e-03 | 3.03e-02 | 51 |
| GO:00615641 | Colorectum | SER | axon development | 94/2897 | 467/18723 | 3.78e-03 | 3.13e-02 | 94 |
| GO:00444091 | Colorectum | SER | entry into host | 36/2897 | 151/18723 | 4.55e-03 | 3.61e-02 | 36 |
| GO:00458601 | Colorectum | SER | positive regulation of protein kinase activity | 79/2897 | 386/18723 | 4.85e-03 | 3.79e-02 | 79 |
| GO:00074091 | Colorectum | SER | axonogenesis | 84/2897 | 418/18723 | 6.20e-03 | 4.49e-02 | 84 |
| GO:00226121 | Colorectum | SER | gland morphogenesis | 29/2897 | 118/18723 | 6.54e-03 | 4.68e-02 | 29 |
| GO:0014044 | Colorectum | SER | Schwann cell development | 11/2897 | 32/18723 | 6.58e-03 | 4.68e-02 | 11 |
| GO:00508081 | Colorectum | SER | synapse organization | 85/2897 | 426/18723 | 7.17e-03 | 4.99e-02 | 85 |
| GO:00160322 | Colorectum | MSS | viral process | 157/3467 | 415/18723 | 7.94e-21 | 6.19e-18 | 157 |
| GO:19907782 | Colorectum | MSS | protein localization to cell periphery | 120/3467 | 333/18723 | 2.02e-14 | 5.47e-12 | 120 |
| GO:00487322 | Colorectum | MSS | gland development | 143/3467 | 436/18723 | 3.85e-13 | 8.01e-11 | 143 |
| GO:00190582 | Colorectum | MSS | viral life cycle | 111/3467 | 317/18723 | 1.65e-12 | 2.95e-10 | 111 |
| GO:19054752 | Colorectum | MSS | regulation of protein localization to membrane | 68/3467 | 175/18723 | 2.16e-10 | 2.09e-08 | 68 |
| GO:00226042 | Colorectum | MSS | regulation of cell morphogenesis | 103/3467 | 309/18723 | 2.70e-10 | 2.56e-08 | 103 |
| GO:19043752 | Colorectum | MSS | regulation of protein localization to cell periphery | 51/3467 | 125/18723 | 5.46e-09 | 3.55e-07 | 51 |
| GO:00444032 | Colorectum | MSS | biological process involved in symbiotic interaction | 93/3467 | 290/18723 | 1.72e-08 | 9.85e-07 | 93 |
| GO:00108102 | Colorectum | MSS | regulation of cell-substrate adhesion | 73/3467 | 221/18723 | 1.56e-07 | 7.16e-06 | 73 |
| GO:00108112 | Colorectum | MSS | positive regulation of cell-substrate adhesion | 47/3467 | 123/18723 | 2.28e-07 | 9.79e-06 | 47 |
| Page: 1 2 3 4 5 6 7 8 9 10 11 12 13 14 15 16 17 18 19 20 21 22 23 24 25 26 27 28 29 30 31 32 33 34 35 36 37 38 39 40 |
| Pathway ID | Tissue | Disease Stage | Description | Gene Ratio | Bg Ratio | pvalue | p.adjust | qvalue | Count |
| hsa05416 | Colorectum | MSI-H | Viral myocarditis | 14/797 | 60/8465 | 1.09e-03 | 1.20e-02 | 1.01e-02 | 14 |
| hsa054161 | Colorectum | MSI-H | Viral myocarditis | 14/797 | 60/8465 | 1.09e-03 | 1.20e-02 | 1.01e-02 | 14 |
| hsa05412 | Colorectum | FAP | Arrhythmogenic right ventricular cardiomyopathy | 23/1404 | 77/8465 | 2.58e-03 | 1.19e-02 | 7.23e-03 | 23 |
| hsa054121 | Colorectum | FAP | Arrhythmogenic right ventricular cardiomyopathy | 23/1404 | 77/8465 | 2.58e-03 | 1.19e-02 | 7.23e-03 | 23 |
| hsa0541630 | Esophagus | ESCC | Viral myocarditis | 41/4205 | 60/8465 | 2.59e-03 | 7.05e-03 | 3.61e-03 | 41 |
| hsa05416114 | Esophagus | ESCC | Viral myocarditis | 41/4205 | 60/8465 | 2.59e-03 | 7.05e-03 | 3.61e-03 | 41 |
| hsa0541614 | Liver | Cirrhotic | Viral myocarditis | 28/2530 | 60/8465 | 4.38e-03 | 1.68e-02 | 1.03e-02 | 28 |
| hsa0541615 | Liver | Cirrhotic | Viral myocarditis | 28/2530 | 60/8465 | 4.38e-03 | 1.68e-02 | 1.03e-02 | 28 |
| hsa0541629 | Oral cavity | OSCC | Viral myocarditis | 39/3704 | 60/8465 | 7.13e-04 | 2.09e-03 | 1.07e-03 | 39 |
| hsa05416113 | Oral cavity | OSCC | Viral myocarditis | 39/3704 | 60/8465 | 7.13e-04 | 2.09e-03 | 1.07e-03 | 39 |
| hsa05416210 | Oral cavity | LP | Viral myocarditis | 32/2418 | 60/8465 | 4.55e-05 | 2.91e-04 | 1.88e-04 | 32 |
| hsa0541637 | Oral cavity | LP | Viral myocarditis | 32/2418 | 60/8465 | 4.55e-05 | 2.91e-04 | 1.88e-04 | 32 |
| hsa0541628 | Prostate | Tumor | Viral myocarditis | 24/1791 | 60/8465 | 6.83e-04 | 3.33e-03 | 2.06e-03 | 24 |
| hsa0541636 | Prostate | Tumor | Viral myocarditis | 24/1791 | 60/8465 | 6.83e-04 | 3.33e-03 | 2.06e-03 | 24 |
| Page: 1 |
Top |
Cell-cell communication analysis |
| Identification of potential cell-cell interactions between two cell types and their ligand-receptor pairs for different disease states |
| Ligand | Receptor | LRpair | Pathway | Tissue | Disease Stage |
| LAMA2 | DAG1 | LAMA2_DAG1 | LAMININ | Breast | DCIS |
| LAMA3 | DAG1 | LAMA3_DAG1 | LAMININ | Breast | DCIS |
| LAMA4 | DAG1 | LAMA4_DAG1 | LAMININ | Breast | DCIS |
| LAMB1 | DAG1 | LAMB1_DAG1 | LAMININ | Breast | DCIS |
| LAMB2 | DAG1 | LAMB2_DAG1 | LAMININ | Breast | DCIS |
| LAMC1 | DAG1 | LAMC1_DAG1 | LAMININ | Breast | DCIS |
| HSPG2 | DAG1 | HSPG2_DAG1 | HSPG | Breast | DCIS |
| LAMA2 | DAG1 | LAMA2_DAG1 | LAMININ | Cervix | Precancer |
| LAMA3 | DAG1 | LAMA3_DAG1 | LAMININ | Cervix | Precancer |
| LAMA4 | DAG1 | LAMA4_DAG1 | LAMININ | Cervix | Precancer |
| LAMA5 | DAG1 | LAMA5_DAG1 | LAMININ | Cervix | Precancer |
| LAMB1 | DAG1 | LAMB1_DAG1 | LAMININ | Cervix | Precancer |
| LAMB2 | DAG1 | LAMB2_DAG1 | LAMININ | Cervix | Precancer |
| LAMB3 | DAG1 | LAMB3_DAG1 | LAMININ | Cervix | Precancer |
| LAMC1 | DAG1 | LAMC1_DAG1 | LAMININ | Cervix | Precancer |
| LAMC3 | DAG1 | LAMC3_DAG1 | LAMININ | Cervix | Precancer |
| HSPG2 | DAG1 | HSPG2_DAG1 | HSPG | Cervix | Precancer |
| AGRN | DAG1 | AGRN_DAG1 | AGRN | Cervix | Precancer |
| LAMA2 | DAG1 | LAMA2_DAG1 | LAMININ | CRC | AD |
| LAMA4 | DAG1 | LAMA4_DAG1 | LAMININ | CRC | AD |
| Page: 1 |
Top |
Single-cell gene regulatory network inference analysis |
| Find out the significant the regulons (TFs) and the target genes of each regulon across cell types for different disease states |
| TF | Cell Type | Tissue | Disease Stage | Target Gene | RSS | Regulon Activity |
| ∗The dot plots of a searched regulon are shown for all cell subpopulations in each disease state of each tissue based on the regulon specific score inferred using pySCENIC and by calculating the average expression. |
| Page: 1 |
Top |
Somatic mutation of malignant transformation related genes |
| Annotation of somatic variants for genes involved in malignant transformation |
| Hugo Symbol | Variant Class | Variant Classification | dbSNP RS | HGVSc | HGVSp | HGVSp Short | SWISSPROT | BIOTYPE | SIFT | PolyPhen | Tumor Sample Barcode | Tissue | Histology | Sex | Age | Stage | Therapy Types | Drugs | Outcome |
| DAG1 | insertion | Frame_Shift_Ins | novel | c.273_274insAACCACTG | p.Asp92AsnfsTer45 | p.D92Nfs*45 | Q14118 | protein_coding | TCGA-A8-A091-01 | Breast | breast invasive carcinoma | Female | <65 | I/II | Chemotherapy | 5-fluorouracil | PD | ||
| DAG1 | insertion | Frame_Shift_Ins | novel | c.275_276insATTGCTCAAGTCTAAACCTGCTTTTCTT | p.Asp92GlufsTer41 | p.D92Efs*41 | Q14118 | protein_coding | TCGA-A8-A091-01 | Breast | breast invasive carcinoma | Female | <65 | I/II | Chemotherapy | 5-fluorouracil | PD | ||
| DAG1 | deletion | Frame_Shift_Del | novel | c.1477delN | p.Asn494ThrfsTer13 | p.N494Tfs*13 | Q14118 | protein_coding | TCGA-D8-A27V-01 | Breast | breast invasive carcinoma | Female | <65 | I/II | Hormone Therapy | tamoxiphen | SD | ||
| DAG1 | deletion | Frame_Shift_Del | novel | c.2389delN | p.Pro797LeufsTer46 | p.P797Lfs*46 | Q14118 | protein_coding | TCGA-D8-A27V-01 | Breast | breast invasive carcinoma | Female | <65 | I/II | Hormone Therapy | tamoxiphen | SD | ||
| DAG1 | deletion | Frame_Shift_Del | novel | c.836delN | p.Pro280LeufsTer103 | p.P280Lfs*103 | Q14118 | protein_coding | TCGA-EW-A2FV-01 | Breast | breast invasive carcinoma | Female | <65 | III/IV | Chemotherapy | docetaxel | SD | ||
| DAG1 | SNV | Missense_Mutation | novel | c.592G>A | p.Asp198Asn | p.D198N | Q14118 | protein_coding | deleterious(0.02) | probably_damaging(0.989) | TCGA-2W-A8YY-01 | Cervix | cervical & endocervical cancer | Female | <65 | I/II | Chemotherapy | cisplatin | CR |
| DAG1 | SNV | Missense_Mutation | rs562046526 | c.643C>T | p.Arg215Trp | p.R215W | Q14118 | protein_coding | deleterious(0) | benign(0.402) | TCGA-IR-A3LA-01 | Cervix | cervical & endocervical cancer | Female | <65 | I/II | Chemotherapy | cisplatin | CR |
| DAG1 | SNV | Missense_Mutation | rs752984606 | c.1118N>A | p.Arg373Gln | p.R373Q | Q14118 | protein_coding | deleterious(0.04) | probably_damaging(0.986) | TCGA-Q1-A5R2-01 | Cervix | cervical & endocervical cancer | Female | <65 | I/II | Chemotherapy | cisplatin | PR |
| DAG1 | SNV | Missense_Mutation | c.266C>T | p.Ser89Phe | p.S89F | Q14118 | protein_coding | tolerated(0.22) | possibly_damaging(0.731) | TCGA-A6-5661-01 | Colorectum | colon adenocarcinoma | Female | >=65 | I/II | Unknown | Unknown | SD | |
| DAG1 | SNV | Missense_Mutation | c.2666N>A | p.Pro889His | p.P889H | Q14118 | protein_coding | deleterious(0) | probably_damaging(1) | TCGA-AA-3663-01 | Colorectum | colon adenocarcinoma | Male | <65 | I/II | Unknown | Unknown | SD |
| Page: 1 2 3 4 5 6 7 8 |
Top |
Related drugs of malignant transformation related genes |
| Identification of chemicals and drugs interact with genes involved in malignant transfromation |
| (DGIdb 4.0) |
| Entrez ID | Symbol | Category | Interaction Types | Drug Claim Name | Drug Name | PMIDs |
| Page: 1 |

Copyright 2023-Present -The University of Texas Health Science Center at Houston |