
|
|||||
|
 | |
| |
| |
| |
| |
| |
|
Gene: CTR9 |
Gene summary for CTR9 |
| Gene information | Species | Human | Gene symbol | CTR9 | Gene ID | 9646 |
| Gene name | CTR9 homolog, Paf1/RNA polymerase II complex component | |
| Gene Alias | SH2BP1 | |
| Cytomap | 11p15.4 | |
| Gene Type | protein-coding | GO ID | GO:0000122 | UniProtAcc | Q6PD62 |
Top |
Malignant transformation analysis |
| Identification of the aberrant gene expression in precancerous and cancerous lesions by comparing the gene expression of stem-like cells in diseased tissues with normal stem cells |
| Entrez ID | Symbol | Replicates | Species | Organ | Tissue | Adj P-value | Log2FC | Malignancy |
| 9646 | CTR9 | LZE4T | Human | Esophagus | ESCC | 3.11e-08 | 3.17e-01 | 0.0811 |
| 9646 | CTR9 | LZE7T | Human | Esophagus | ESCC | 2.34e-10 | 2.08e-01 | 0.0667 |
| 9646 | CTR9 | LZE8T | Human | Esophagus | ESCC | 1.53e-04 | -8.57e-02 | 0.067 |
| 9646 | CTR9 | LZE20T | Human | Esophagus | ESCC | 1.17e-02 | 4.91e-02 | 0.0662 |
| 9646 | CTR9 | LZE22T | Human | Esophagus | ESCC | 1.05e-02 | 2.73e-02 | 0.068 |
| 9646 | CTR9 | LZE24T | Human | Esophagus | ESCC | 1.63e-13 | 3.91e-01 | 0.0596 |
| 9646 | CTR9 | LZE21T | Human | Esophagus | ESCC | 3.49e-03 | 9.21e-04 | 0.0655 |
| 9646 | CTR9 | P1T-E | Human | Esophagus | ESCC | 5.18e-07 | 1.12e-01 | 0.0875 |
| 9646 | CTR9 | P2T-E | Human | Esophagus | ESCC | 3.63e-18 | 4.19e-01 | 0.1177 |
| 9646 | CTR9 | P4T-E | Human | Esophagus | ESCC | 7.03e-18 | 3.32e-01 | 0.1323 |
| 9646 | CTR9 | P5T-E | Human | Esophagus | ESCC | 5.15e-08 | 5.54e-02 | 0.1327 |
| 9646 | CTR9 | P8T-E | Human | Esophagus | ESCC | 1.34e-21 | 4.24e-02 | 0.0889 |
| 9646 | CTR9 | P9T-E | Human | Esophagus | ESCC | 1.19e-19 | 2.79e-01 | 0.1131 |
| 9646 | CTR9 | P10T-E | Human | Esophagus | ESCC | 2.05e-16 | 2.87e-01 | 0.116 |
| 9646 | CTR9 | P11T-E | Human | Esophagus | ESCC | 3.35e-11 | 7.81e-01 | 0.1426 |
| 9646 | CTR9 | P12T-E | Human | Esophagus | ESCC | 5.41e-17 | 4.99e-02 | 0.1122 |
| 9646 | CTR9 | P15T-E | Human | Esophagus | ESCC | 2.29e-22 | 5.11e-01 | 0.1149 |
| 9646 | CTR9 | P16T-E | Human | Esophagus | ESCC | 1.81e-16 | 2.88e-01 | 0.1153 |
| 9646 | CTR9 | P17T-E | Human | Esophagus | ESCC | 9.99e-06 | 1.90e-01 | 0.1278 |
| 9646 | CTR9 | P20T-E | Human | Esophagus | ESCC | 1.17e-15 | 2.89e-01 | 0.1124 |
| Page: 1 2 3 4 5 6 |
| Tissue | Expression Dynamics | Abbreviation |
| Esophagus | 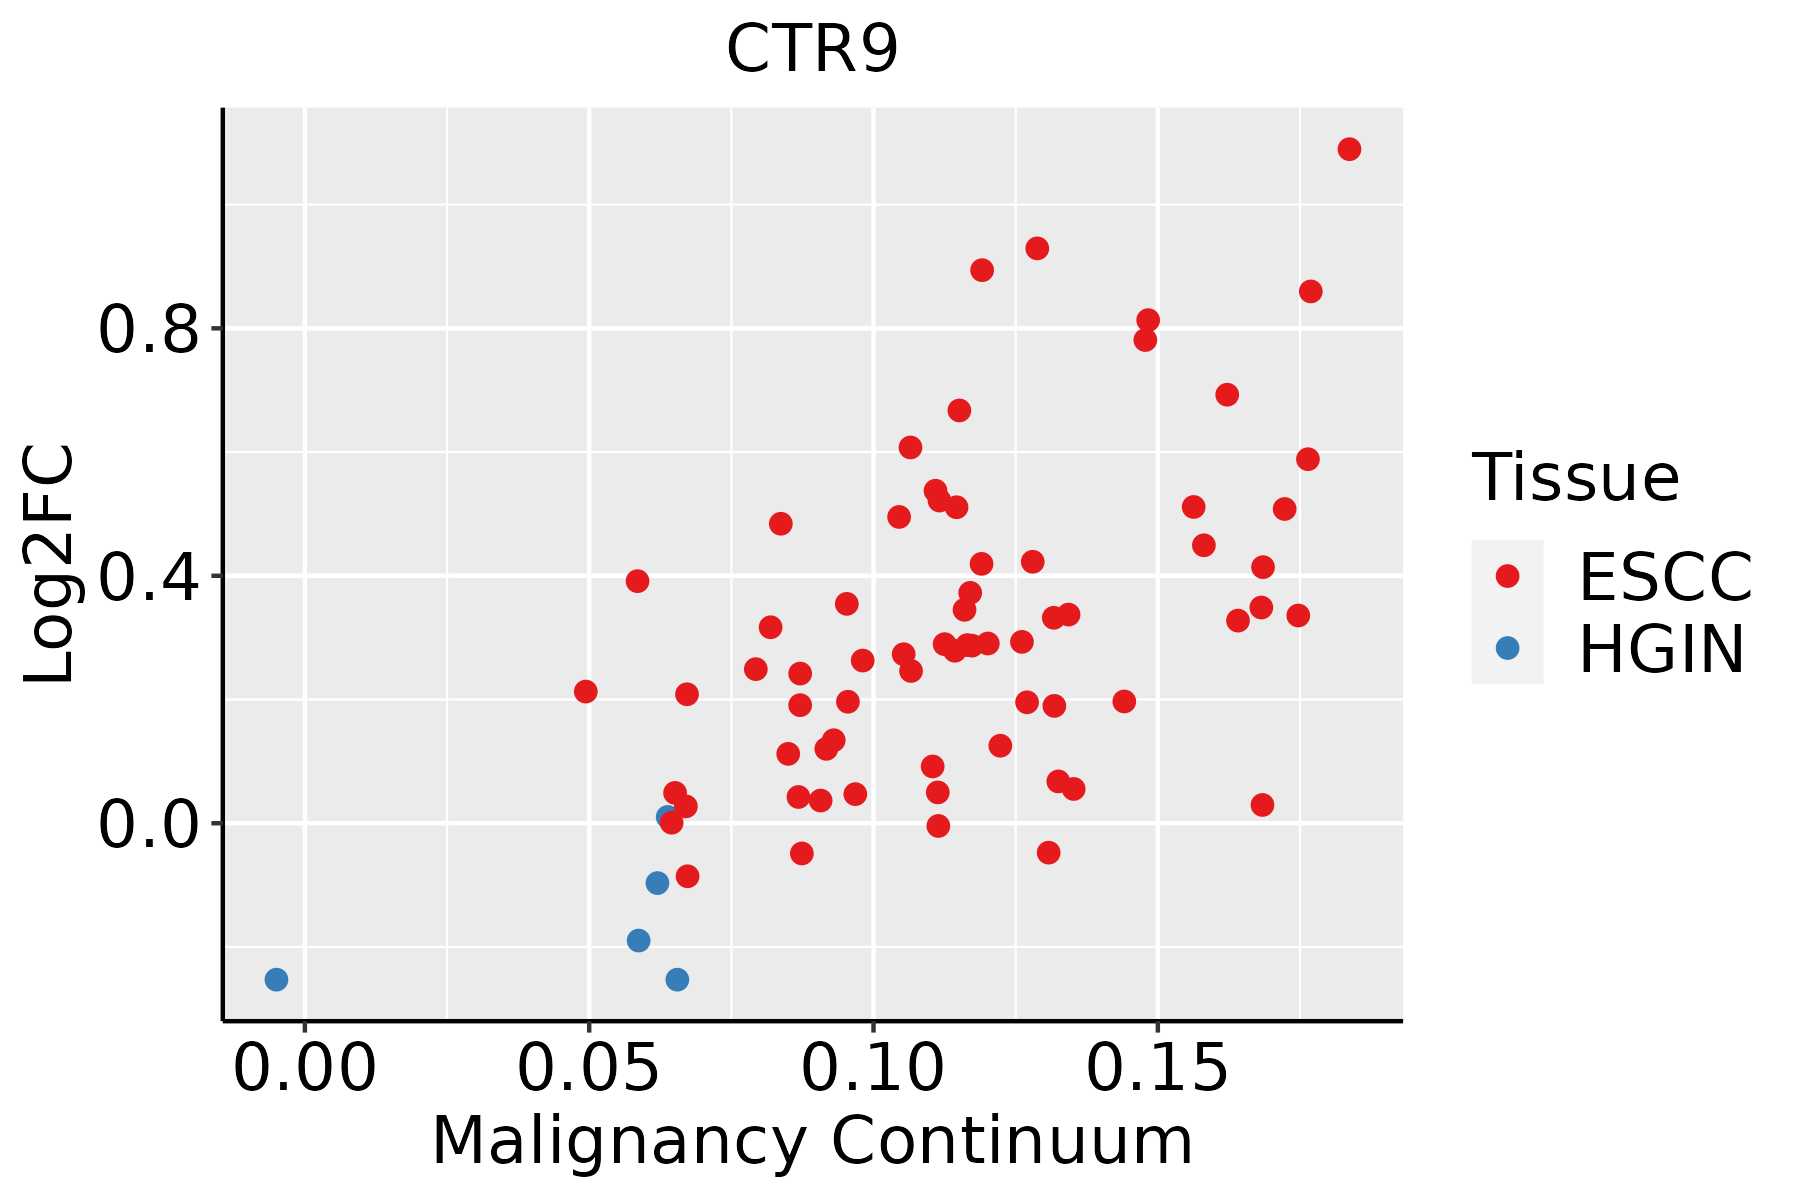 | ESCC: Esophageal squamous cell carcinoma |
| HGIN: High-grade intraepithelial neoplasias | ||
| LGIN: Low-grade intraepithelial neoplasias | ||
| Liver | 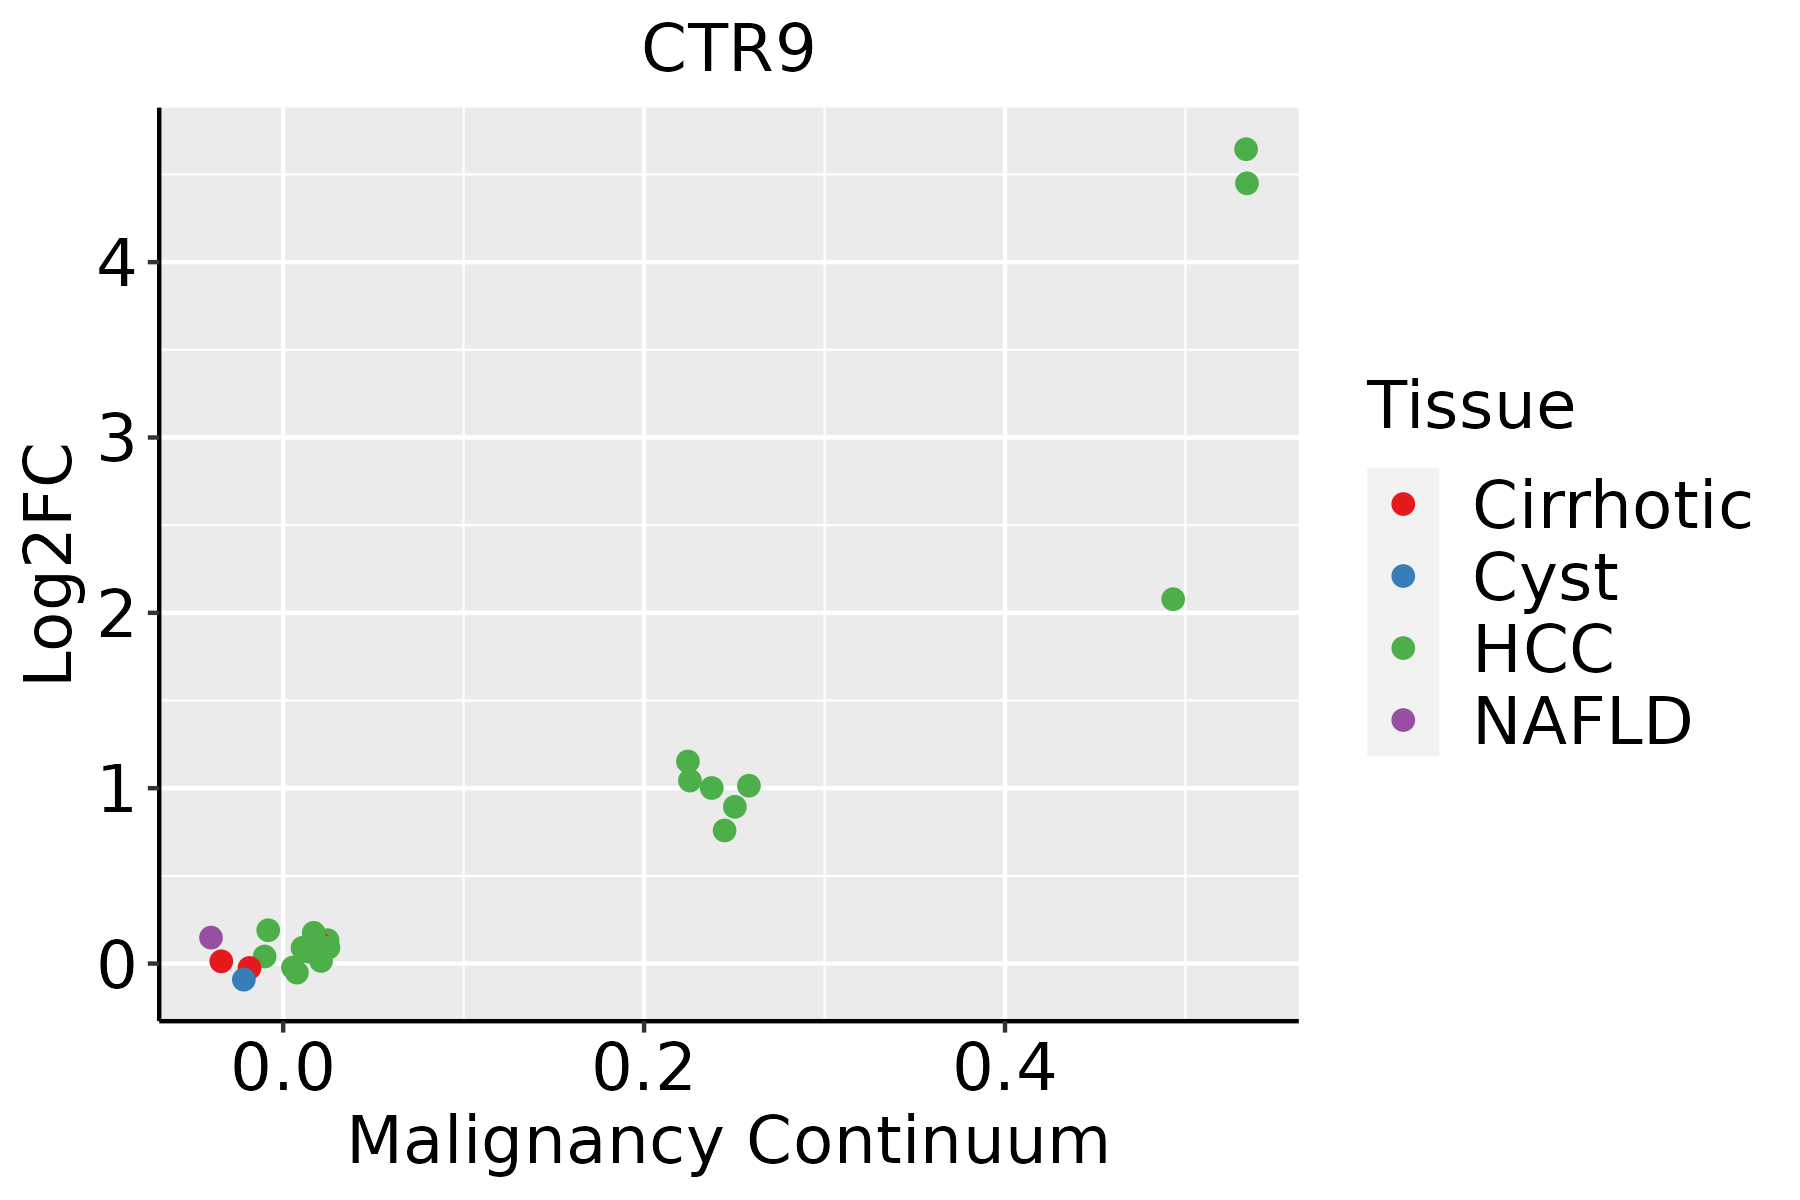 | HCC: Hepatocellular carcinoma |
| NAFLD: Non-alcoholic fatty liver disease | ||
| Oral Cavity | 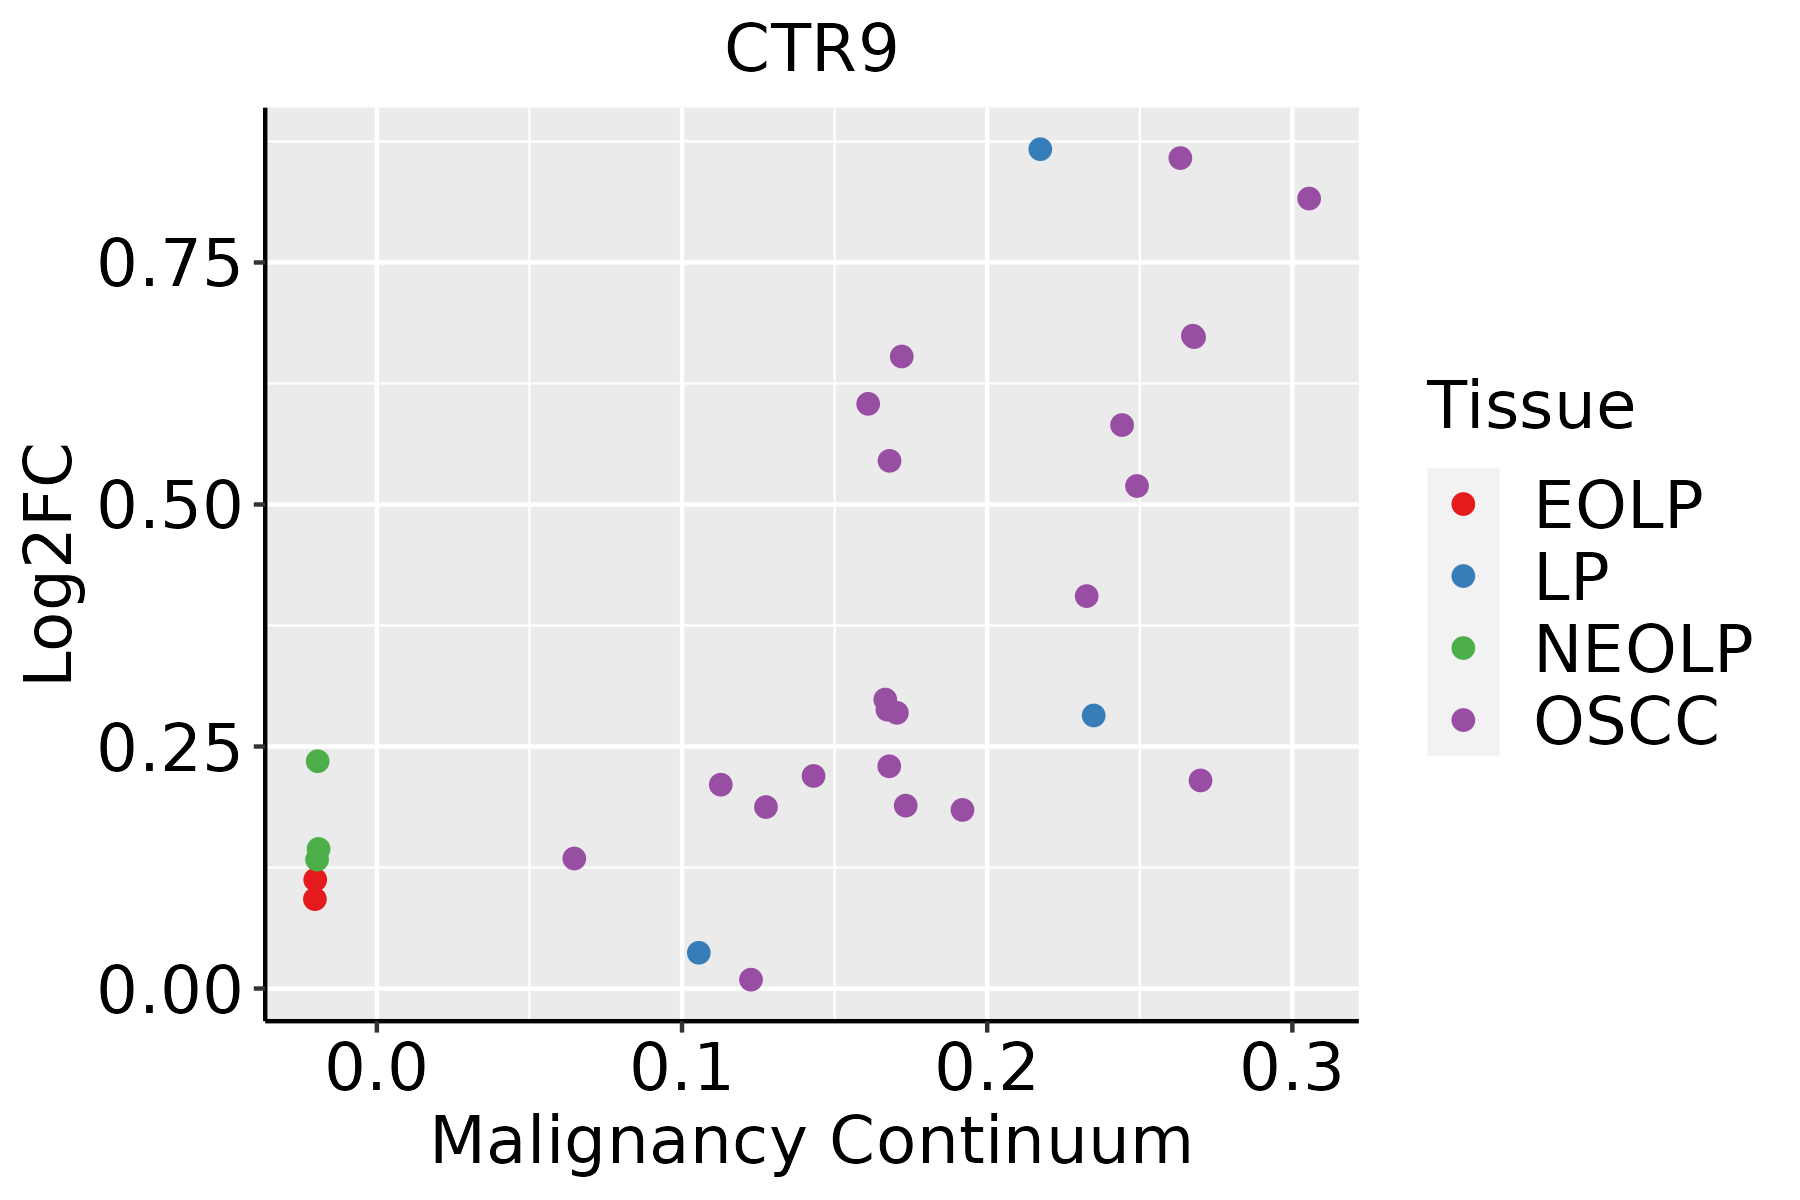 | EOLP: Erosive Oral lichen planus |
| LP: leukoplakia | ||
| NEOLP: Non-erosive oral lichen planus | ||
| OSCC: Oral squamous cell carcinoma | ||
| Prostate | 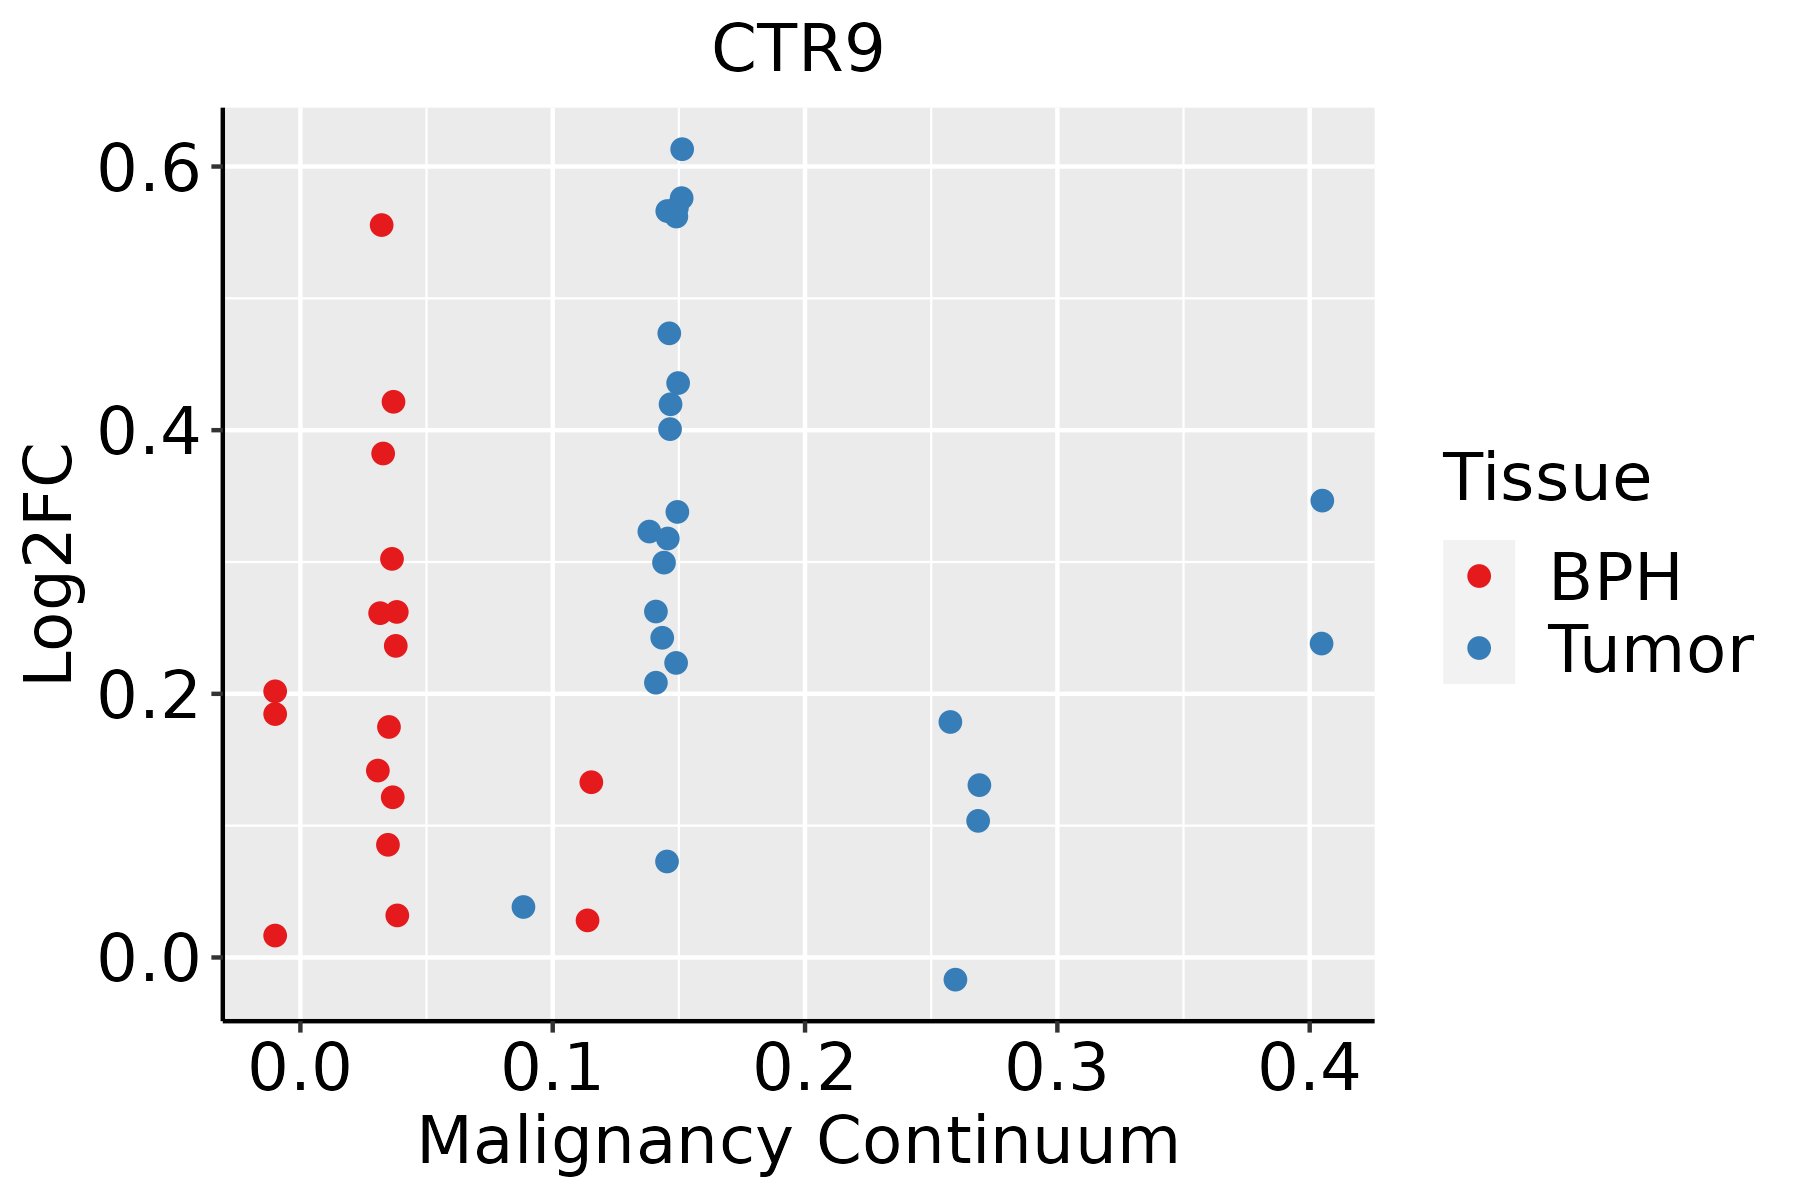 | BPH: Benign Prostatic Hyperplasia |
| Skin | 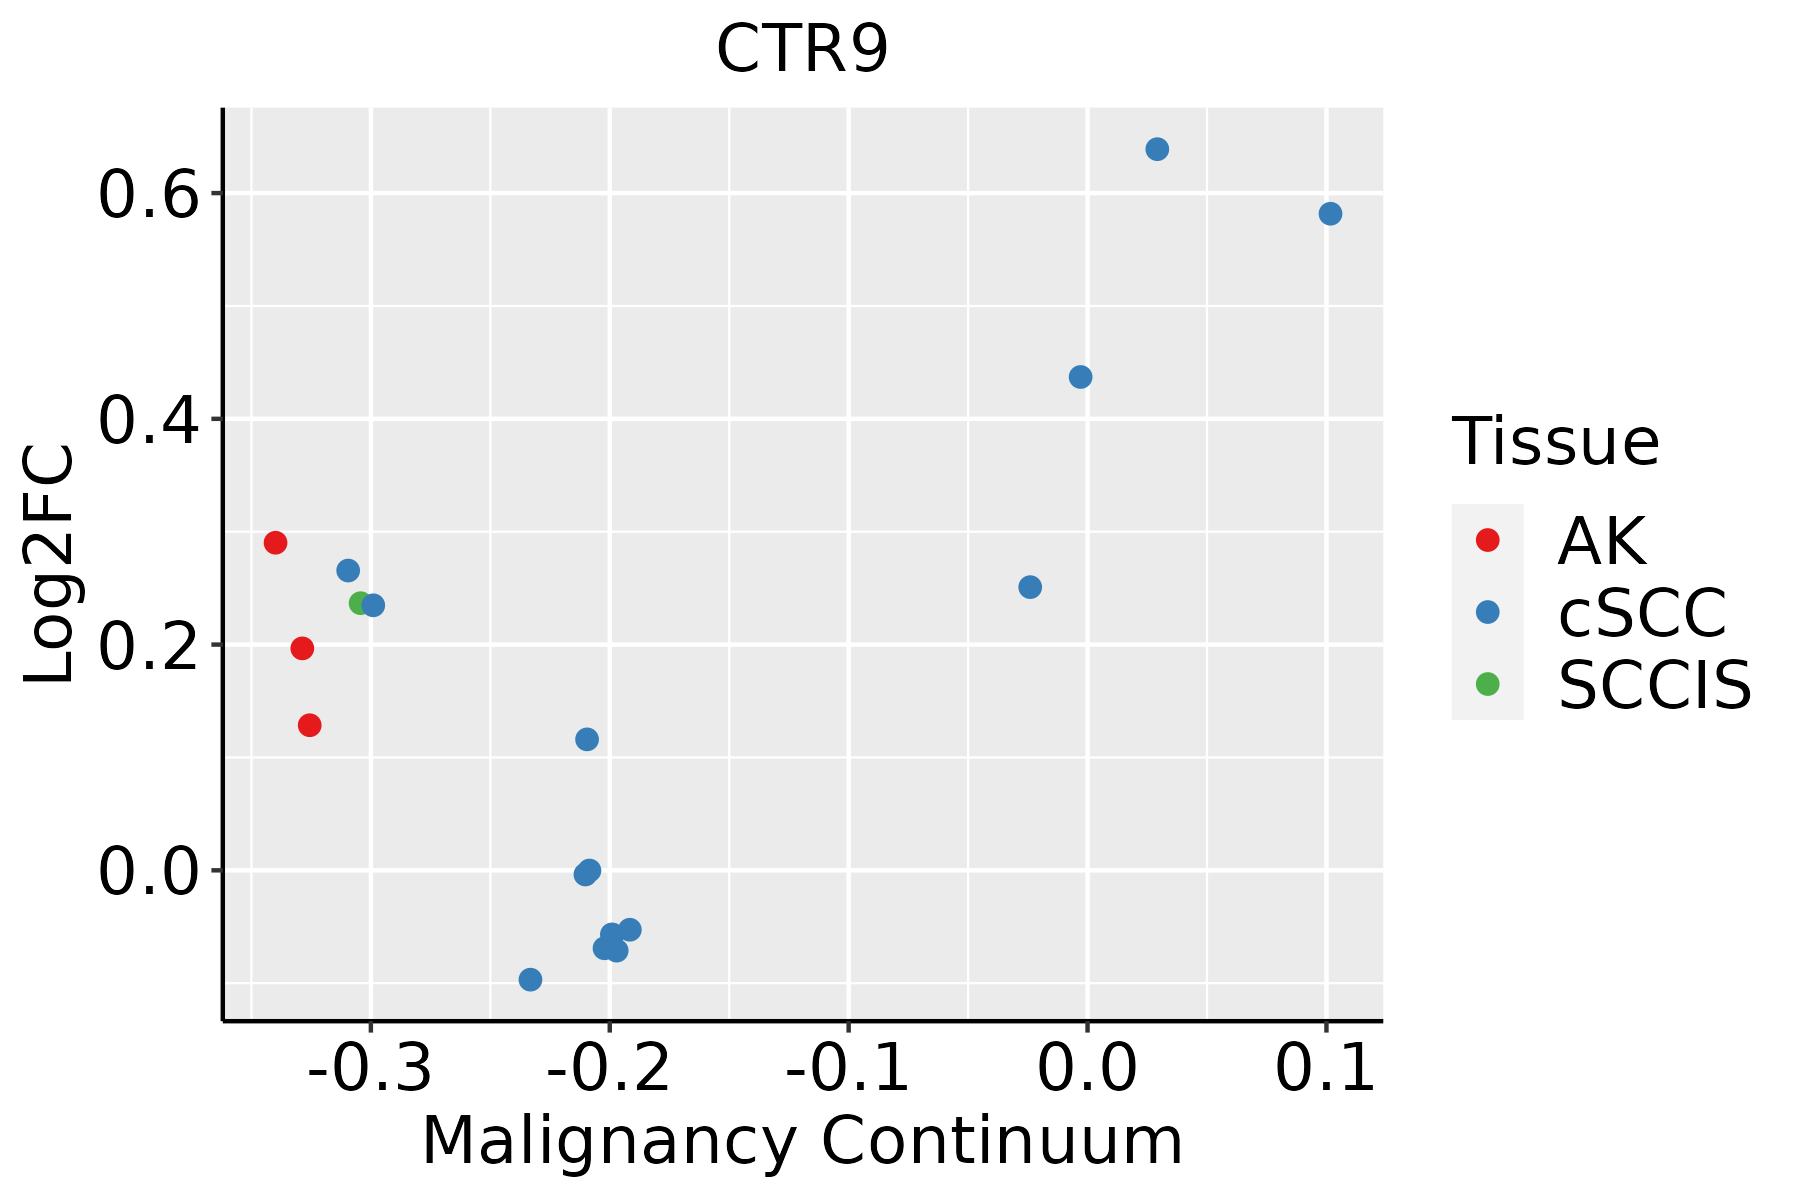 | AK: Actinic keratosis |
| cSCC: Cutaneous squamous cell carcinoma | ||
| SCCIS:squamous cell carcinoma in situ |
| ∗log2FC in expression of this searched gene in stem-like cells from each diseased tissue sample relative to stem-like cells in normal samples in each tissue plotted against the malignancy continuum. Samples are colored based on if they are from different disease stage. |
Top |
Malignant transformation related pathway analysis |
| Find out the enriched GO biological processes and KEGG pathways involved in transition from healthy to precancer to cancer |
| Tissue | Disease Stage | Enriched GO biological Processes |
| Colorectum | AD |  |
| Colorectum | SER |  |
| Colorectum | MSS |  |
| Colorectum | MSI-H |  |
| Colorectum | FAP |  |
| ∗Top 15 enriched GO BP terms are showed in the bar plot of each disease state in each tissue. Each row represents a significant GO biological process which is colored according to the -log10(p.adjust). |
| Page: 1 2 3 4 5 6 7 8 9 |
| GO ID | Tissue | Disease Stage | Description | Gene Ratio | Bg Ratio | pvalue | p.adjust | Count |
| GO:00064791 | Liver | Cirrhotic | protein methylation | 61/4634 | 181/18723 | 4.13e-03 | 2.21e-02 | 61 |
| GO:00082131 | Liver | Cirrhotic | protein alkylation | 61/4634 | 181/18723 | 4.13e-03 | 2.21e-02 | 61 |
| GO:00165711 | Liver | Cirrhotic | histone methylation | 49/4634 | 141/18723 | 4.90e-03 | 2.56e-02 | 49 |
| GO:0031124 | Liver | Cirrhotic | mRNA 3'-end processing | 25/4634 | 62/18723 | 4.90e-03 | 2.56e-02 | 25 |
| GO:0001825 | Liver | Cirrhotic | blastocyst formation | 17/4634 | 38/18723 | 5.62e-03 | 2.84e-02 | 17 |
| GO:0031060 | Liver | Cirrhotic | regulation of histone methylation | 27/4634 | 69/18723 | 5.74e-03 | 2.88e-02 | 27 |
| GO:00456377 | Liver | Cirrhotic | regulation of myeloid cell differentiation | 68/4634 | 210/18723 | 7.40e-03 | 3.53e-02 | 68 |
| GO:00065133 | Liver | Cirrhotic | protein monoubiquitination | 26/4634 | 67/18723 | 7.53e-03 | 3.57e-02 | 26 |
| GO:0007492 | Liver | Cirrhotic | endoderm development | 29/4634 | 77/18723 | 8.02e-03 | 3.76e-02 | 29 |
| GO:190331121 | Liver | HCC | regulation of mRNA metabolic process | 205/7958 | 288/18723 | 3.38e-23 | 6.90e-21 | 205 |
| GO:190332022 | Liver | HCC | regulation of protein modification by small protein conjugation or removal | 167/7958 | 242/18723 | 4.99e-17 | 4.72e-15 | 167 |
| GO:005068421 | Liver | HCC | regulation of mRNA processing | 106/7958 | 137/18723 | 7.64e-17 | 7.12e-15 | 106 |
| GO:001657021 | Liver | HCC | histone modification | 283/7958 | 463/18723 | 2.68e-16 | 2.33e-14 | 283 |
| GO:003139622 | Liver | HCC | regulation of protein ubiquitination | 142/7958 | 210/18723 | 1.39e-13 | 7.81e-12 | 142 |
| GO:00182052 | Liver | HCC | peptidyl-lysine modification | 230/7958 | 376/18723 | 1.51e-13 | 8.32e-12 | 230 |
| GO:00311241 | Liver | HCC | mRNA 3'-end processing | 50/7958 | 62/18723 | 8.44e-10 | 2.60e-08 | 50 |
| GO:19033221 | Liver | HCC | positive regulation of protein modification by small protein conjugation or removal | 94/7958 | 138/18723 | 9.87e-10 | 3.01e-08 | 94 |
| GO:00311231 | Liver | HCC | RNA 3'-end processing | 81/7958 | 116/18723 | 2.27e-09 | 6.32e-08 | 81 |
| GO:005068611 | Liver | HCC | negative regulation of mRNA processing | 27/7958 | 29/18723 | 1.28e-08 | 3.14e-07 | 27 |
| GO:003105621 | Liver | HCC | regulation of histone modification | 99/7958 | 152/18723 | 1.40e-08 | 3.40e-07 | 99 |
| Page: 1 2 3 4 5 6 7 8 9 10 11 12 13 14 15 16 17 18 19 |
| Pathway ID | Tissue | Disease Stage | Description | Gene Ratio | Bg Ratio | pvalue | p.adjust | qvalue | Count |
| Page: 1 |
Top |
Cell-cell communication analysis |
| Identification of potential cell-cell interactions between two cell types and their ligand-receptor pairs for different disease states |
| Ligand | Receptor | LRpair | Pathway | Tissue | Disease Stage |
| Page: 1 |
Top |
Single-cell gene regulatory network inference analysis |
| Find out the significant the regulons (TFs) and the target genes of each regulon across cell types for different disease states |
| TF | Cell Type | Tissue | Disease Stage | Target Gene | RSS | Regulon Activity |
| ∗The dot plots of a searched regulon are shown for all cell subpopulations in each disease state of each tissue based on the regulon specific score inferred using pySCENIC and by calculating the average expression. |
| Page: 1 |
Top |
Somatic mutation of malignant transformation related genes |
| Annotation of somatic variants for genes involved in malignant transformation |
| Hugo Symbol | Variant Class | Variant Classification | dbSNP RS | HGVSc | HGVSp | HGVSp Short | SWISSPROT | BIOTYPE | SIFT | PolyPhen | Tumor Sample Barcode | Tissue | Histology | Sex | Age | Stage | Therapy Types | Drugs | Outcome |
| CTR9 | SNV | Missense_Mutation | c.2140C>G | p.His714Asp | p.H714D | Q6PD62 | protein_coding | deleterious(0.02) | benign(0.003) | TCGA-A8-A06O-01 | Breast | breast invasive carcinoma | Female | <65 | I/II | Hormone Therapy | letrozole | SD | |
| CTR9 | SNV | Missense_Mutation | c.493N>A | p.Ala165Thr | p.A165T | Q6PD62 | protein_coding | deleterious(0.01) | probably_damaging(0.943) | TCGA-AR-A0TZ-01 | Breast | breast invasive carcinoma | Female | <65 | III/IV | Unspecific | Doxorubicin | PD | |
| CTR9 | SNV | Missense_Mutation | c.2311N>A | p.Asp771Asn | p.D771N | Q6PD62 | protein_coding | tolerated(0.15) | benign(0.012) | TCGA-AR-A256-01 | Breast | breast invasive carcinoma | Female | <65 | I/II | Chemotherapy | doxorubicin | PD | |
| CTR9 | SNV | Missense_Mutation | rs777109871 | c.1555N>G | p.Leu519Val | p.L519V | Q6PD62 | protein_coding | deleterious(0.03) | benign(0.376) | TCGA-B6-A0IJ-01 | Breast | breast invasive carcinoma | Female | <65 | I/II | Unknown | Unknown | SD |
| CTR9 | SNV | Missense_Mutation | c.2239N>A | p.Ala747Thr | p.A747T | Q6PD62 | protein_coding | deleterious(0.01) | benign(0.122) | TCGA-BH-A0HF-01 | Breast | breast invasive carcinoma | Female | >=65 | I/II | Hormone Therapy | arimidex | SD | |
| CTR9 | insertion | Frame_Shift_Ins | novel | c.783_784insACCTTTG | p.Tyr262ThrfsTer6 | p.Y262Tfs*6 | Q6PD62 | protein_coding | TCGA-AR-A0TU-01 | Breast | breast invasive carcinoma | Female | <65 | I/II | Unspecific | Doxorubicin | SD | ||
| CTR9 | insertion | Nonsense_Mutation | novel | c.1373_1374insATAAAAGAGAT | p.Ala459Ter | p.A459* | Q6PD62 | protein_coding | TCGA-AR-A0U2-01 | Breast | breast invasive carcinoma | Female | <65 | III/IV | Hormone Therapy | tamoxiphen | PD | ||
| CTR9 | SNV | Missense_Mutation | rs760130762 | c.1427N>T | p.Ala476Val | p.A476V | Q6PD62 | protein_coding | tolerated(0.28) | benign(0.083) | TCGA-2W-A8YY-01 | Cervix | cervical & endocervical cancer | Female | <65 | I/II | Chemotherapy | cisplatin | CR |
| CTR9 | SNV | Missense_Mutation | c.2732N>G | p.Ser911Cys | p.S911C | Q6PD62 | protein_coding | deleterious(0.03) | probably_damaging(0.971) | TCGA-DR-A0ZM-01 | Cervix | cervical & endocervical cancer | Female | <65 | III/IV | Unspecific | Cisplatin | SD | |
| CTR9 | SNV | Missense_Mutation | novel | c.2680G>A | p.Glu894Lys | p.E894K | Q6PD62 | protein_coding | tolerated(0.86) | benign(0.05) | TCGA-EA-A3HU-01 | Cervix | cervical & endocervical cancer | Female | <65 | I/II | Unknown | Unknown | SD |
| Page: 1 2 3 4 5 6 7 8 9 10 11 12 13 |
Top |
Related drugs of malignant transformation related genes |
| Identification of chemicals and drugs interact with genes involved in malignant transfromation |
| (DGIdb 4.0) |
| Entrez ID | Symbol | Category | Interaction Types | Drug Claim Name | Drug Name | PMIDs |
| Page: 1 |

Copyright 2023-Present -The University of Texas Health Science Center at Houston |