
|
|||||
|
 | |
| |
| |
| |
| |
| |
|
Gene: CSNK1G2 |
Gene summary for CSNK1G2 |
| Gene information | Species | Human | Gene symbol | CSNK1G2 | Gene ID | 1455 |
| Gene name | casein kinase 1 gamma 2 | |
| Gene Alias | CK1g2 | |
| Cytomap | 19p13.3 | |
| Gene Type | protein-coding | GO ID | GO:0006464 | UniProtAcc | P78368 |
Top |
Malignant transformation analysis |
| Identification of the aberrant gene expression in precancerous and cancerous lesions by comparing the gene expression of stem-like cells in diseased tissues with normal stem cells |
| Entrez ID | Symbol | Replicates | Species | Organ | Tissue | Adj P-value | Log2FC | Malignancy |
| 1455 | CSNK1G2 | LZE4T | Human | Esophagus | ESCC | 2.44e-04 | 6.43e-02 | 0.0811 |
| 1455 | CSNK1G2 | LZE7T | Human | Esophagus | ESCC | 6.43e-08 | 1.76e-01 | 0.0667 |
| 1455 | CSNK1G2 | LZE8T | Human | Esophagus | ESCC | 4.60e-06 | 1.03e-01 | 0.067 |
| 1455 | CSNK1G2 | LZE20T | Human | Esophagus | ESCC | 3.93e-06 | 1.21e-01 | 0.0662 |
| 1455 | CSNK1G2 | LZE24T | Human | Esophagus | ESCC | 1.33e-10 | 2.09e-01 | 0.0596 |
| 1455 | CSNK1G2 | LZE21T | Human | Esophagus | ESCC | 1.28e-03 | 2.36e-01 | 0.0655 |
| 1455 | CSNK1G2 | P1T-E | Human | Esophagus | ESCC | 3.59e-20 | 6.02e-01 | 0.0875 |
| 1455 | CSNK1G2 | P2T-E | Human | Esophagus | ESCC | 3.42e-09 | 2.31e-01 | 0.1177 |
| 1455 | CSNK1G2 | P4T-E | Human | Esophagus | ESCC | 2.85e-20 | 2.90e-01 | 0.1323 |
| 1455 | CSNK1G2 | P5T-E | Human | Esophagus | ESCC | 8.91e-06 | 4.46e-02 | 0.1327 |
| 1455 | CSNK1G2 | P8T-E | Human | Esophagus | ESCC | 6.91e-07 | 5.58e-02 | 0.0889 |
| 1455 | CSNK1G2 | P9T-E | Human | Esophagus | ESCC | 2.96e-19 | 2.36e-01 | 0.1131 |
| 1455 | CSNK1G2 | P10T-E | Human | Esophagus | ESCC | 4.07e-20 | 4.06e-01 | 0.116 |
| 1455 | CSNK1G2 | P11T-E | Human | Esophagus | ESCC | 2.92e-08 | 2.00e-01 | 0.1426 |
| 1455 | CSNK1G2 | P12T-E | Human | Esophagus | ESCC | 5.55e-17 | 1.45e-01 | 0.1122 |
| 1455 | CSNK1G2 | P15T-E | Human | Esophagus | ESCC | 4.69e-14 | 2.02e-01 | 0.1149 |
| 1455 | CSNK1G2 | P16T-E | Human | Esophagus | ESCC | 8.39e-13 | 2.15e-01 | 0.1153 |
| 1455 | CSNK1G2 | P17T-E | Human | Esophagus | ESCC | 1.80e-02 | 1.14e-01 | 0.1278 |
| 1455 | CSNK1G2 | P20T-E | Human | Esophagus | ESCC | 3.30e-11 | 1.18e-01 | 0.1124 |
| 1455 | CSNK1G2 | P21T-E | Human | Esophagus | ESCC | 1.53e-10 | 2.26e-01 | 0.1617 |
| Page: 1 2 3 4 5 6 7 |
| Tissue | Expression Dynamics | Abbreviation |
| Esophagus | 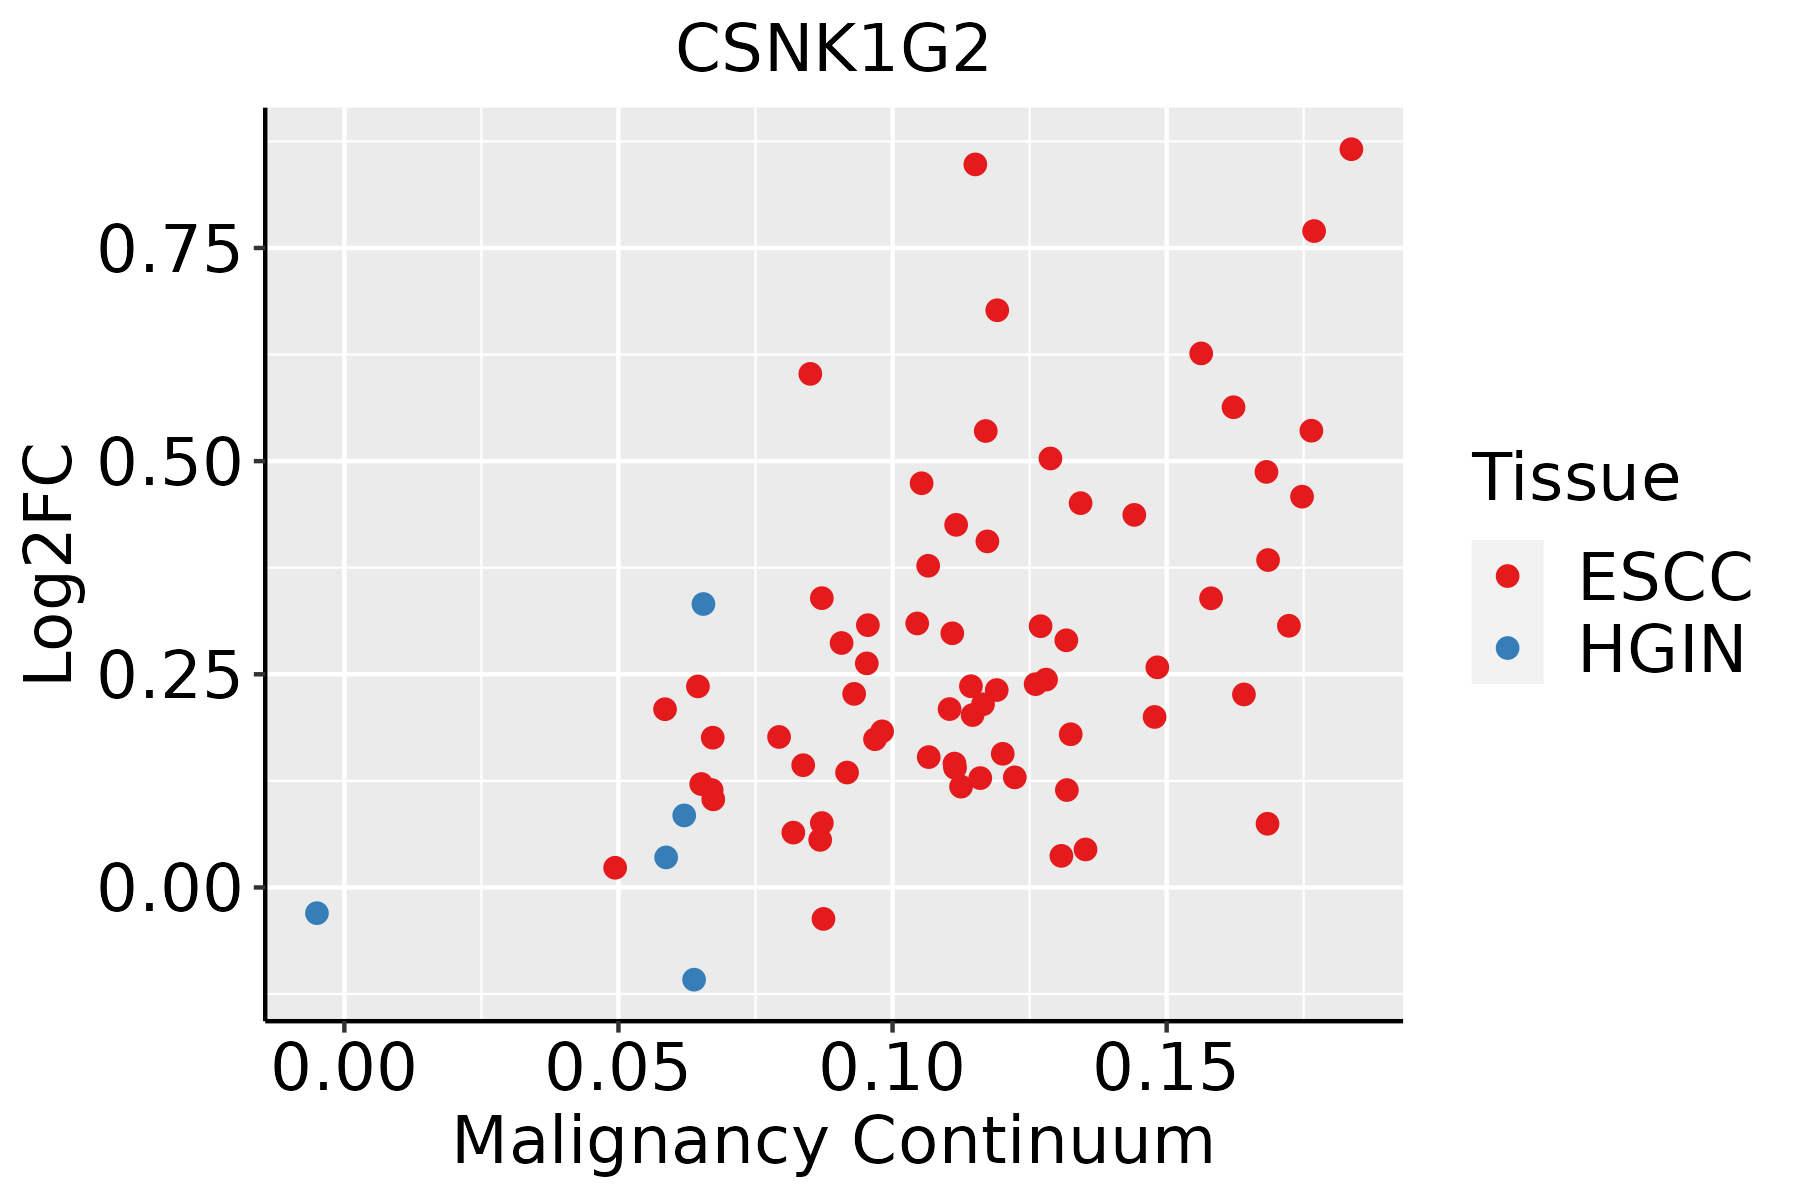 | ESCC: Esophageal squamous cell carcinoma |
| HGIN: High-grade intraepithelial neoplasias | ||
| LGIN: Low-grade intraepithelial neoplasias | ||
| Liver | 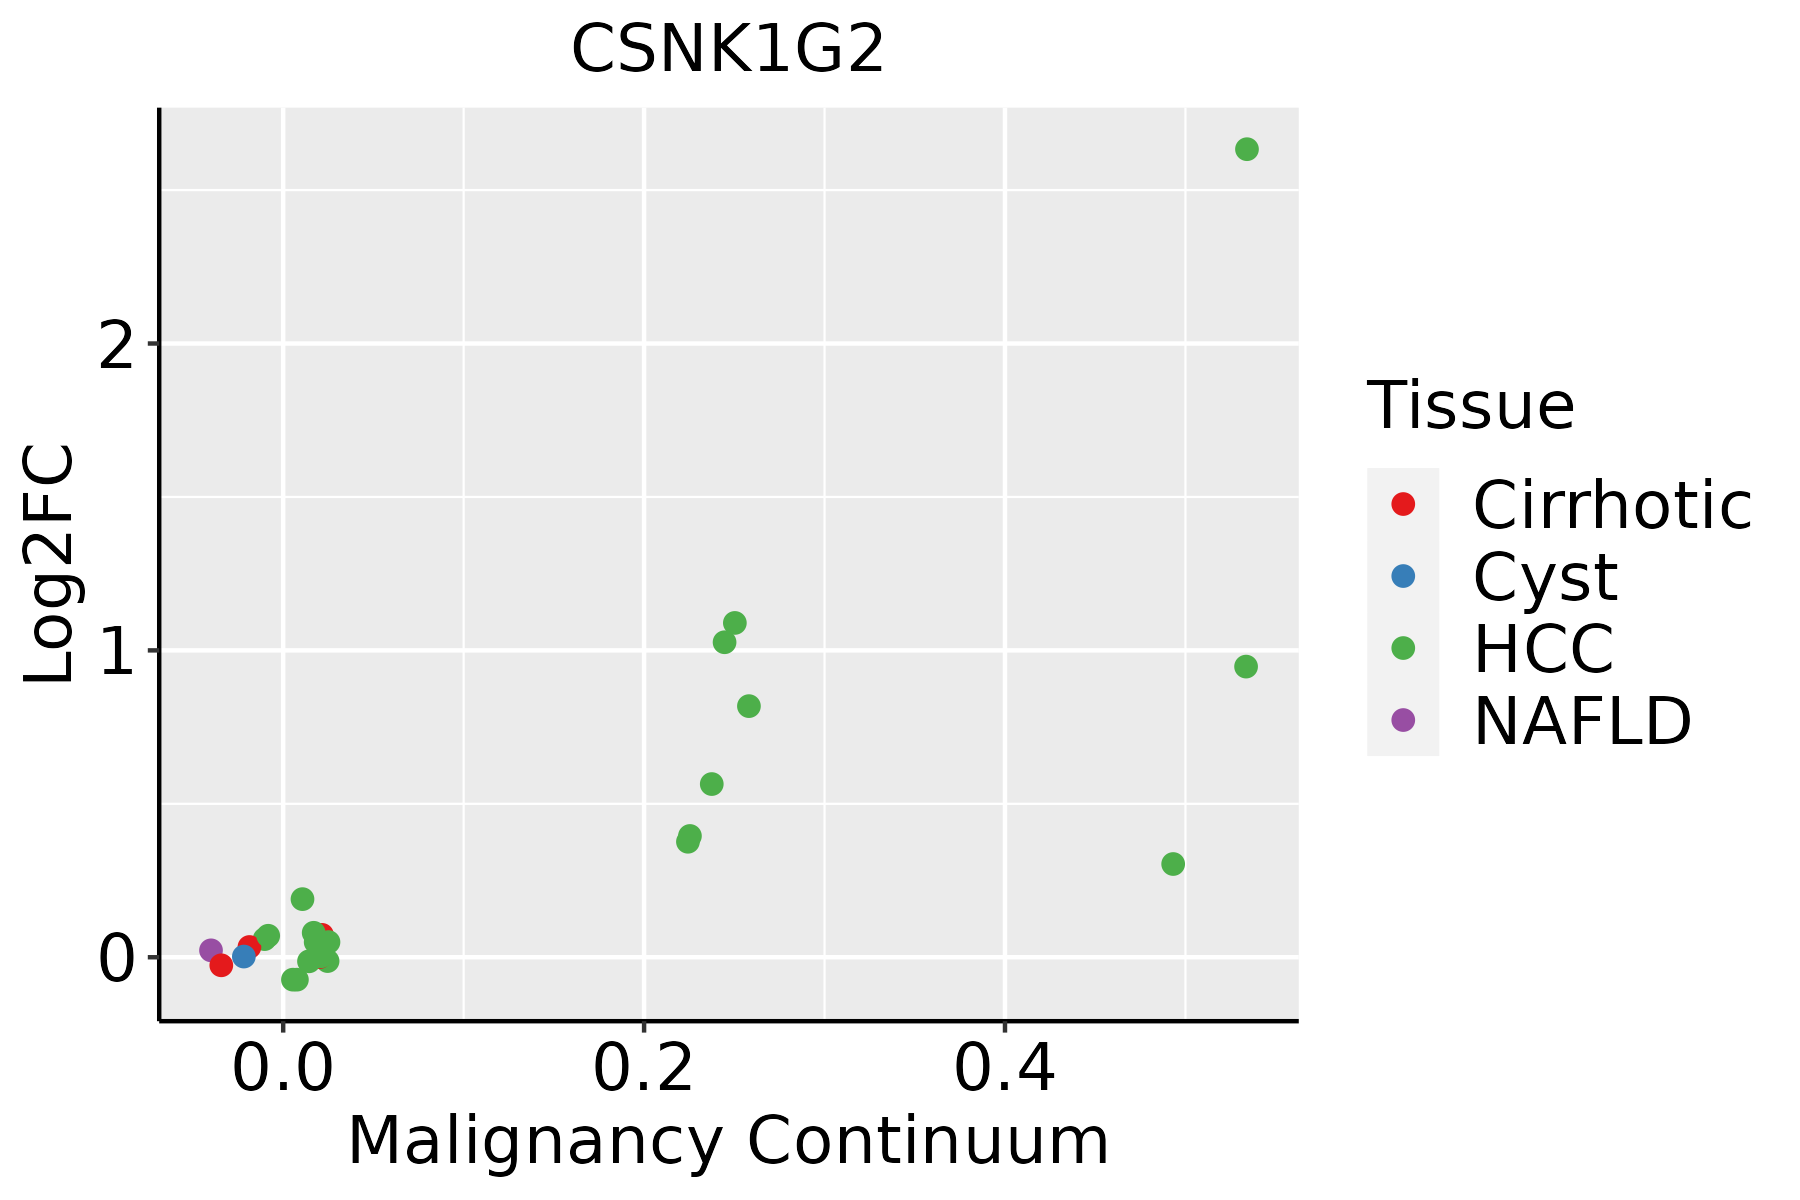 | HCC: Hepatocellular carcinoma |
| NAFLD: Non-alcoholic fatty liver disease | ||
| Oral Cavity | 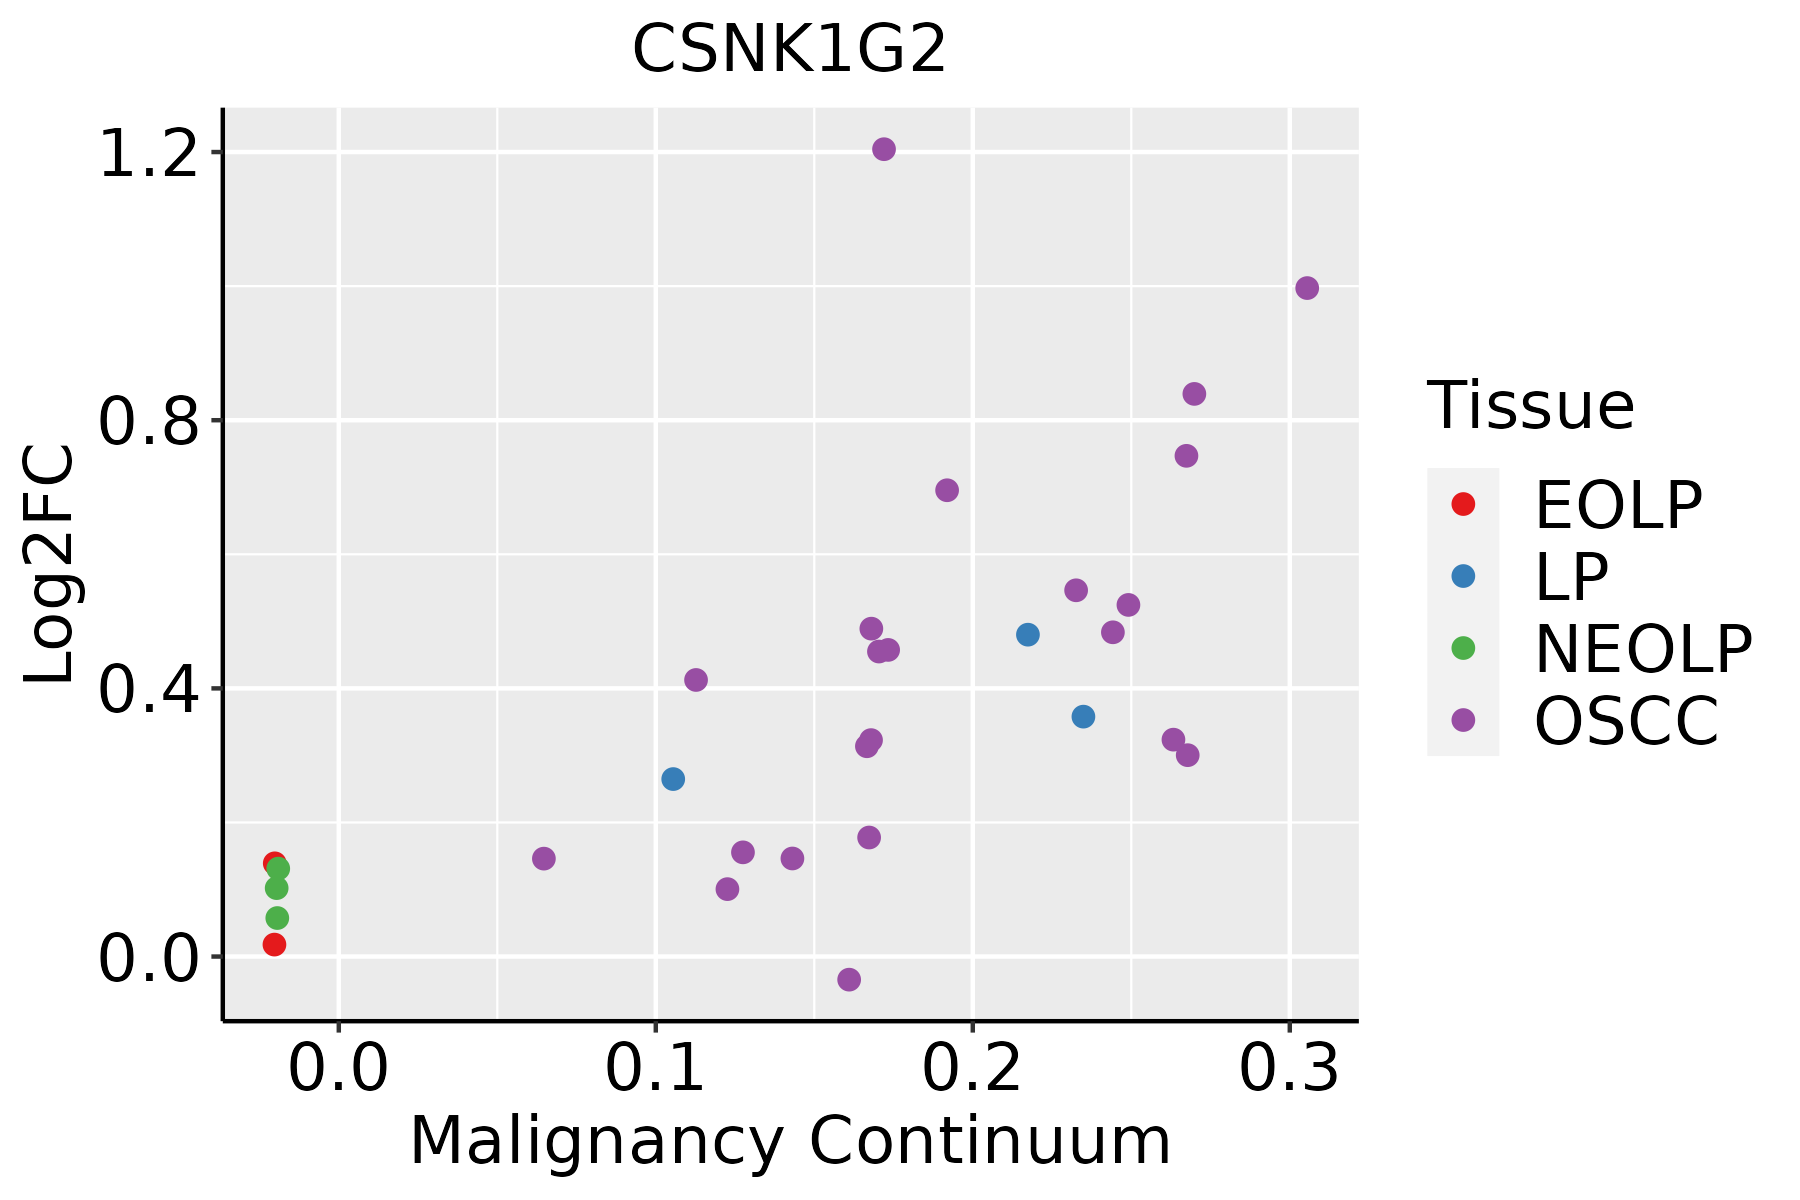 | EOLP: Erosive Oral lichen planus |
| LP: leukoplakia | ||
| NEOLP: Non-erosive oral lichen planus | ||
| OSCC: Oral squamous cell carcinoma | ||
| Prostate |  | BPH: Benign Prostatic Hyperplasia |
| Skin | 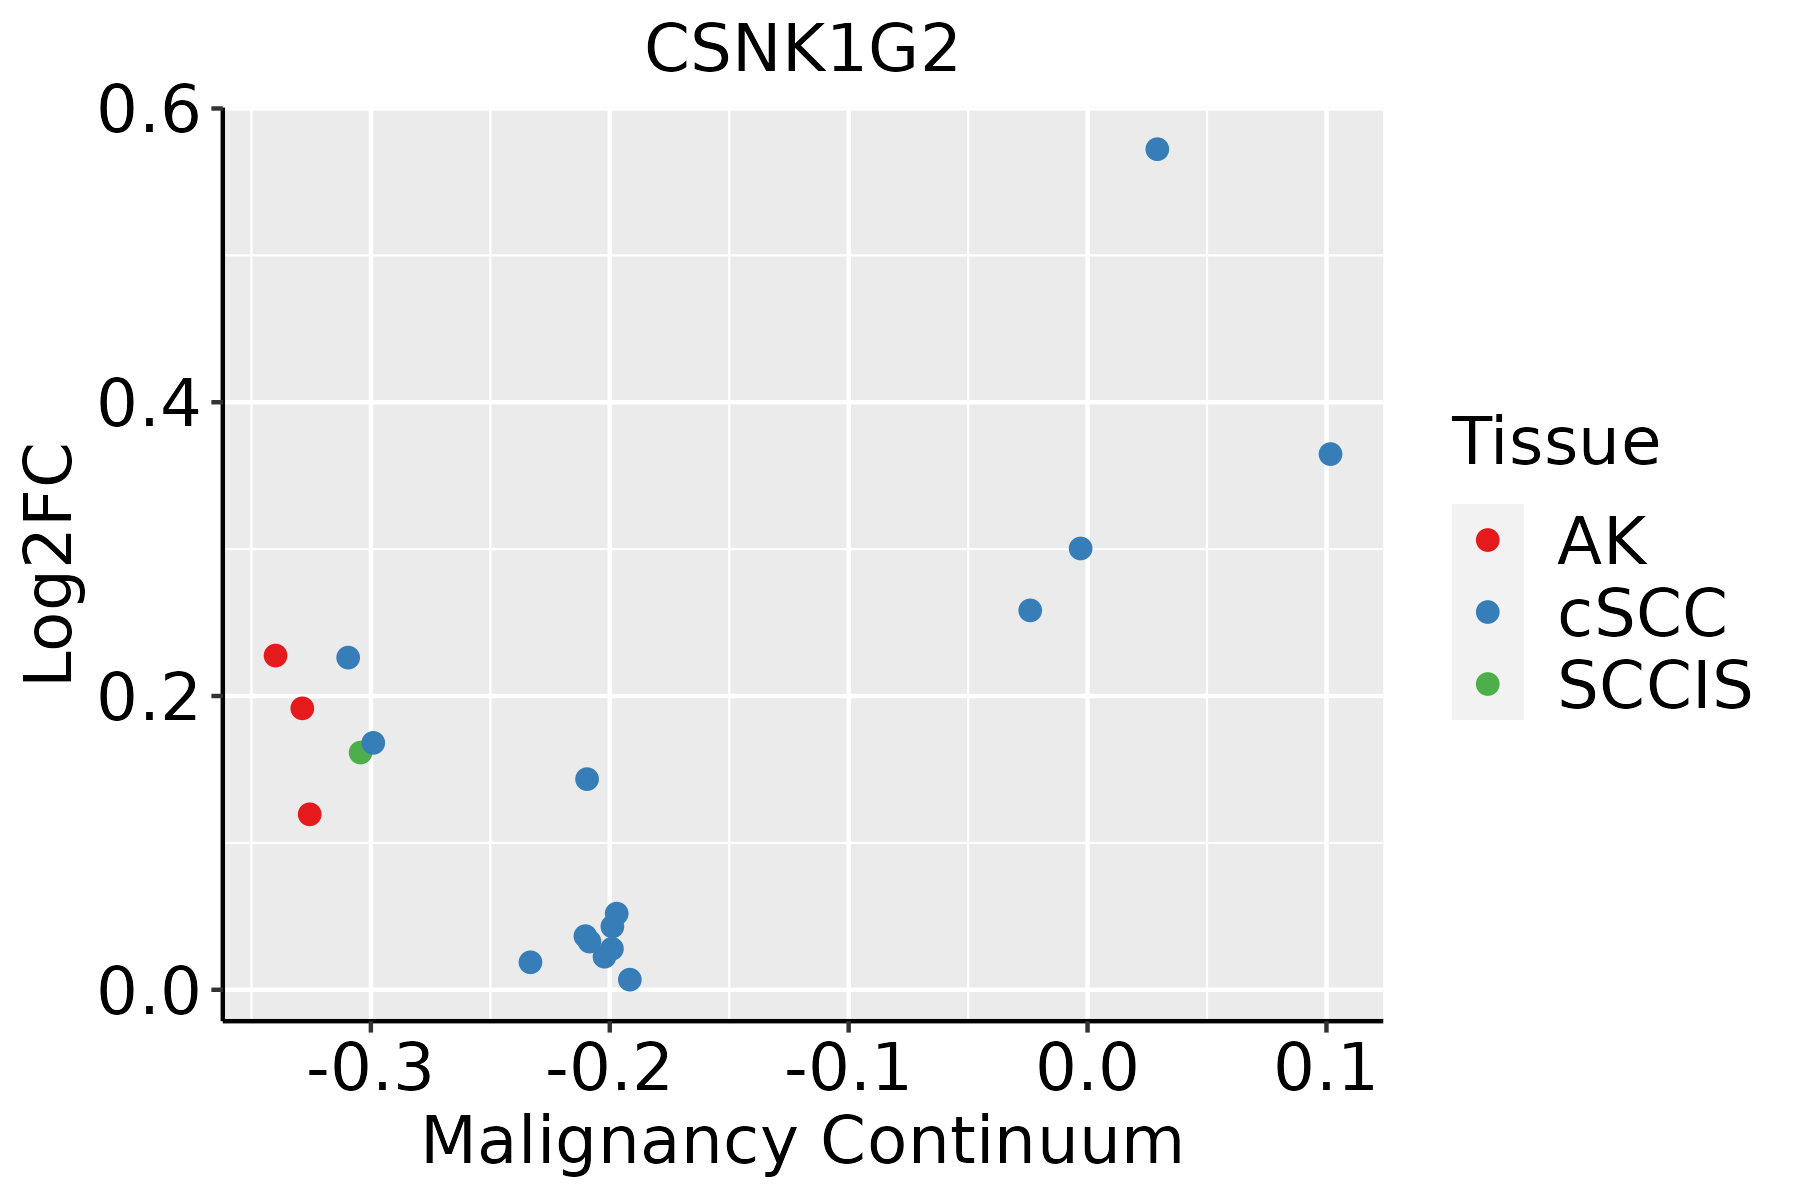 | AK: Actinic keratosis |
| cSCC: Cutaneous squamous cell carcinoma | ||
| SCCIS:squamous cell carcinoma in situ | ||
| Thyroid | 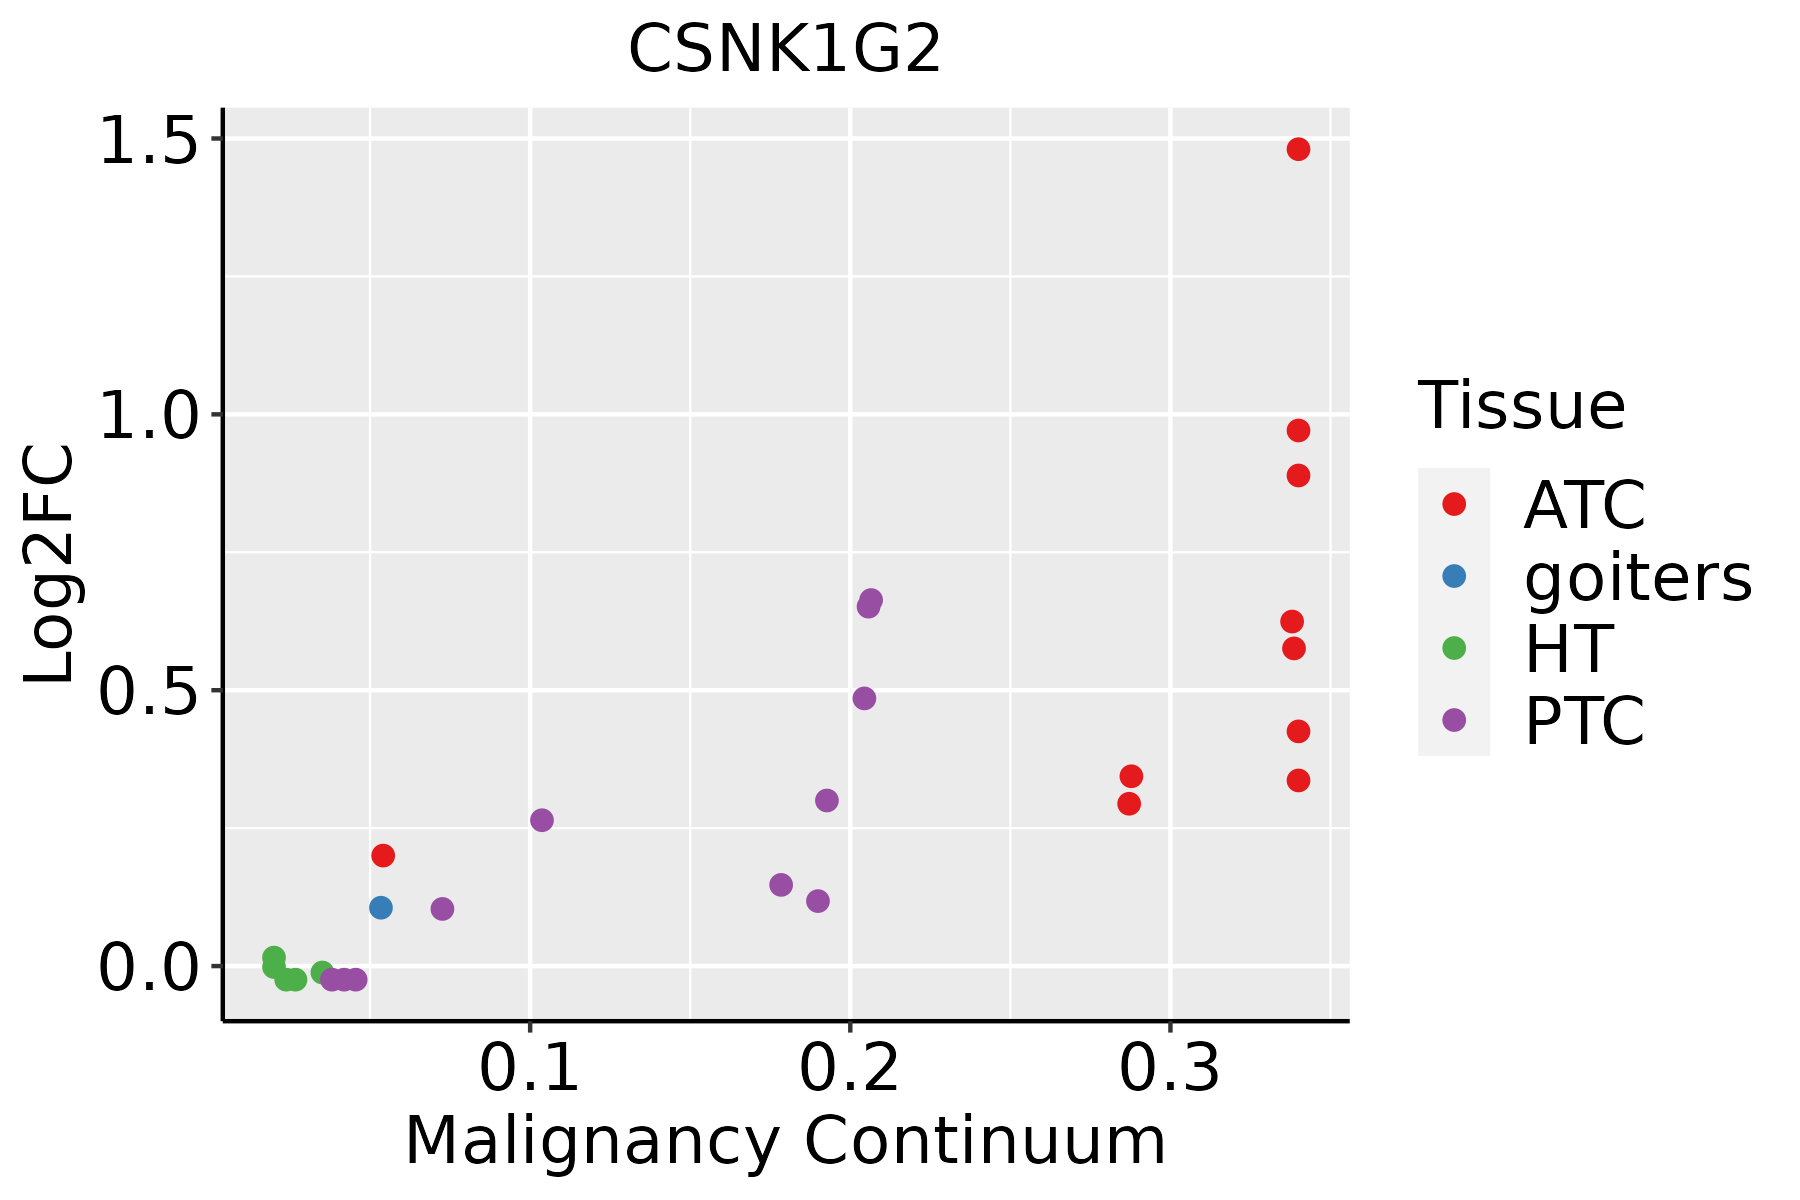 | ATC: Anaplastic thyroid cancer |
| HT: Hashimoto's thyroiditis | ||
| PTC: Papillary thyroid cancer |
| ∗log2FC in expression of this searched gene in stem-like cells from each diseased tissue sample relative to stem-like cells in normal samples in each tissue plotted against the malignancy continuum. Samples are colored based on if they are from different disease stage. |
Top |
Malignant transformation related pathway analysis |
| Find out the enriched GO biological processes and KEGG pathways involved in transition from healthy to precancer to cancer |
| Tissue | Disease Stage | Enriched GO biological Processes |
| Colorectum | AD |  |
| Colorectum | SER |  |
| Colorectum | MSS |  |
| Colorectum | MSI-H |  |
| Colorectum | FAP |  |
| ∗Top 15 enriched GO BP terms are showed in the bar plot of each disease state in each tissue. Each row represents a significant GO biological process which is colored according to the -log10(p.adjust). |
| Page: 1 2 3 4 5 6 7 8 9 |
| GO ID | Tissue | Disease Stage | Description | Gene Ratio | Bg Ratio | pvalue | p.adjust | Count |
| GO:004677712 | Prostate | Tumor | protein autophosphorylation | 54/3246 | 227/18723 | 7.93e-03 | 3.52e-02 | 54 |
| GO:001605518 | Skin | AK | Wnt signaling pathway | 98/1910 | 444/18723 | 9.39e-14 | 3.09e-11 | 98 |
| GO:019873818 | Skin | AK | cell-cell signaling by wnt | 98/1910 | 446/18723 | 1.26e-13 | 3.72e-11 | 98 |
| GO:003011118 | Skin | AK | regulation of Wnt signaling pathway | 73/1910 | 328/18723 | 9.27e-11 | 1.52e-08 | 73 |
| GO:006007017 | Skin | AK | canonical Wnt signaling pathway | 67/1910 | 303/18723 | 7.30e-10 | 7.45e-08 | 67 |
| GO:006082818 | Skin | AK | regulation of canonical Wnt signaling pathway | 57/1910 | 253/18723 | 6.57e-09 | 4.47e-07 | 57 |
| GO:003017717 | Skin | AK | positive regulation of Wnt signaling pathway | 35/1910 | 140/18723 | 3.93e-07 | 1.48e-05 | 35 |
| GO:009026317 | Skin | AK | positive regulation of canonical Wnt signaling pathway | 28/1910 | 106/18723 | 1.73e-06 | 5.13e-05 | 28 |
| GO:001820910 | Skin | AK | peptidyl-serine modification | 61/1910 | 338/18723 | 7.00e-06 | 1.55e-04 | 61 |
| GO:001810516 | Skin | AK | peptidyl-serine phosphorylation | 57/1910 | 315/18723 | 1.27e-05 | 2.57e-04 | 57 |
| GO:004677714 | Skin | AK | protein autophosphorylation | 42/1910 | 227/18723 | 1.01e-04 | 1.33e-03 | 42 |
| GO:001605524 | Skin | cSCC | Wnt signaling pathway | 158/4864 | 444/18723 | 3.80e-06 | 5.70e-05 | 158 |
| GO:019873824 | Skin | cSCC | cell-cell signaling by wnt | 158/4864 | 446/18723 | 5.08e-06 | 7.38e-05 | 158 |
| GO:003011124 | Skin | cSCC | regulation of Wnt signaling pathway | 117/4864 | 328/18723 | 5.80e-05 | 5.75e-04 | 117 |
| GO:004677715 | Skin | cSCC | protein autophosphorylation | 84/4864 | 227/18723 | 1.53e-04 | 1.35e-03 | 84 |
| GO:009026324 | Skin | cSCC | positive regulation of canonical Wnt signaling pathway | 45/4864 | 106/18723 | 1.61e-04 | 1.42e-03 | 45 |
| GO:003017724 | Skin | cSCC | positive regulation of Wnt signaling pathway | 55/4864 | 140/18723 | 3.72e-04 | 2.92e-03 | 55 |
| GO:006007024 | Skin | cSCC | canonical Wnt signaling pathway | 104/4864 | 303/18723 | 7.13e-04 | 5.03e-03 | 104 |
| GO:006082824 | Skin | cSCC | regulation of canonical Wnt signaling pathway | 87/4864 | 253/18723 | 1.74e-03 | 1.06e-02 | 87 |
| GO:001820923 | Skin | cSCC | peptidyl-serine modification | 108/4864 | 338/18723 | 7.73e-03 | 3.60e-02 | 108 |
| Page: 1 2 3 4 5 6 |
| Pathway ID | Tissue | Disease Stage | Description | Gene Ratio | Bg Ratio | pvalue | p.adjust | qvalue | Count |
| Page: 1 |
Top |
Cell-cell communication analysis |
| Identification of potential cell-cell interactions between two cell types and their ligand-receptor pairs for different disease states |
| Ligand | Receptor | LRpair | Pathway | Tissue | Disease Stage |
| Page: 1 |
Top |
Single-cell gene regulatory network inference analysis |
| Find out the significant the regulons (TFs) and the target genes of each regulon across cell types for different disease states |
| TF | Cell Type | Tissue | Disease Stage | Target Gene | RSS | Regulon Activity |
| ∗The dot plots of a searched regulon are shown for all cell subpopulations in each disease state of each tissue based on the regulon specific score inferred using pySCENIC and by calculating the average expression. |
| Page: 1 |
Top |
Somatic mutation of malignant transformation related genes |
| Annotation of somatic variants for genes involved in malignant transformation |
| Hugo Symbol | Variant Class | Variant Classification | dbSNP RS | HGVSc | HGVSp | HGVSp Short | SWISSPROT | BIOTYPE | SIFT | PolyPhen | Tumor Sample Barcode | Tissue | Histology | Sex | Age | Stage | Therapy Types | Drugs | Outcome |
| CSNK1G2 | SNV | Missense_Mutation | novel | c.211T>C | p.Tyr71His | p.Y71H | P78368 | protein_coding | tolerated(0.61) | benign(0.02) | TCGA-AR-A2LL-01 | Breast | breast invasive carcinoma | Female | >=65 | I/II | Hormone Therapy | tamoxiphen | SD |
| CSNK1G2 | SNV | Missense_Mutation | novel | c.1129N>C | p.Thr377Pro | p.T377P | P78368 | protein_coding | deleterious(0.01) | probably_damaging(0.953) | TCGA-BH-A1ET-01 | Breast | breast invasive carcinoma | Female | <65 | I/II | Unknown | Unknown | SD |
| CSNK1G2 | SNV | Missense_Mutation | novel | c.595N>A | p.Glu199Lys | p.E199K | P78368 | protein_coding | tolerated(0.42) | possibly_damaging(0.862) | TCGA-2W-A8YY-01 | Cervix | cervical & endocervical cancer | Female | <65 | I/II | Chemotherapy | cisplatin | CR |
| CSNK1G2 | deletion | Frame_Shift_Del | novel | c.111delN | p.Val39SerfsTer2 | p.V39Sfs*2 | P78368 | protein_coding | TCGA-VS-A94Z-01 | Cervix | cervical & endocervical cancer | Female | <65 | I/II | Chemotherapy | cisplatin | CR | ||
| CSNK1G2 | SNV | Missense_Mutation | rs548764709 | c.233C>T | p.Pro78Leu | p.P78L | P78368 | protein_coding | deleterious(0) | possibly_damaging(0.591) | TCGA-AA-3947-01 | Colorectum | colon adenocarcinoma | Female | <65 | I/II | Unknown | Unknown | SD |
| CSNK1G2 | SNV | Missense_Mutation | c.581N>C | p.Glu194Ala | p.E194A | P78368 | protein_coding | deleterious(0) | probably_damaging(0.998) | TCGA-AD-A5EJ-01 | Colorectum | colon adenocarcinoma | Female | >=65 | I/II | Unknown | Unknown | SD | |
| CSNK1G2 | SNV | Missense_Mutation | c.883N>T | p.Arg295Trp | p.R295W | P78368 | protein_coding | deleterious(0.01) | possibly_damaging(0.742) | TCGA-AM-5821-01 | Colorectum | colon adenocarcinoma | Female | >=65 | I/II | Unknown | Unknown | SD | |
| CSNK1G2 | SNV | Missense_Mutation | c.772N>A | p.Asp258Asn | p.D258N | P78368 | protein_coding | tolerated(0.05) | probably_damaging(0.96) | TCGA-CK-4951-01 | Colorectum | colon adenocarcinoma | Female | >=65 | I/II | Unknown | Unknown | PD | |
| CSNK1G2 | SNV | Missense_Mutation | c.404G>T | p.Arg135Leu | p.R135L | P78368 | protein_coding | deleterious(0) | possibly_damaging(0.82) | TCGA-F4-6463-01 | Colorectum | colon adenocarcinoma | Male | <65 | I/II | Unknown | Unknown | SD | |
| CSNK1G2 | SNV | Missense_Mutation | novel | c.829G>A | p.Glu277Lys | p.E277K | P78368 | protein_coding | tolerated(0.2) | probably_damaging(0.999) | TCGA-F5-6814-01 | Colorectum | rectum adenocarcinoma | Male | <65 | I/II | Unknown | Unknown | SD |
| Page: 1 2 3 4 |
Top |
Related drugs of malignant transformation related genes |
| Identification of chemicals and drugs interact with genes involved in malignant transfromation |
| (DGIdb 4.0) |
| Entrez ID | Symbol | Category | Interaction Types | Drug Claim Name | Drug Name | PMIDs |
| 1455 | CSNK1G2 | KINASE, SERINE THREONINE KINASE, ENZYME, DRUGGABLE GENOME | PHA-767491 | CHEMBL225519 | ||
| 1455 | CSNK1G2 | KINASE, SERINE THREONINE KINASE, ENZYME, DRUGGABLE GENOME | TAK-715 | TAK-715 | ||
| 1455 | CSNK1G2 | KINASE, SERINE THREONINE KINASE, ENZYME, DRUGGABLE GENOME | SP-600125 | SP-600125 | ||
| 1455 | CSNK1G2 | KINASE, SERINE THREONINE KINASE, ENZYME, DRUGGABLE GENOME | ALSTERPAULLONE | ALSTERPAULLONE | ||
| 1455 | CSNK1G2 | KINASE, SERINE THREONINE KINASE, ENZYME, DRUGGABLE GENOME | SB-220025 | SB-220025 | ||
| 1455 | CSNK1G2 | KINASE, SERINE THREONINE KINASE, ENZYME, DRUGGABLE GENOME | inhibitor | 249565834 | ||
| 1455 | CSNK1G2 | KINASE, SERINE THREONINE KINASE, ENZYME, DRUGGABLE GENOME | PF-562271 | PF-00562271 | ||
| 1455 | CSNK1G2 | KINASE, SERINE THREONINE KINASE, ENZYME, DRUGGABLE GENOME | SNS-314 | SNS-314 | ||
| 1455 | CSNK1G2 | KINASE, SERINE THREONINE KINASE, ENZYME, DRUGGABLE GENOME | LINIFANIB | LINIFANIB | ||
| 1455 | CSNK1G2 | KINASE, SERINE THREONINE KINASE, ENZYME, DRUGGABLE GENOME | CYC-116 | CYC-116 |
| Page: 1 2 |

Copyright 2023-Present -The University of Texas Health Science Center at Houston |