
|
|||||
|
 | |
| |
| |
| |
| |
| |
|
Gene: CROT |
Gene summary for CROT |
| Gene information | Species | Human | Gene symbol | CROT | Gene ID | 54677 |
| Gene name | carnitine O-octanoyltransferase | |
| Gene Alias | COT | |
| Cytomap | 7q21.12 | |
| Gene Type | protein-coding | GO ID | GO:0006082 | UniProtAcc | Q9UKG9 |
Top |
Malignant transformation analysis |
| Identification of the aberrant gene expression in precancerous and cancerous lesions by comparing the gene expression of stem-like cells in diseased tissues with normal stem cells |
| Entrez ID | Symbol | Replicates | Species | Organ | Tissue | Adj P-value | Log2FC | Malignancy |
| 54677 | CROT | LZE8T | Human | Esophagus | ESCC | 1.14e-04 | 1.96e-01 | 0.067 |
| 54677 | CROT | LZE24T | Human | Esophagus | ESCC | 1.45e-11 | 2.74e-01 | 0.0596 |
| 54677 | CROT | P1T-E | Human | Esophagus | ESCC | 5.12e-04 | 3.39e-01 | 0.0875 |
| 54677 | CROT | P2T-E | Human | Esophagus | ESCC | 2.19e-12 | 7.72e-02 | 0.1177 |
| 54677 | CROT | P4T-E | Human | Esophagus | ESCC | 1.48e-11 | 2.04e-01 | 0.1323 |
| 54677 | CROT | P5T-E | Human | Esophagus | ESCC | 2.66e-19 | 1.17e-01 | 0.1327 |
| 54677 | CROT | P8T-E | Human | Esophagus | ESCC | 3.24e-20 | 2.12e-01 | 0.0889 |
| 54677 | CROT | P9T-E | Human | Esophagus | ESCC | 4.70e-04 | 6.33e-02 | 0.1131 |
| 54677 | CROT | P10T-E | Human | Esophagus | ESCC | 2.11e-19 | 1.78e-01 | 0.116 |
| 54677 | CROT | P11T-E | Human | Esophagus | ESCC | 4.68e-06 | 4.81e-01 | 0.1426 |
| 54677 | CROT | P12T-E | Human | Esophagus | ESCC | 3.42e-20 | 2.63e-01 | 0.1122 |
| 54677 | CROT | P15T-E | Human | Esophagus | ESCC | 9.68e-07 | 1.55e-01 | 0.1149 |
| 54677 | CROT | P16T-E | Human | Esophagus | ESCC | 1.37e-15 | 4.81e-01 | 0.1153 |
| 54677 | CROT | P17T-E | Human | Esophagus | ESCC | 1.24e-05 | 1.44e-01 | 0.1278 |
| 54677 | CROT | P19T-E | Human | Esophagus | ESCC | 1.08e-03 | 1.43e-01 | 0.1662 |
| 54677 | CROT | P20T-E | Human | Esophagus | ESCC | 7.73e-23 | 5.73e-01 | 0.1124 |
| 54677 | CROT | P21T-E | Human | Esophagus | ESCC | 7.33e-20 | 3.71e-01 | 0.1617 |
| 54677 | CROT | P22T-E | Human | Esophagus | ESCC | 1.26e-13 | 6.84e-03 | 0.1236 |
| 54677 | CROT | P23T-E | Human | Esophagus | ESCC | 3.74e-06 | 1.20e-01 | 0.108 |
| 54677 | CROT | P24T-E | Human | Esophagus | ESCC | 1.68e-05 | -5.47e-02 | 0.1287 |
| Page: 1 2 3 4 5 6 |
| Tissue | Expression Dynamics | Abbreviation |
| Esophagus | 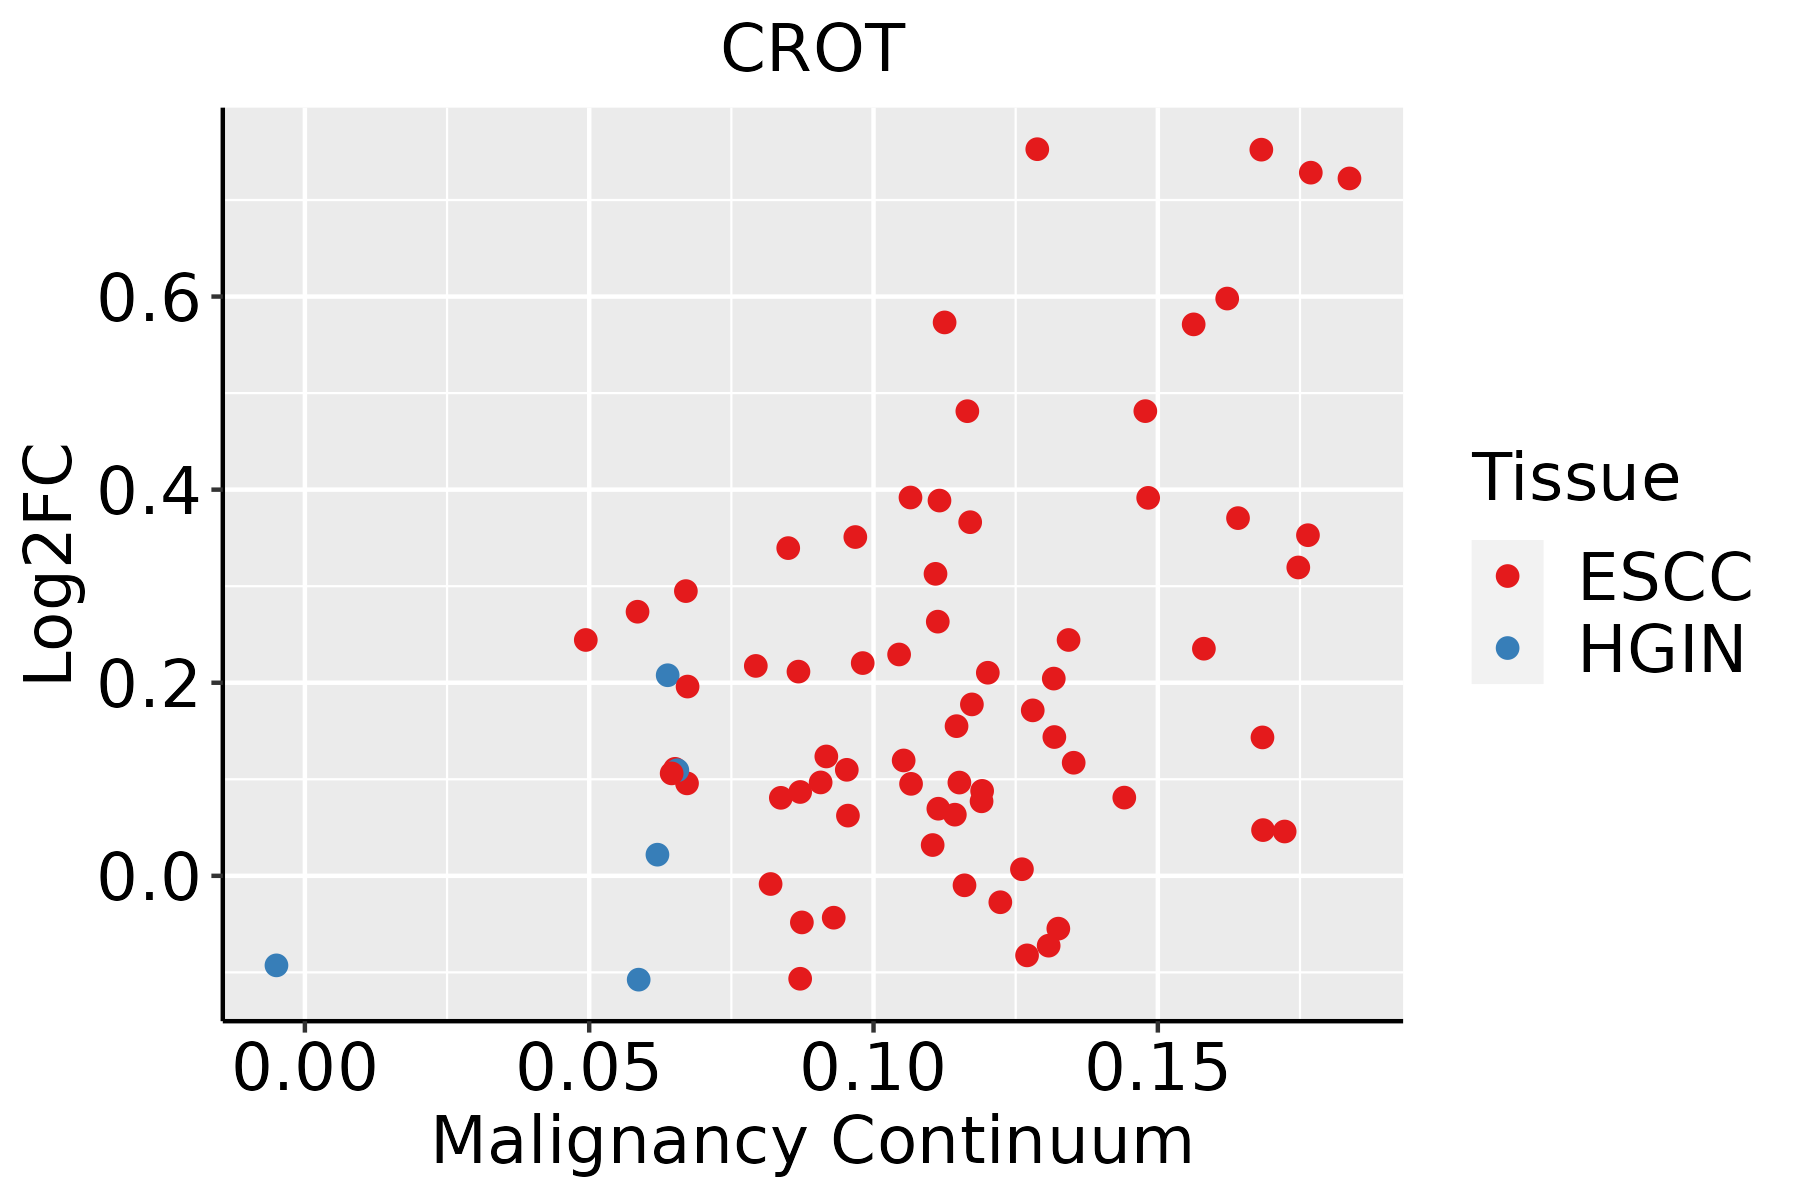 | ESCC: Esophageal squamous cell carcinoma |
| HGIN: High-grade intraepithelial neoplasias | ||
| LGIN: Low-grade intraepithelial neoplasias | ||
| Liver | 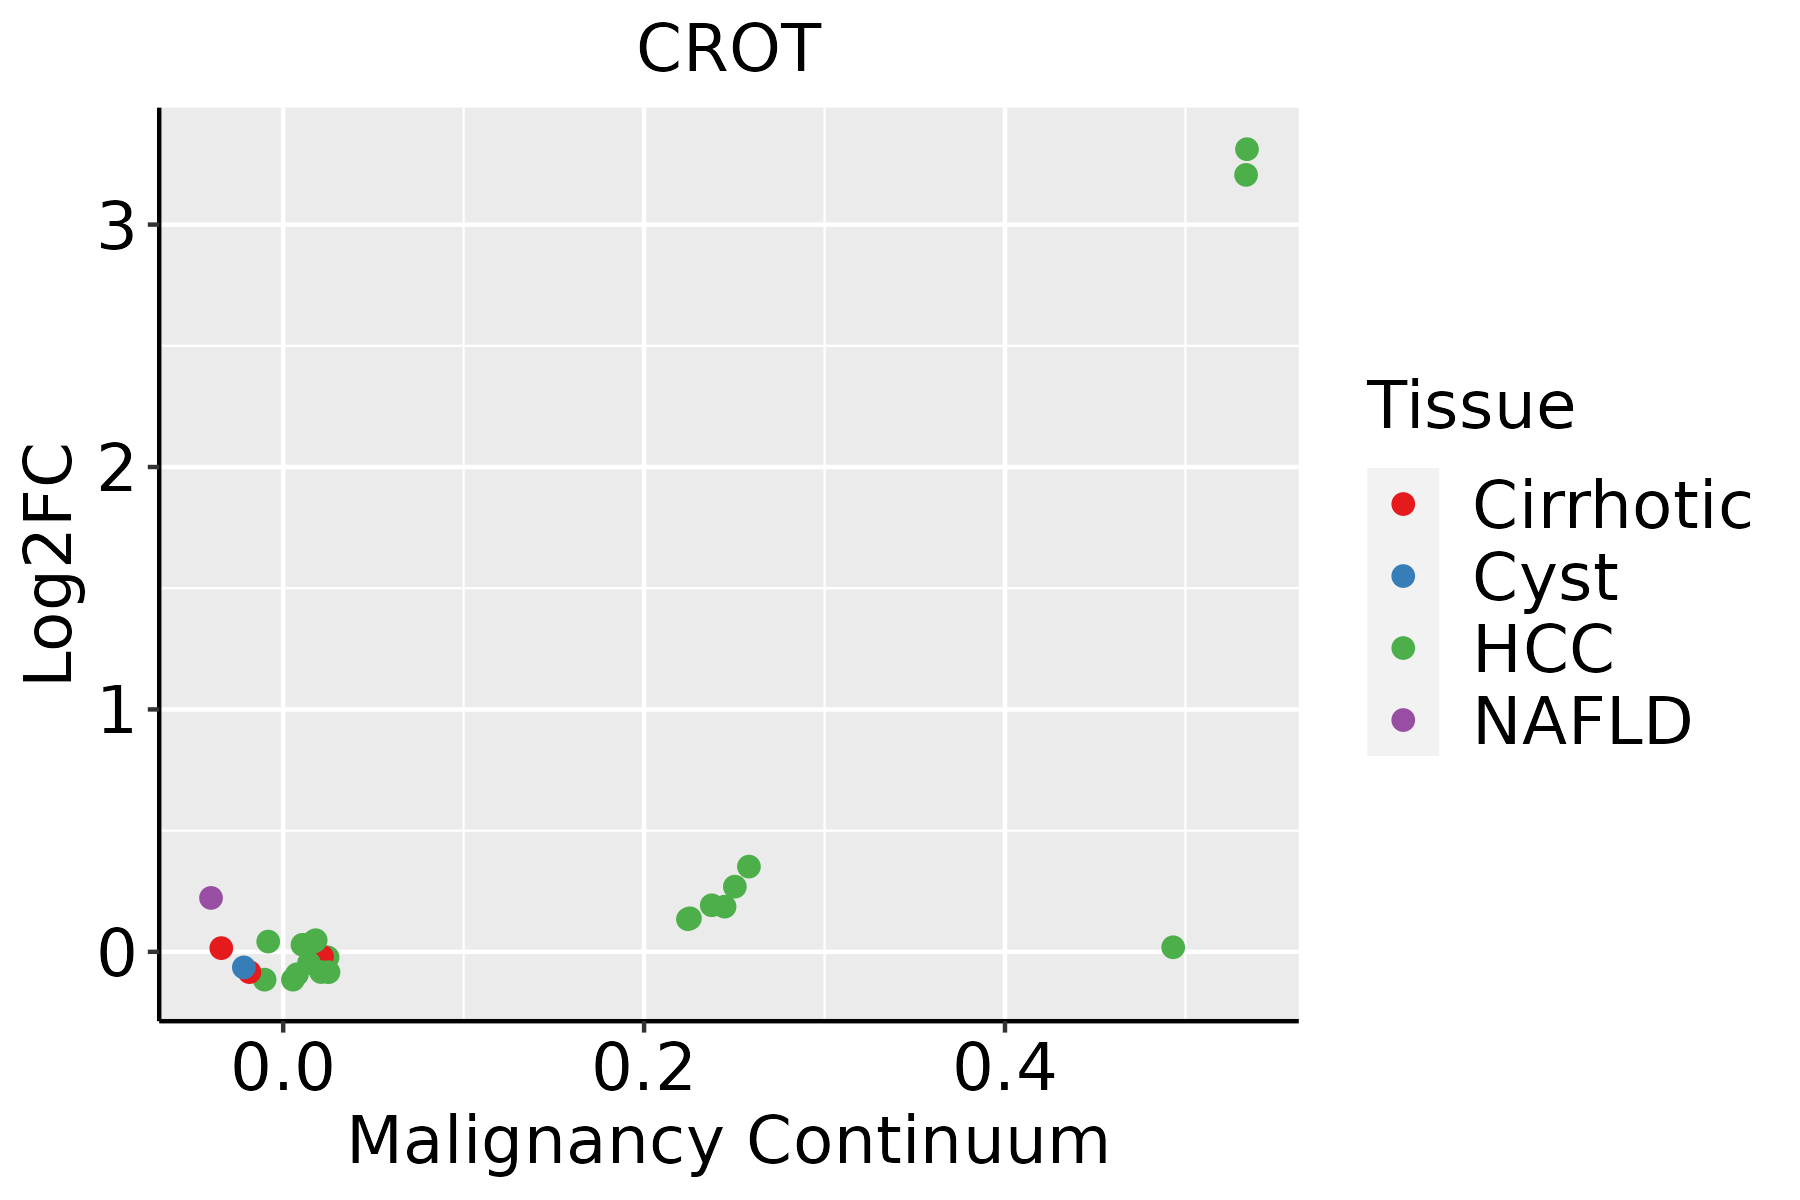 | HCC: Hepatocellular carcinoma |
| NAFLD: Non-alcoholic fatty liver disease | ||
| Oral Cavity |  | EOLP: Erosive Oral lichen planus |
| LP: leukoplakia | ||
| NEOLP: Non-erosive oral lichen planus | ||
| OSCC: Oral squamous cell carcinoma | ||
| Prostate |  | BPH: Benign Prostatic Hyperplasia |
| Skin |  | AK: Actinic keratosis |
| cSCC: Cutaneous squamous cell carcinoma | ||
| SCCIS:squamous cell carcinoma in situ | ||
| Thyroid | 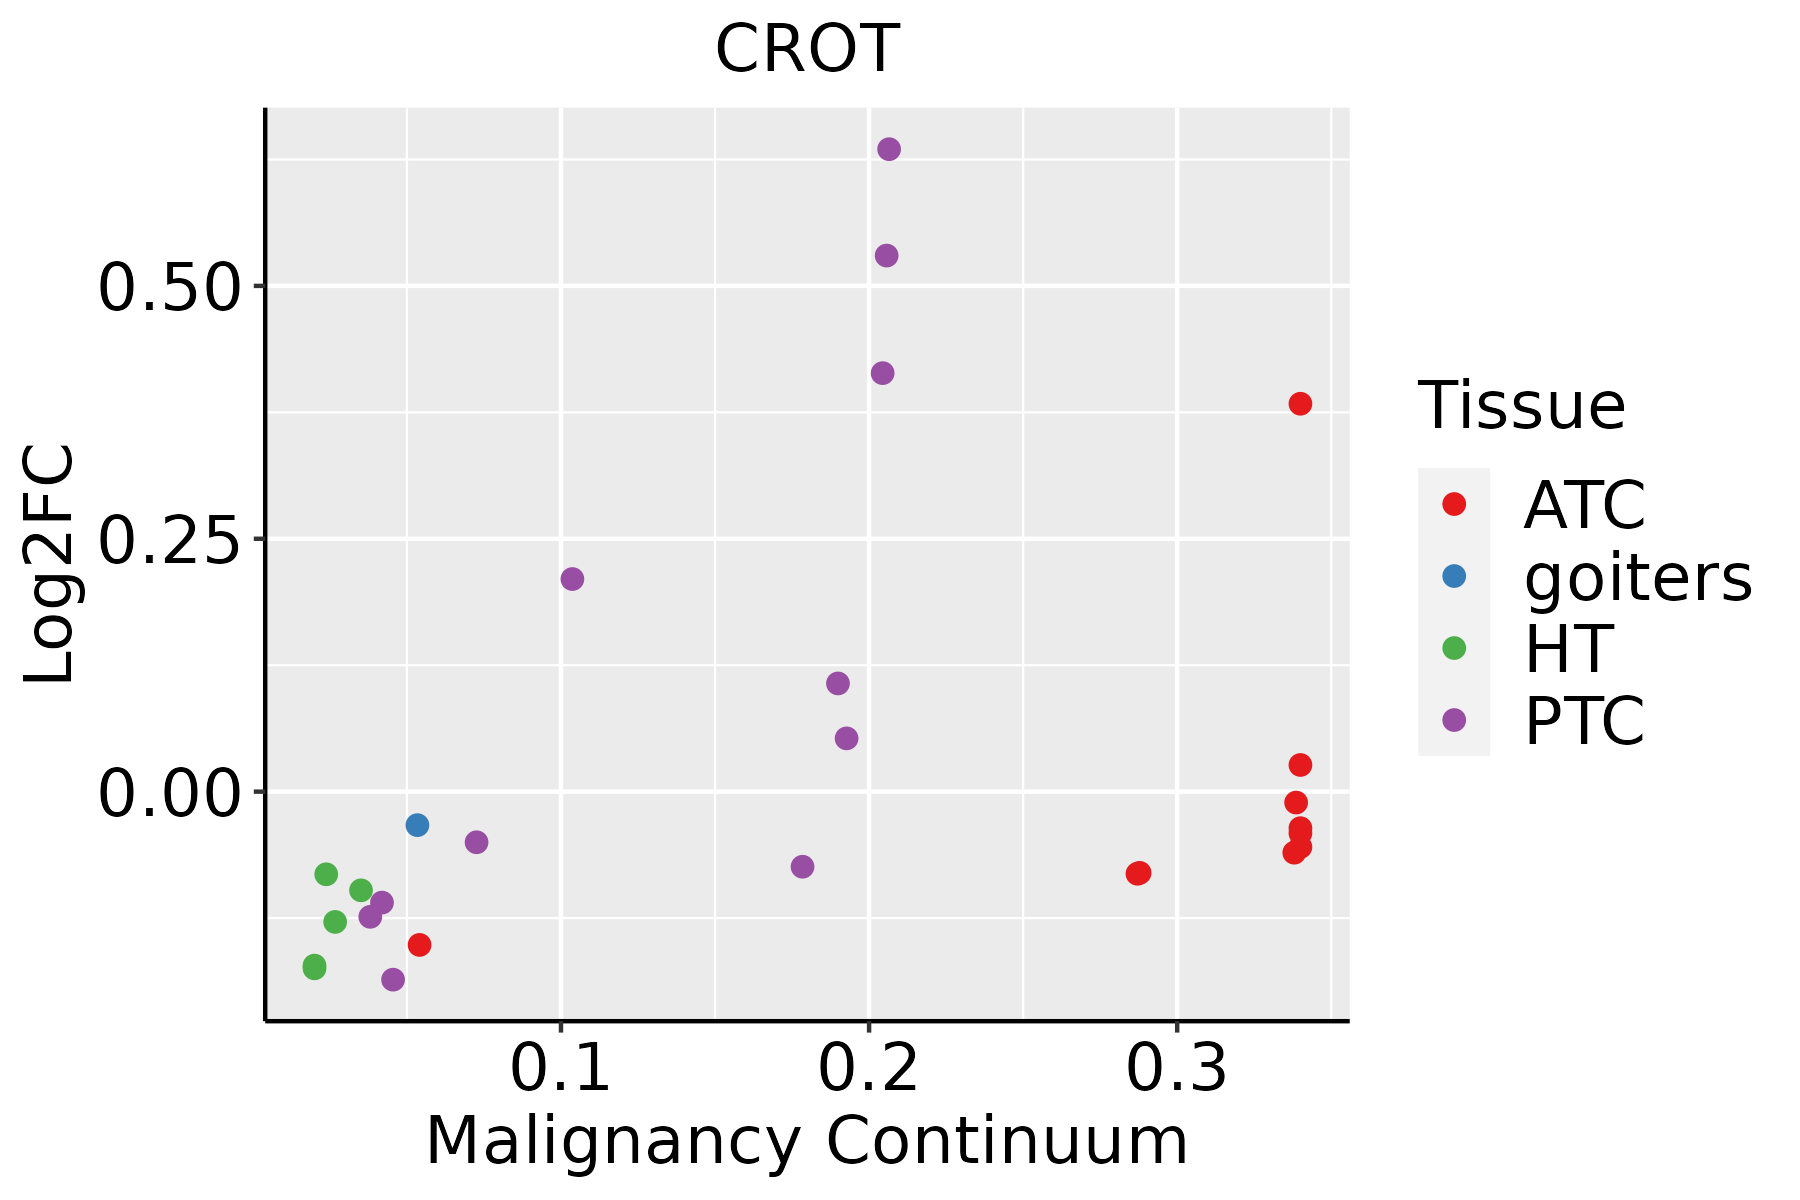 | ATC: Anaplastic thyroid cancer |
| HT: Hashimoto's thyroiditis | ||
| PTC: Papillary thyroid cancer |
| ∗log2FC in expression of this searched gene in stem-like cells from each diseased tissue sample relative to stem-like cells in normal samples in each tissue plotted against the malignancy continuum. Samples are colored based on if they are from different disease stage. |
Top |
Malignant transformation related pathway analysis |
| Find out the enriched GO biological processes and KEGG pathways involved in transition from healthy to precancer to cancer |
| Tissue | Disease Stage | Enriched GO biological Processes |
| Colorectum | AD |  |
| Colorectum | SER |  |
| Colorectum | MSS |  |
| Colorectum | MSI-H |  |
| Colorectum | FAP |  |
| ∗Top 15 enriched GO BP terms are showed in the bar plot of each disease state in each tissue. Each row represents a significant GO biological process which is colored according to the -log10(p.adjust). |
| Page: 1 2 3 4 5 6 7 8 9 |
| GO ID | Tissue | Disease Stage | Description | Gene Ratio | Bg Ratio | pvalue | p.adjust | Count |
| GO:000609117 | Prostate | Tumor | generation of precursor metabolites and energy | 166/3246 | 490/18723 | 2.38e-19 | 1.23e-16 | 166 |
| GO:000915019 | Prostate | Tumor | purine ribonucleotide metabolic process | 109/3246 | 368/18723 | 3.30e-09 | 1.36e-07 | 109 |
| GO:000925918 | Prostate | Tumor | ribonucleotide metabolic process | 110/3246 | 385/18723 | 2.45e-08 | 8.29e-07 | 110 |
| GO:000616319 | Prostate | Tumor | purine nucleotide metabolic process | 111/3246 | 396/18723 | 6.46e-08 | 1.88e-06 | 111 |
| GO:001969318 | Prostate | Tumor | ribose phosphate metabolic process | 111/3246 | 396/18723 | 6.46e-08 | 1.88e-06 | 111 |
| GO:007252119 | Prostate | Tumor | purine-containing compound metabolic process | 115/3246 | 416/18723 | 8.47e-08 | 2.31e-06 | 115 |
| GO:000911718 | Prostate | Tumor | nucleotide metabolic process | 120/3246 | 489/18723 | 2.81e-05 | 3.41e-04 | 120 |
| GO:000675317 | Prostate | Tumor | nucleoside phosphate metabolic process | 121/3246 | 497/18723 | 3.81e-05 | 4.41e-04 | 121 |
| GO:000609126 | Skin | AK | generation of precursor metabolites and energy | 69/1910 | 490/18723 | 3.59e-03 | 2.16e-02 | 69 |
| GO:0006091111 | Skin | cSCC | generation of precursor metabolites and energy | 224/4864 | 490/18723 | 1.13e-21 | 2.21e-19 | 224 |
| GO:0019693112 | Skin | cSCC | ribose phosphate metabolic process | 146/4864 | 396/18723 | 9.28e-07 | 1.68e-05 | 146 |
| GO:000675324 | Skin | cSCC | nucleoside phosphate metabolic process | 176/4864 | 497/18723 | 1.55e-06 | 2.62e-05 | 176 |
| GO:000911724 | Skin | cSCC | nucleotide metabolic process | 173/4864 | 489/18723 | 2.03e-06 | 3.35e-05 | 173 |
| GO:0072521112 | Skin | cSCC | purine-containing compound metabolic process | 150/4864 | 416/18723 | 2.88e-06 | 4.54e-05 | 150 |
| GO:0009259112 | Skin | cSCC | ribonucleotide metabolic process | 138/4864 | 385/18723 | 1.00e-05 | 1.30e-04 | 138 |
| GO:0006163112 | Skin | cSCC | purine nucleotide metabolic process | 140/4864 | 396/18723 | 1.93e-05 | 2.27e-04 | 140 |
| GO:0009150112 | Skin | cSCC | purine ribonucleotide metabolic process | 131/4864 | 368/18723 | 2.42e-05 | 2.76e-04 | 131 |
| GO:00065758 | Skin | cSCC | cellular modified amino acid metabolic process | 73/4864 | 188/18723 | 7.11e-05 | 6.85e-04 | 73 |
| GO:00066359 | Skin | cSCC | fatty acid beta-oxidation | 30/4864 | 74/18723 | 4.32e-03 | 2.27e-02 | 30 |
| GO:00159362 | Skin | cSCC | coenzyme A metabolic process | 10/4864 | 18/18723 | 7.25e-03 | 3.44e-02 | 10 |
| Page: 1 2 3 4 5 6 |
| Pathway ID | Tissue | Disease Stage | Description | Gene Ratio | Bg Ratio | pvalue | p.adjust | qvalue | Count |
| hsa041467 | Esophagus | ESCC | Peroxisome | 55/4205 | 82/8465 | 1.04e-03 | 3.27e-03 | 1.68e-03 | 55 |
| hsa0414612 | Esophagus | ESCC | Peroxisome | 55/4205 | 82/8465 | 1.04e-03 | 3.27e-03 | 1.68e-03 | 55 |
| hsa041464 | Liver | HCC | Peroxisome | 58/4020 | 82/8465 | 1.57e-05 | 1.05e-04 | 5.85e-05 | 58 |
| hsa041465 | Liver | HCC | Peroxisome | 58/4020 | 82/8465 | 1.57e-05 | 1.05e-04 | 5.85e-05 | 58 |
| hsa041466 | Oral cavity | OSCC | Peroxisome | 47/3704 | 82/8465 | 9.01e-03 | 2.01e-02 | 1.03e-02 | 47 |
| hsa0414611 | Oral cavity | OSCC | Peroxisome | 47/3704 | 82/8465 | 9.01e-03 | 2.01e-02 | 1.03e-02 | 47 |
| Page: 1 |
Top |
Cell-cell communication analysis |
| Identification of potential cell-cell interactions between two cell types and their ligand-receptor pairs for different disease states |
| Ligand | Receptor | LRpair | Pathway | Tissue | Disease Stage |
| Page: 1 |
Top |
Single-cell gene regulatory network inference analysis |
| Find out the significant the regulons (TFs) and the target genes of each regulon across cell types for different disease states |
| TF | Cell Type | Tissue | Disease Stage | Target Gene | RSS | Regulon Activity |
| ∗The dot plots of a searched regulon are shown for all cell subpopulations in each disease state of each tissue based on the regulon specific score inferred using pySCENIC and by calculating the average expression. |
| Page: 1 |
Top |
Somatic mutation of malignant transformation related genes |
| Annotation of somatic variants for genes involved in malignant transformation |
| Hugo Symbol | Variant Class | Variant Classification | dbSNP RS | HGVSc | HGVSp | HGVSp Short | SWISSPROT | BIOTYPE | SIFT | PolyPhen | Tumor Sample Barcode | Tissue | Histology | Sex | Age | Stage | Therapy Types | Drugs | Outcome |
| CROT | SNV | Missense_Mutation | c.1454N>T | p.Ser485Leu | p.S485L | Q9UKG9 | protein_coding | deleterious(0.02) | benign(0.209) | TCGA-A2-A0EY-01 | Breast | breast invasive carcinoma | Female | <65 | I/II | Chemotherapy | adriamycin | SD | |
| CROT | SNV | Missense_Mutation | novel | c.245T>C | p.Ile82Thr | p.I82T | Q9UKG9 | protein_coding | deleterious(0.02) | possibly_damaging(0.677) | TCGA-A2-A0YT-01 | Breast | breast invasive carcinoma | Female | <65 | III/IV | Hormone Therapy | arimidex | SD |
| CROT | SNV | Missense_Mutation | novel | c.874G>T | p.Ala292Ser | p.A292S | Q9UKG9 | protein_coding | tolerated(0.45) | benign(0.021) | TCGA-AC-A8OR-01 | Breast | breast invasive carcinoma | Female | >=65 | I/II | Unknown | Unknown | SD |
| CROT | SNV | Missense_Mutation | novel | c.1832C>T | p.Ser611Phe | p.S611F | Q9UKG9 | protein_coding | deleterious(0) | probably_damaging(0.995) | TCGA-AN-A046-01 | Breast | breast invasive carcinoma | Female | >=65 | I/II | Unknown | Unknown | SD |
| CROT | SNV | Missense_Mutation | c.217N>G | p.Gln73Glu | p.Q73E | Q9UKG9 | protein_coding | tolerated(1) | benign(0) | TCGA-B6-A0IC-01 | Breast | breast invasive carcinoma | Female | >=65 | I/II | Unknown | Unknown | SD | |
| CROT | SNV | Missense_Mutation | novel | c.1283C>A | p.Ala428Asp | p.A428D | Q9UKG9 | protein_coding | deleterious(0.05) | possibly_damaging(0.588) | TCGA-B6-A400-01 | Breast | breast invasive carcinoma | Female | <65 | III/IV | Unknown | Unknown | SD |
| CROT | insertion | Frame_Shift_Ins | novel | c.1218_1219insTTGGAAGCACCTAGTA | p.Asp407LeufsTer11 | p.D407Lfs*11 | Q9UKG9 | protein_coding | TCGA-AR-A0U0-01 | Breast | breast invasive carcinoma | Female | >=65 | I/II | Unknown | Unknown | SD | ||
| CROT | insertion | In_Frame_Ins | novel | c.1353_1354insAAA | p.Ala451_Leu452insLys | p.A451_L452insK | Q9UKG9 | protein_coding | TCGA-AR-A0U2-01 | Breast | breast invasive carcinoma | Female | <65 | III/IV | Hormone Therapy | tamoxiphen | PD | ||
| CROT | SNV | Missense_Mutation | rs751006687 | c.839G>A | p.Arg280Gln | p.R280Q | Q9UKG9 | protein_coding | deleterious(0) | probably_damaging(0.976) | TCGA-2W-A8YY-01 | Cervix | cervical & endocervical cancer | Female | <65 | I/II | Chemotherapy | cisplatin | CR |
| CROT | SNV | Missense_Mutation | c.1109T>C | p.Val370Ala | p.V370A | Q9UKG9 | protein_coding | tolerated(0.12) | benign(0.026) | TCGA-FU-A3HZ-01 | Cervix | cervical & endocervical cancer | Female | <65 | I/II | Chemotherapy | cisplatin | CR |
| Page: 1 2 3 4 5 6 7 8 9 |
Top |
Related drugs of malignant transformation related genes |
| Identification of chemicals and drugs interact with genes involved in malignant transfromation |
| (DGIdb 4.0) |
| Entrez ID | Symbol | Category | Interaction Types | Drug Claim Name | Drug Name | PMIDs |
| 54677 | CROT | DRUGGABLE GENOME | PROPIONYL-L-CARNITINE |
| Page: 1 |

Copyright 2023-Present -The University of Texas Health Science Center at Houston |