Schematic overview of the cellular and molecular mechanisms involved in the cancer progression, including the proposed cellular and molecular mechanisms in cancer cells trajectory. AT1: alveolar type 1 cells; AT2: alveolar type 2 cells; AAH: atypical adenomatous hyperplasia; AIS: adenocarcinoma in situ; MIA: minimally invasive adenocarcinoma; IA: invasive adenocarcinoma; EMT: epithelial-mesenchymal transition

Home

Download

Statistics

Help

Contact

Center for Computational Systems Medicine
leaf

Gene summary

leaf

Malignant transformation analysis

leaf

Malignant transformation related pathway analysis

leaf

Cell-cell communication analysis

leaf

Single-cell gene regulatory network inference analysis

leaf

Somatic mutation of malignant transformation related genes

leaf

Related drugs of malignant transformation related genes

Gene: COMT

Gene summary for COMT

check button Gene summary.

Gene informationSpeciesHuman
Gene symbol

COMT

Gene ID

1312

Gene namecatechol-O-methyltransferase
Gene AliasHEL-S-98n
Cytomap22q11.21
Gene Typeprotein-coding
GO ID

GO:0000003

UniProtAcc

A0A140VJG8


Top

Malignant transformation analysis

check button Identification of the aberrant gene expression in precancerous and cancerous lesions by comparing the gene expression of stem-like cells in diseased tissues with normal stem cells
check button Malignant transformation involving gene list.
Entrez IDSymbolReplicatesSpeciesOrganTissueAdj P-valueLog2FCMalignancy
1312COMTHTA11_3410_2000001011HumanColorectumAD4.24e-164.19e-010.0155
1312COMTHTA11_2487_2000001011HumanColorectumSER1.68e-105.61e-01-0.1808
1312COMTHTA11_2951_2000001011HumanColorectumAD1.32e-022.53e-010.0216
1312COMTHTA11_1938_2000001011HumanColorectumAD4.67e-127.49e-01-0.0811
1312COMTHTA11_78_2000001011HumanColorectumAD8.99e-063.30e-01-0.1088
1312COMTHTA11_347_2000001011HumanColorectumAD4.66e-195.84e-01-0.1954
1312COMTHTA11_411_2000001011HumanColorectumSER1.23e-048.15e-01-0.2602
1312COMTHTA11_696_2000001011HumanColorectumAD5.37e-186.06e-01-0.1464
1312COMTHTA11_866_2000001011HumanColorectumAD4.01e-023.17e-01-0.1001
1312COMTHTA11_1391_2000001011HumanColorectumAD2.01e-176.75e-01-0.059
1312COMTHTA11_2992_2000001011HumanColorectumSER7.40e-055.34e-01-0.1706
1312COMTHTA11_546_2000001011HumanColorectumAD3.28e-146.68e-01-0.0842
1312COMTHTA11_7862_2000001011HumanColorectumAD5.97e-032.74e-01-0.0179
1312COMTHTA11_866_3004761011HumanColorectumAD2.76e-308.09e-010.096
1312COMTHTA11_4255_2000001011HumanColorectumSER4.88e-045.12e-010.0446
1312COMTHTA11_9408_2000001011HumanColorectumAD2.66e-025.06e-010.0451
1312COMTHTA11_8622_2000001021HumanColorectumSER2.12e-128.86e-010.0528
1312COMTHTA11_7663_2000001011HumanColorectumSER1.74e-035.81e-010.0131
1312COMTHTA11_10623_2000001011HumanColorectumAD3.67e-054.74e-01-0.0177
1312COMTHTA11_6801_2000001011HumanColorectumSER1.00e-098.75e-010.0171
Page: 1 2 3 4 5 6 7 8 9 10 

check button Transcriptomic changes along malignancy continuum.
TissueExpression DynamicsAbbreviation
Colorectum (GSE201348)The image shows the transcriptomic changes along malignancy continuum.log2FC in expression of this searched gene in stem-like cells from each diseased tissue sample relative to stem-like cells in normal samples in each tissue plotted against the malignancy continuum. Samples are colored based on if they are from different disease stage.FAP: Familial adenomatous polyposis
CRC: Colorectal cancer
Colorectum (HTA11)The image shows the transcriptomic changes along malignancy continuum.log2FC in expression of this searched gene in stem-like cells from each diseased tissue sample relative to stem-like cells in normal samples in each tissue plotted against the malignancy continuum. Samples are colored based on if they are from different disease stage.AD: Adenomas
SER: Sessile serrated lesions
MSI-H: Microsatellite-high colorectal cancer
MSS: Microsatellite stable colorectal cancer
EndometriumThe image shows the transcriptomic changes along malignancy continuum.log2FC in expression of this searched gene in stem-like cells from each diseased tissue sample relative to stem-like cells in normal samples in each tissue plotted against the malignancy continuum. Samples are colored based on if they are from different disease stage.
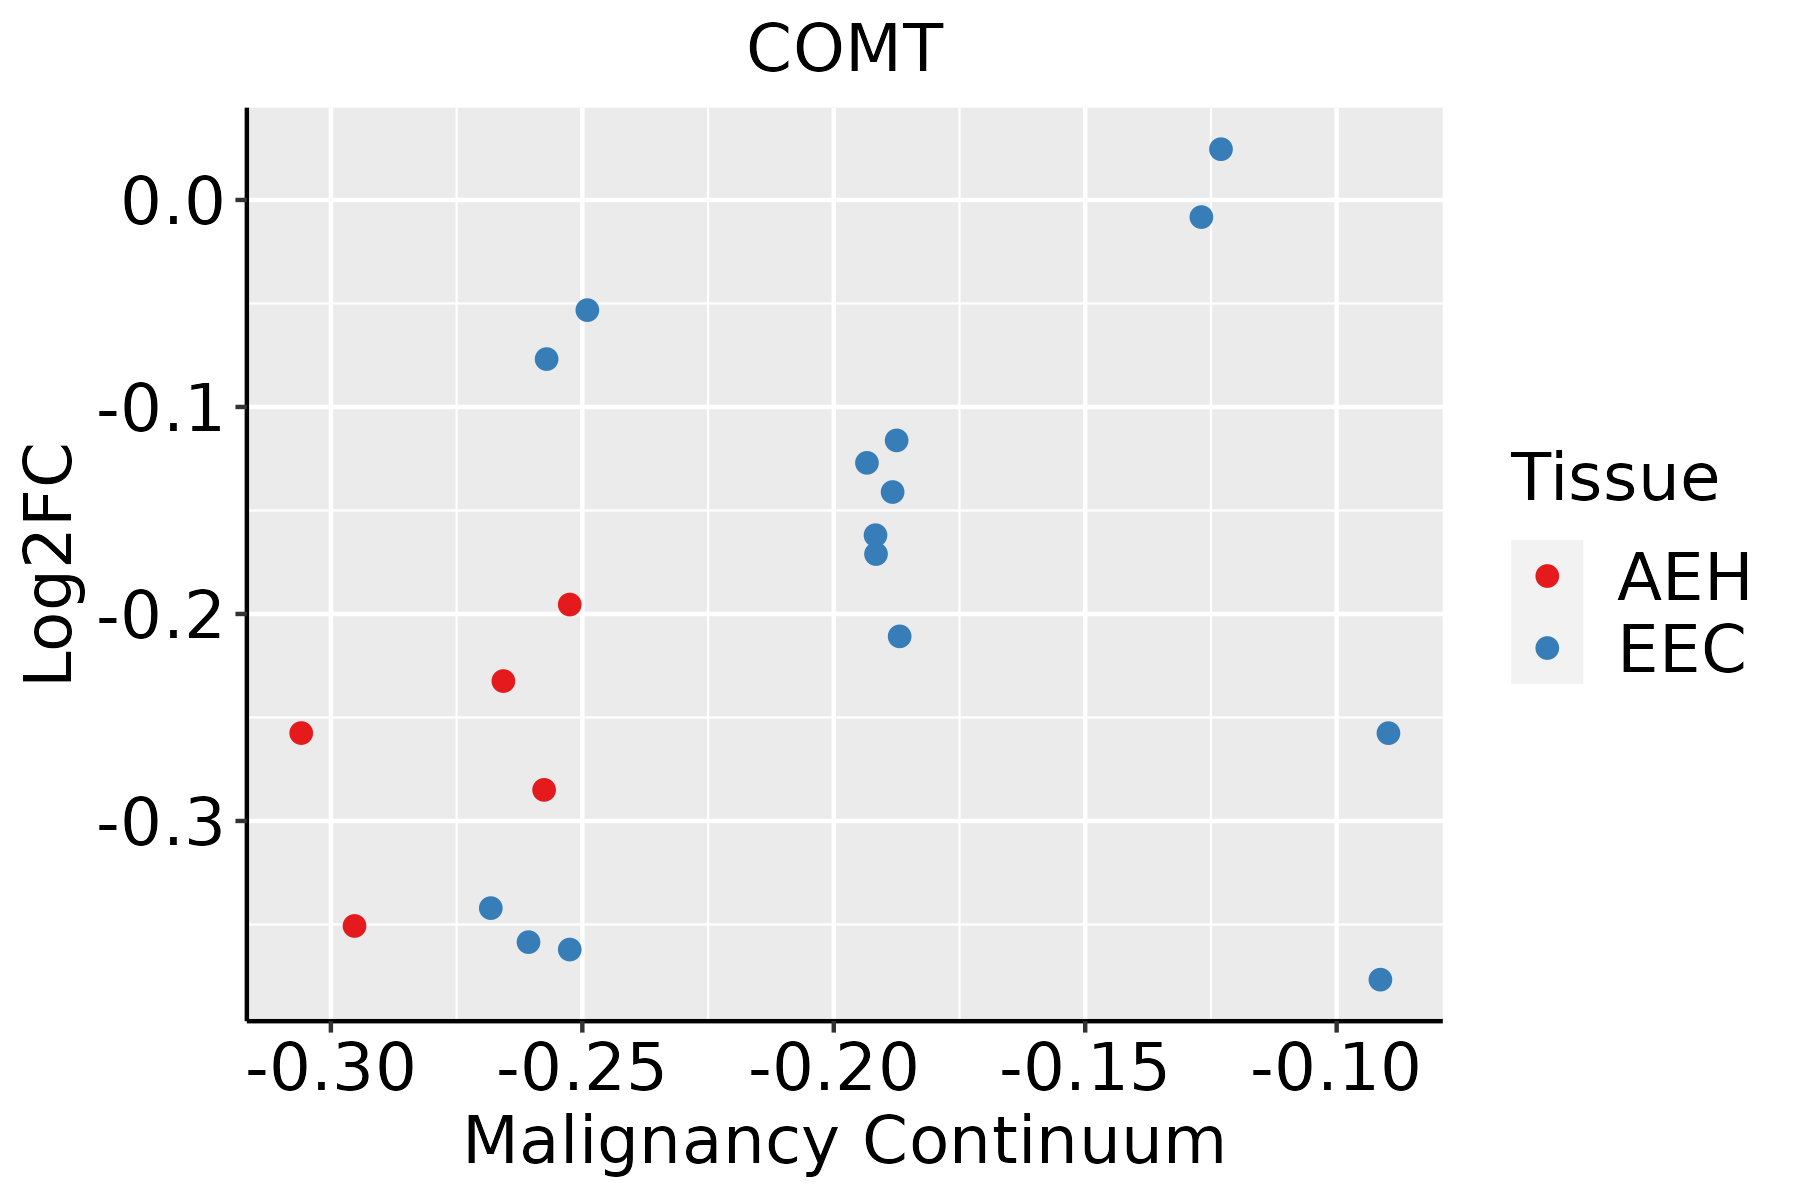
AEH: Atypical endometrial hyperplasia
EEC: Endometrioid Cancer
EsophagusThe image shows the transcriptomic changes along malignancy continuum.log2FC in expression of this searched gene in stem-like cells from each diseased tissue sample relative to stem-like cells in normal samples in each tissue plotted against the malignancy continuum. Samples are colored based on if they are from different disease stage.
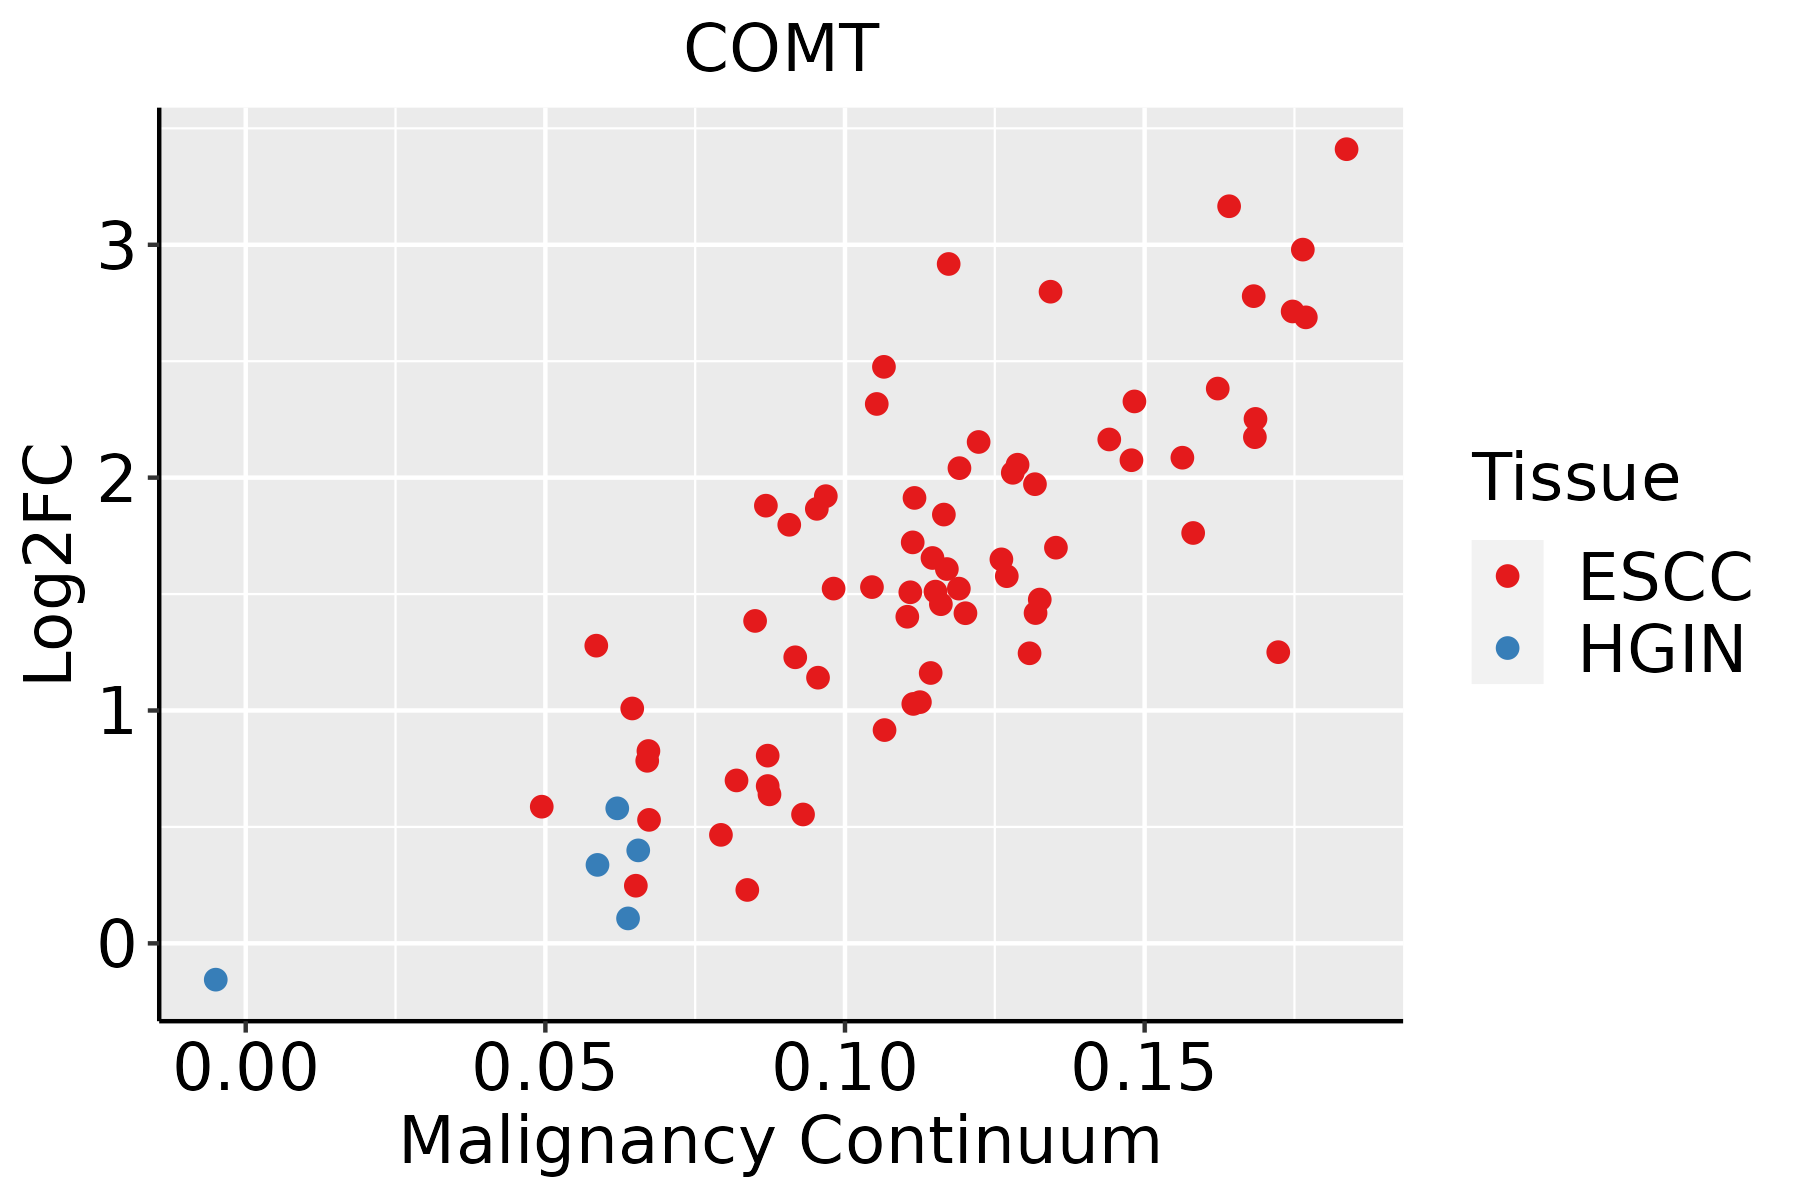
ESCC: Esophageal squamous cell carcinoma
HGIN: High-grade intraepithelial neoplasias
LGIN: Low-grade intraepithelial neoplasias
LiverThe image shows the transcriptomic changes along malignancy continuum.log2FC in expression of this searched gene in stem-like cells from each diseased tissue sample relative to stem-like cells in normal samples in each tissue plotted against the malignancy continuum. Samples are colored based on if they are from different disease stage.HCC: Hepatocellular carcinoma
NAFLD: Non-alcoholic fatty liver disease
Oral CavityThe image shows the transcriptomic changes along malignancy continuum.log2FC in expression of this searched gene in stem-like cells from each diseased tissue sample relative to stem-like cells in normal samples in each tissue plotted against the malignancy continuum. Samples are colored based on if they are from different disease stage.
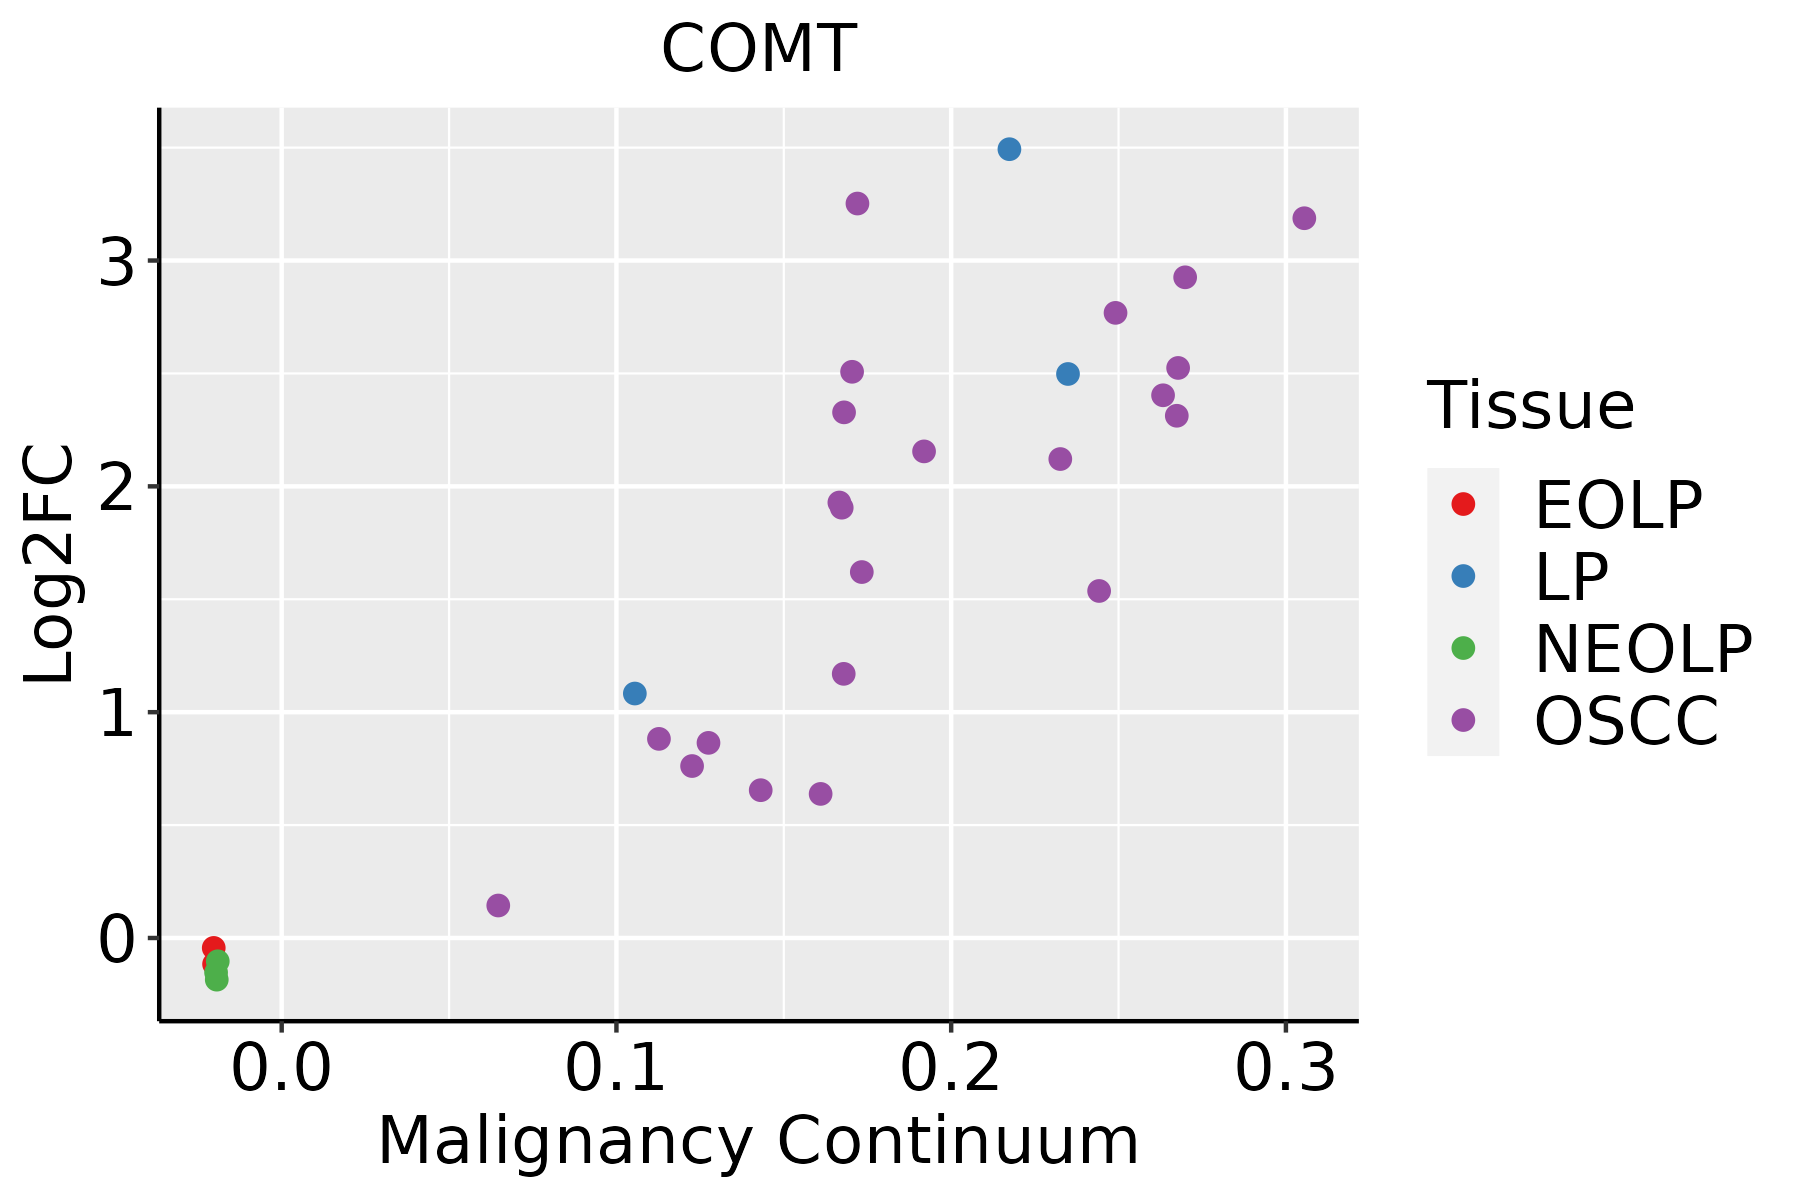
EOLP: Erosive Oral lichen planus
LP: leukoplakia
NEOLP: Non-erosive oral lichen planus
OSCC: Oral squamous cell carcinoma
ProstateThe image shows the transcriptomic changes along malignancy continuum.log2FC in expression of this searched gene in stem-like cells from each diseased tissue sample relative to stem-like cells in normal samples in each tissue plotted against the malignancy continuum. Samples are colored based on if they are from different disease stage.
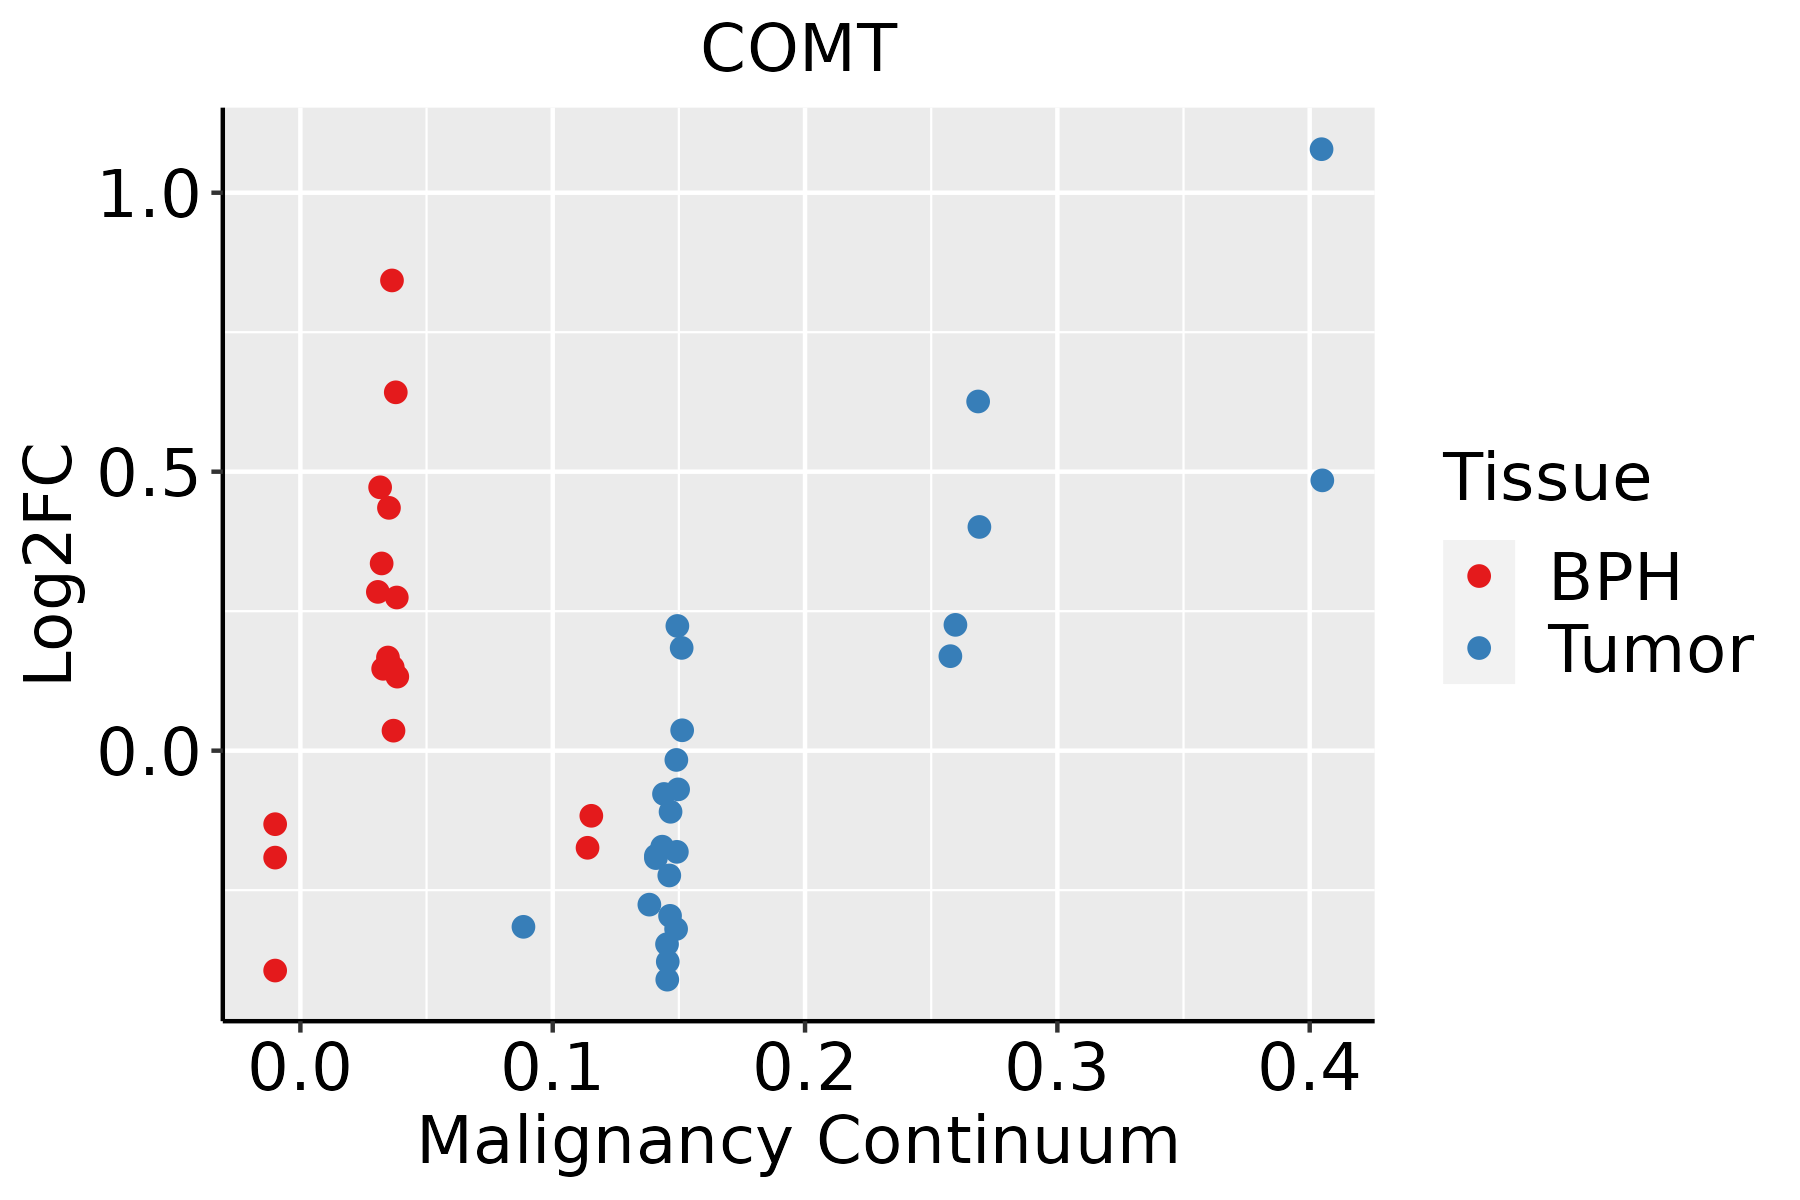
BPH: Benign Prostatic Hyperplasia
SkinThe image shows the transcriptomic changes along malignancy continuum.log2FC in expression of this searched gene in stem-like cells from each diseased tissue sample relative to stem-like cells in normal samples in each tissue plotted against the malignancy continuum. Samples are colored based on if they are from different disease stage.AK: Actinic keratosis
cSCC: Cutaneous squamous cell carcinoma
SCCIS:squamous cell carcinoma in situ
ThyroidThe image shows the transcriptomic changes along malignancy continuum.log2FC in expression of this searched gene in stem-like cells from each diseased tissue sample relative to stem-like cells in normal samples in each tissue plotted against the malignancy continuum. Samples are colored based on if they are from different disease stage.ATC: Anaplastic thyroid cancer
HT: Hashimoto's thyroiditis
PTC: Papillary thyroid cancer
∗log2FC in expression of this searched gene in stem-like cells from each diseased tissue sample relative to stem-like cells in normal samples in each tissue plotted against the malignancy continuum. Samples are colored based on if they are from different disease stage.

Top

Malignant transformation related pathway analysis

check buttonFind out the enriched GO biological processes and KEGG pathways involved in transition from healthy to precancer to cancer
check button Figure of enriched GO biological processes.
TissueDisease StageEnriched GO biological Processes
ColorectumADGO analysis - Figure of enriched GO biological processes: Top 15 enriched GO BP terms are showed in the bar plot of each disease state in each tissue. Each row represents a significant GO biological process which is colored according to the -log10(p.adjust).
ColorectumSERGO analysis - Figure of enriched GO biological processes: Top 15 enriched GO BP terms are showed in the bar plot of each disease state in each tissue. Each row represents a significant GO biological process which is colored according to the -log10(p.adjust).
ColorectumMSSGO analysis - Figure of enriched GO biological processes: Top 15 enriched GO BP terms are showed in the bar plot of each disease state in each tissue. Each row represents a significant GO biological process which is colored according to the -log10(p.adjust).
ColorectumMSI-HGO analysis - Figure of enriched GO biological processes: Top 15 enriched GO BP terms are showed in the bar plot of each disease state in each tissue. Each row represents a significant GO biological process which is colored according to the -log10(p.adjust).
ColorectumFAPGO analysis - Figure of enriched GO biological processes: Top 15 enriched GO BP terms are showed in the bar plot of each disease state in each tissue. Each row represents a significant GO biological process which is colored according to the -log10(p.adjust).
∗Top 15 enriched GO BP terms are showed in the bar plot of each disease state in each tissue. Each row represents a significant GO biological process which is colored according to the -log10(p.adjust).
Page: 1 2 3 4 5 6 7 8 9 

check button Enriched GO biological processes.
GO IDTissueDisease StageDescriptionGene RatioBg Ratiopvaluep.adjustCount
GO:004866013EndometriumEECregulation of smooth muscle cell proliferation43/2168180/187232.54e-067.35e-0543
GO:004865913EndometriumEECsmooth muscle cell proliferation43/2168184/187234.65e-061.16e-0443
GO:000756513EndometriumEECfemale pregnancy43/2168193/187231.66e-053.18e-0443
GO:000223714EndometriumEECresponse to molecule of bacterial origin68/2168363/187233.96e-056.64e-0468
GO:003249614EndometriumEECresponse to lipopolysaccharide65/2168343/187234.04e-056.75e-0465
GO:001943913EndometriumEECaromatic compound catabolic process83/2168467/187234.32e-057.10e-0483
GO:007149617EndometriumEECcellular response to external stimulus61/2168320/187235.76e-058.97e-0461
GO:00330021EndometriumEECmuscle cell proliferation50/2168248/187236.08e-059.21e-0450
GO:190136113EndometriumEECorganic cyclic compound catabolic process86/2168495/187237.31e-051.07e-0386
GO:004470612EndometriumEECmulti-multicellular organism process45/2168220/187239.73e-051.35e-0345
GO:003166717EndometriumEECresponse to nutrient levels82/2168474/187231.23e-041.64e-0382
GO:005105111EndometriumEECnegative regulation of transport80/2168470/187232.53e-042.93e-0380
GO:003166916EndometriumEECcellular response to nutrient levels41/2168215/187238.72e-047.97e-0341
GO:003166816EndometriumEECcellular response to extracellular stimulus45/2168246/187231.24e-031.03e-0245
GO:000926715EndometriumEECcellular response to starvation31/2168156/187231.80e-031.39e-0231
GO:000941015EndometriumEECresponse to xenobiotic stimulus73/2168462/187233.55e-032.38e-0273
GO:004259414EndometriumEECresponse to starvation36/2168197/187233.66e-032.45e-0236
GO:00486621EndometriumEECnegative regulation of smooth muscle cell proliferation17/216875/187234.71e-032.99e-0217
GO:0071496111EsophagusESCCcellular response to external stimulus215/8552320/187234.29e-152.43e-13215
GO:001943918EsophagusESCCaromatic compound catabolic process295/8552467/187231.09e-145.98e-13295
Page: 1 2 3 4 5 6 7 8 9 10 11 12 13 14 15 

check button Enriched KEGG pathways.
Pathway IDTissueDisease StageDescriptionGene RatioBg Ratiopvaluep.adjustqvalueCount
hsa04728ColorectumADDopaminergic synapse46/2092132/84655.55e-032.48e-021.58e-0246
hsa047281ColorectumADDopaminergic synapse46/2092132/84655.55e-032.48e-021.58e-0246
hsa047282ColorectumSERDopaminergic synapse37/1580132/84655.27e-033.28e-022.38e-0237
hsa047283ColorectumSERDopaminergic synapse37/1580132/84655.27e-033.28e-022.38e-0237
hsa047284ColorectumMSSDopaminergic synapse45/1875132/84651.02e-035.94e-033.64e-0345
hsa047285ColorectumMSSDopaminergic synapse45/1875132/84651.02e-035.94e-033.64e-0345
hsa0472810ProstateBPHDopaminergic synapse38/1718132/84651.19e-023.55e-022.20e-0238
hsa0472811ProstateBPHDopaminergic synapse38/1718132/84651.19e-023.55e-022.20e-0238
Page: 1 

Top

Cell-cell communication analysis

check buttonIdentification of potential cell-cell interactions between two cell types and their ligand-receptor pairs for different disease states
LigandReceptorLRpairPathwayTissueDisease Stage
Page: 1 

Top

Single-cell gene regulatory network inference analysis

check buttonFind out the significant the regulons (TFs) and the target genes of each regulon across cell types for different disease states
TFCell TypeTissueDisease StageTarget GeneRSSRegulon Activity
∗The dot plots of a searched regulon are shown for all cell subpopulations in each disease state of each tissue based on the regulon specific score inferred using pySCENIC and by calculating the average expression.
Page: 1 

Top

Somatic mutation of malignant transformation related genes

check buttonAnnotation of somatic variants for genes involved in malignant transformation
Hugo SymbolVariant ClassVariant ClassificationdbSNP RSHGVScHGVSpHGVSp ShortSWISSPROTBIOTYPESIFTPolyPhenTumor Sample BarcodeTissueHistologySexAgeStageTherapy TypesDrugsOutcome
COMTSNVMissense_Mutationc.115N>Gp.Asn39Aspp.N39DP21964protein_codingtolerated(0.07)benign(0.039)TCGA-B6-A0WV-01Breastbreast invasive carcinomaFemale>=65I/IIUnknownUnknownSD
COMTSNVMissense_Mutationc.115N>Gp.Asn39Aspp.N39DP21964protein_codingtolerated(0.07)benign(0.039)TCGA-HN-A2NL-01Breastbreast invasive carcinomaFemale<65I/IIChemotherapycyclophosphamideSD
COMTSNVMissense_Mutationnovelc.490C>Ap.Leu164Ilep.L164IP21964protein_codingtolerated(0.52)benign(0.006)TCGA-A5-A0G2-01Endometriumuterine corpus endometrioid carcinomaFemale<65III/IVUnknownUnknownSD
COMTSNVMissense_Mutationrs766020740c.368N>Ap.Ala123Aspp.A123DP21964protein_codingdeleterious(0)probably_damaging(0.976)TCGA-A5-A1OF-01Endometriumuterine corpus endometrioid carcinomaFemale<65I/IIUnknownUnknownSD
COMTSNVMissense_Mutationrs752035611c.727C>Tp.His243Tyrp.H243YP21964protein_codingtolerated(0.65)benign(0)TCGA-AP-A059-01Endometriumuterine corpus endometrioid carcinomaFemale>=65I/IIUnknownUnknownSD
COMTSNVMissense_Mutationnovelc.595N>Tp.Pro199Serp.P199SP21964protein_codingdeleterious(0.02)possibly_damaging(0.876)TCGA-BG-A222-01Endometriumuterine corpus endometrioid carcinomaFemale<65I/IIUnknownUnknownSD
COMTSNVMissense_Mutationc.285G>Tp.Lys95Asnp.K95NP21964protein_codingtolerated(0.07)possibly_damaging(0.474)TCGA-BS-A0UV-01Endometriumuterine corpus endometrioid carcinomaFemale<65III/IVUnknownUnknownSD
COMTSNVMissense_Mutationnovelc.275N>Gp.Val92Glyp.V92GP21964protein_codingdeleterious(0)probably_damaging(0.998)TCGA-95-7567-01Lunglung adenocarcinomaMale<65I/IIChemotherapycisplatinSD
COMTSNVMissense_Mutationnovelc.718G>Cp.Glu240Glnp.E240QP21964protein_codingtolerated(0.1)benign(0.019)TCGA-98-A539-01Lunglung squamous cell carcinomaMale<65I/IIUnknownUnknownPD
COMTSNVMissense_Mutationnovelc.428N>Tp.Pro143Leup.P143LP21964protein_codingdeleterious(0)possibly_damaging(0.905)TCGA-CV-A460-01Oral cavityhead & neck squamous cell carcinomaMale>=65I/IIUnknownUnknownPD
Page: 1 2 

Top

Related drugs of malignant transformation related genes

check buttonIdentification of chemicals and drugs interact with genes involved in malignant transfromation
(DGIdb 4.0)
Entrez IDSymbolCategoryInteraction TypesDrug Claim NameDrug NamePMIDs
1312COMTDRUGGABLE GENOME, ENZYMEfluvoxamineFLUVOXAMINE20619611
1312COMTDRUGGABLE GENOME, ENZYMEmethylphenidateMETHYLPHENIDATE29230023,23131881,24763183,18214865,18703939,22149470,24035255,21550019
1312COMTDRUGGABLE GENOME, ENZYMEOpicaponeOPICAPONE
1312COMTDRUGGABLE GENOME, ENZYMETOLCAPONETOLCAPONE
1312COMTDRUGGABLE GENOME, ENZYMEENTACAPONEENTACAPONE
1312COMTDRUGGABLE GENOME, ENZYMEEntacaponeENTACAPONE
1312COMTDRUGGABLE GENOME, ENZYMEENTACAPONEENTACAPONE
1312COMTDRUGGABLE GENOME, ENZYMEmethadoneMETHADONE28006928,32407152,23686330,21398039,23302985,26902643,29474345,23773341,25155931,25185591,19514130,28745577,27027462
1312COMTDRUGGABLE GENOME, ENZYMEoxycodoneOXYCODONE28006928,23686330,21398039,23302985,26902643,29474345,23773341,25155931,25185591,19514130,28745577,27027462
1312COMTDRUGGABLE GENOME, ENZYMEAnalgesics25096645
Page: 1 2 3 4 5 6