
|
|||||
|
 | |
| |
| |
| |
| |
| |
|
Gene: CFTR |
Gene summary for CFTR |
| Gene information | Species | Human | Gene symbol | CFTR | Gene ID | 1080 |
| Gene name | CF transmembrane conductance regulator | |
| Gene Alias | ABC35 | |
| Cytomap | 7q31.2 | |
| Gene Type | protein-coding | GO ID | GO:0000003 | UniProtAcc | A0A024R730 |
Top |
Malignant transformation analysis |
| Identification of the aberrant gene expression in precancerous and cancerous lesions by comparing the gene expression of stem-like cells in diseased tissues with normal stem cells |
| Entrez ID | Symbol | Replicates | Species | Organ | Tissue | Adj P-value | Log2FC | Malignancy |
| 1080 | CFTR | HTA11_3410_2000001011 | Human | Colorectum | AD | 1.64e-30 | -7.59e-01 | 0.0155 |
| 1080 | CFTR | HTA11_2487_2000001011 | Human | Colorectum | SER | 5.66e-07 | -5.59e-01 | -0.1808 |
| 1080 | CFTR | HTA11_2951_2000001011 | Human | Colorectum | AD | 9.26e-12 | -1.14e+00 | 0.0216 |
| 1080 | CFTR | HTA11_78_2000001011 | Human | Colorectum | AD | 6.15e-08 | 2.88e-01 | -0.1088 |
| 1080 | CFTR | HTA11_347_2000001011 | Human | Colorectum | AD | 2.87e-11 | 6.95e-01 | -0.1954 |
| 1080 | CFTR | HTA11_2112_2000001011 | Human | Colorectum | SER | 2.04e-02 | -6.21e-01 | -0.2196 |
| 1080 | CFTR | HTA11_3361_2000001011 | Human | Colorectum | AD | 5.13e-30 | -1.21e+00 | -0.1207 |
| 1080 | CFTR | HTA11_83_2000001011 | Human | Colorectum | SER | 4.00e-03 | -1.12e-01 | -0.1526 |
| 1080 | CFTR | HTA11_696_2000001011 | Human | Colorectum | AD | 1.44e-16 | -5.56e-01 | -0.1464 |
| 1080 | CFTR | HTA11_866_2000001011 | Human | Colorectum | AD | 5.48e-06 | -3.01e-01 | -0.1001 |
| 1080 | CFTR | HTA11_1391_2000001011 | Human | Colorectum | AD | 1.32e-02 | -2.93e-01 | -0.059 |
| 1080 | CFTR | HTA11_5212_2000001011 | Human | Colorectum | AD | 5.87e-08 | -7.74e-01 | -0.2061 |
| 1080 | CFTR | HTA11_866_3004761011 | Human | Colorectum | AD | 2.55e-05 | -3.35e-01 | 0.096 |
| 1080 | CFTR | HTA11_4255_2000001011 | Human | Colorectum | SER | 2.03e-03 | -6.17e-01 | 0.0446 |
| 1080 | CFTR | HTA11_9408_2000001011 | Human | Colorectum | AD | 2.65e-02 | -6.26e-01 | 0.0451 |
| 1080 | CFTR | HTA11_8622_2000001021 | Human | Colorectum | SER | 2.03e-07 | -7.73e-01 | 0.0528 |
| 1080 | CFTR | HTA11_10711_2000001011 | Human | Colorectum | AD | 4.06e-04 | -4.86e-01 | 0.0338 |
| 1080 | CFTR | HTA11_7696_3000711011 | Human | Colorectum | AD | 2.07e-06 | -3.40e-01 | 0.0674 |
| 1080 | CFTR | HTA11_11156_2000001011 | Human | Colorectum | AD | 1.24e-04 | -1.02e+00 | 0.0397 |
| 1080 | CFTR | HTA11_6818_2000001021 | Human | Colorectum | AD | 1.46e-02 | 1.95e-01 | 0.0588 |
| Page: 1 2 3 4 |
| Tissue | Expression Dynamics | Abbreviation |
| Colorectum (GSE201348) | 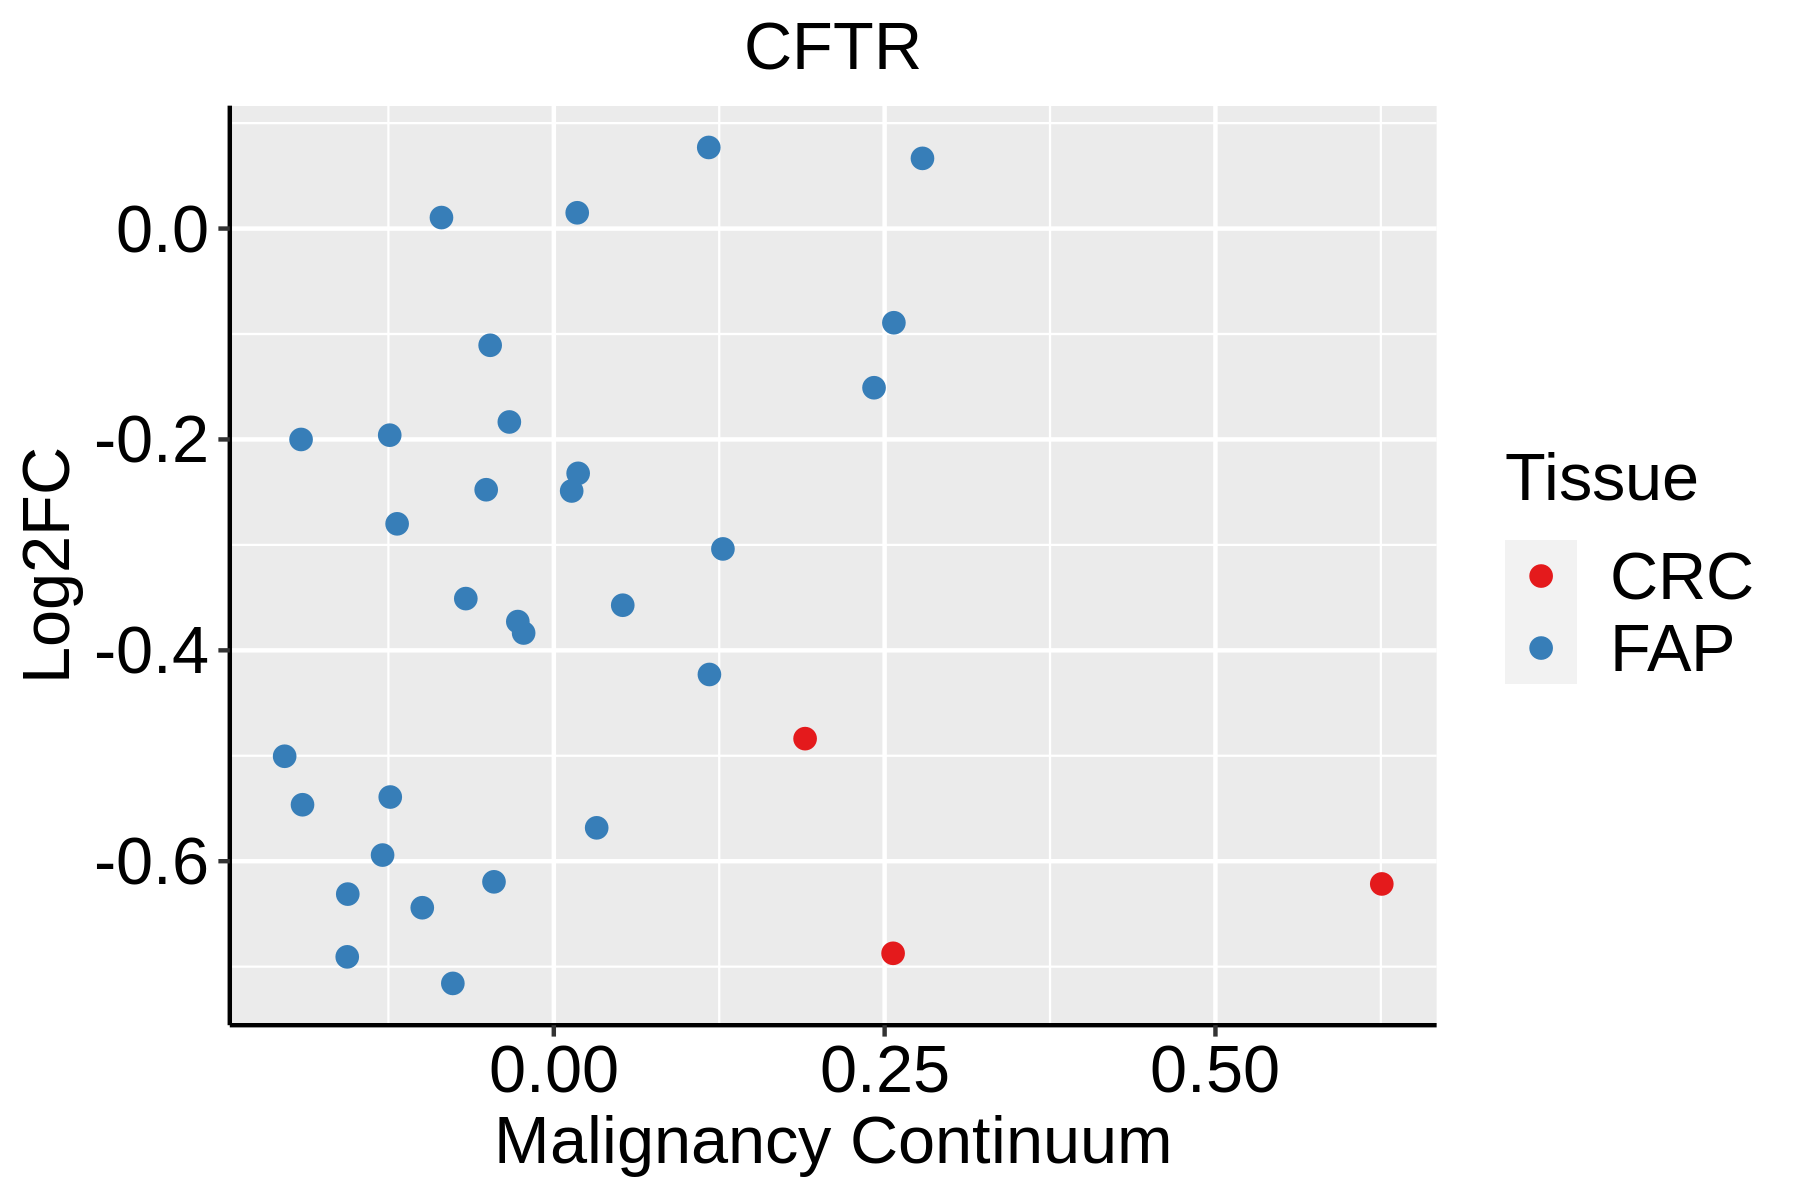 | FAP: Familial adenomatous polyposis |
| CRC: Colorectal cancer | ||
| Colorectum (HTA11) |  | AD: Adenomas |
| SER: Sessile serrated lesions | ||
| MSI-H: Microsatellite-high colorectal cancer | ||
| MSS: Microsatellite stable colorectal cancer | ||
| Endometrium | 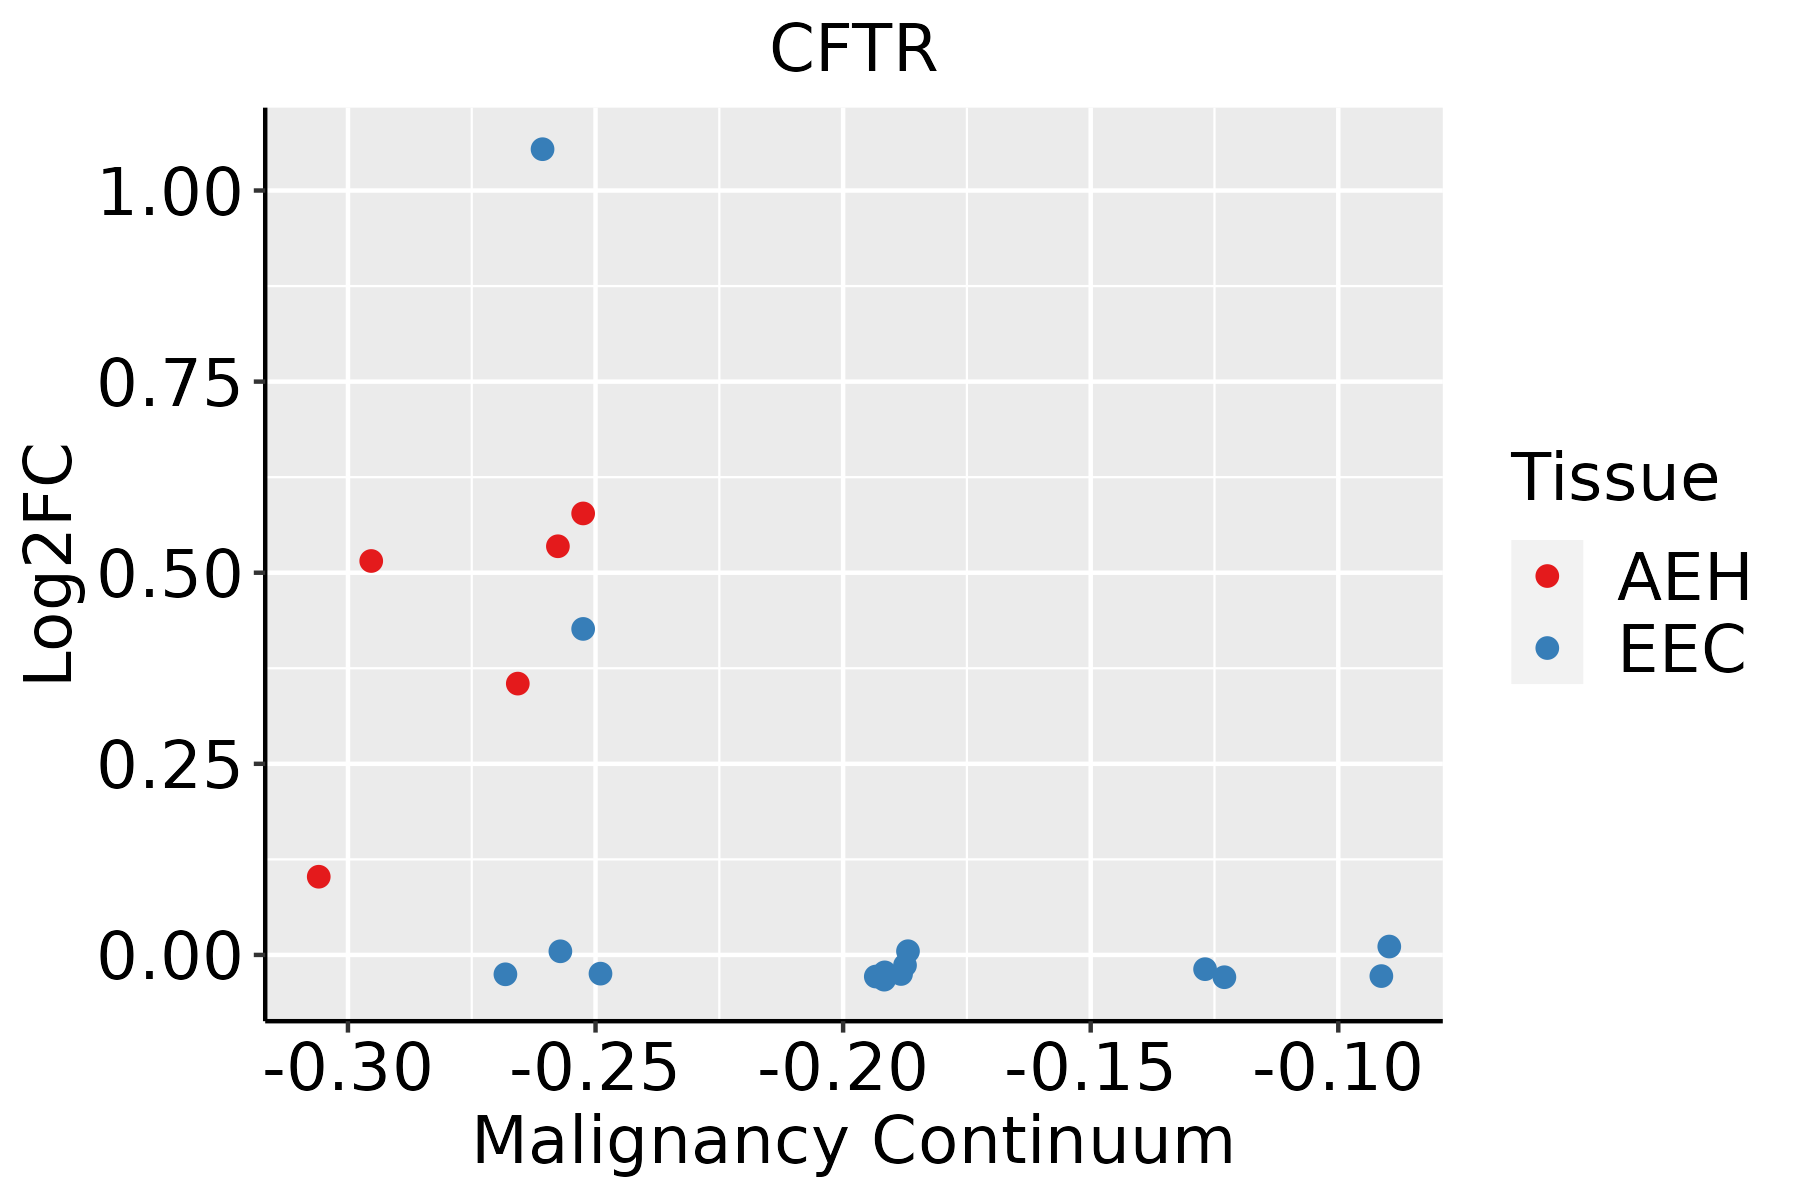 | AEH: Atypical endometrial hyperplasia |
| EEC: Endometrioid Cancer | ||
| Liver | 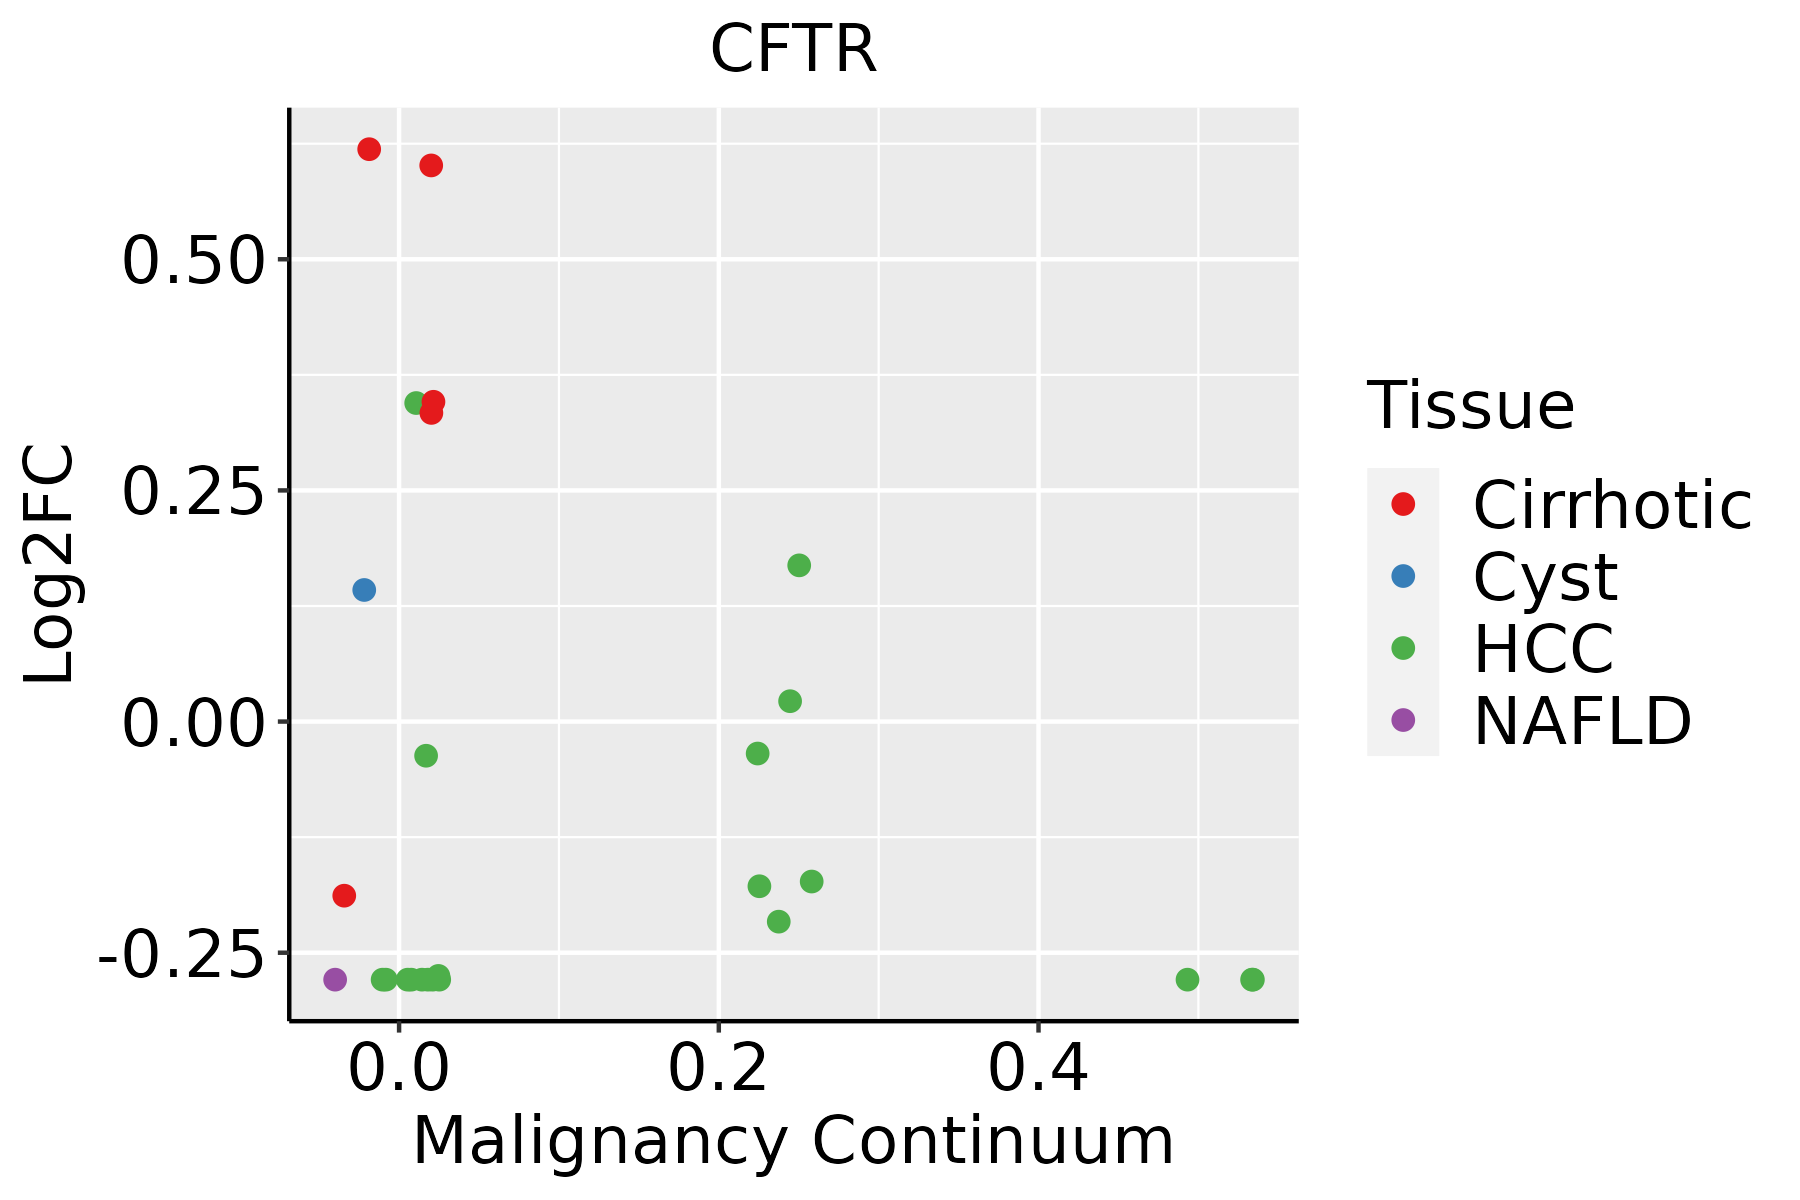 | HCC: Hepatocellular carcinoma |
| NAFLD: Non-alcoholic fatty liver disease | ||
| Lung | 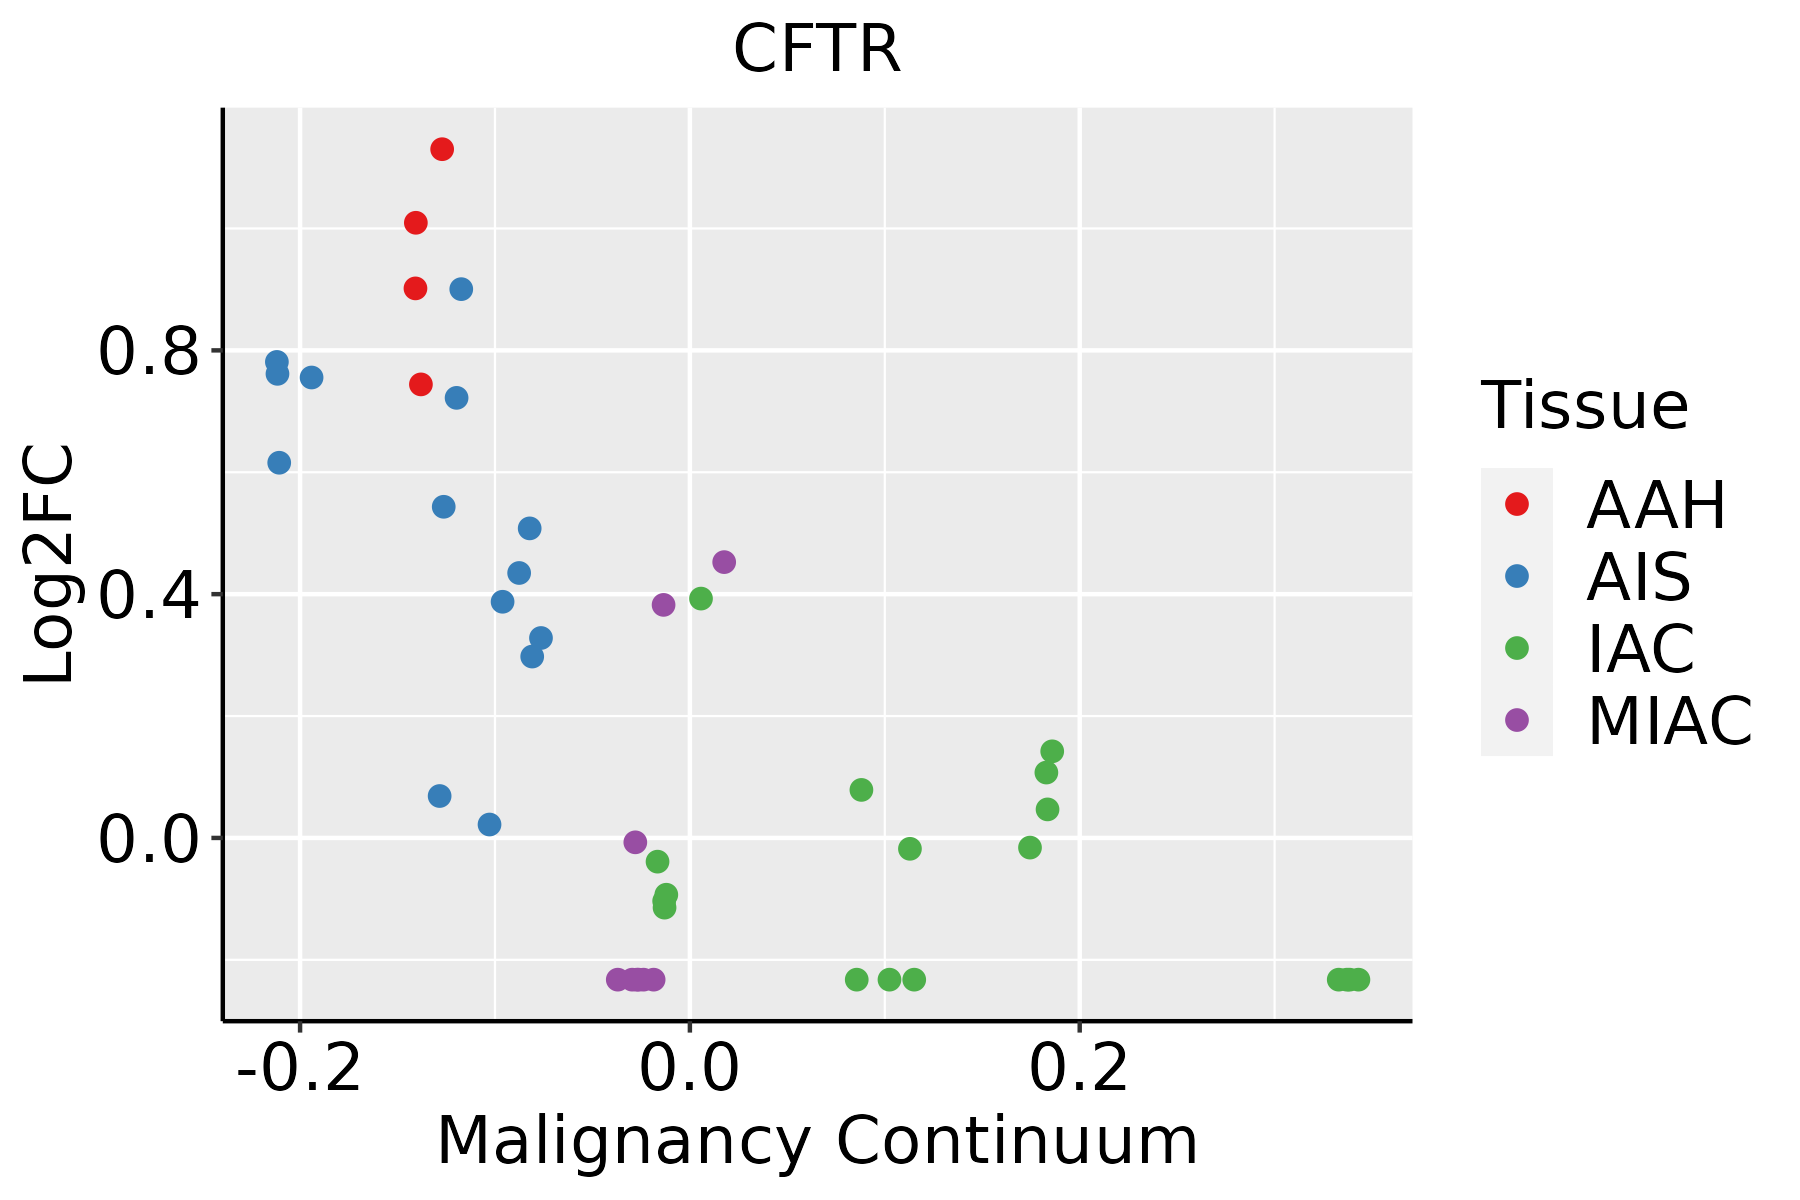 | AAH: Atypical adenomatous hyperplasia |
| AIS: Adenocarcinoma in situ | ||
| IAC: Invasive lung adenocarcinoma | ||
| MIA: Minimally invasive adenocarcinoma |
| ∗log2FC in expression of this searched gene in stem-like cells from each diseased tissue sample relative to stem-like cells in normal samples in each tissue plotted against the malignancy continuum. Samples are colored based on if they are from different disease stage. |
Top |
Malignant transformation related pathway analysis |
| Find out the enriched GO biological processes and KEGG pathways involved in transition from healthy to precancer to cancer |
| Tissue | Disease Stage | Enriched GO biological Processes |
| Colorectum | AD |  |
| Colorectum | SER |  |
| Colorectum | MSS |  |
| Colorectum | MSI-H |  |
| Colorectum | FAP |  |
| ∗Top 15 enriched GO BP terms are showed in the bar plot of each disease state in each tissue. Each row represents a significant GO biological process which is colored according to the -log10(p.adjust). |
| Page: 1 2 3 4 5 6 7 8 9 |
| GO ID | Tissue | Disease Stage | Description | Gene Ratio | Bg Ratio | pvalue | p.adjust | Count |
| GO:00713311 | Colorectum | SER | cellular response to hexose stimulus | 37/2897 | 153/18723 | 3.15e-03 | 2.73e-02 | 37 |
| GO:00335001 | Colorectum | SER | carbohydrate homeostasis | 57/2897 | 259/18723 | 3.20e-03 | 2.76e-02 | 57 |
| GO:00713261 | Colorectum | SER | cellular response to monosaccharide stimulus | 37/2897 | 154/18723 | 3.55e-03 | 3.00e-02 | 37 |
| GO:00900871 | Colorectum | SER | regulation of peptide transport | 46/2897 | 202/18723 | 3.86e-03 | 3.18e-02 | 46 |
| GO:00514531 | Colorectum | SER | regulation of intracellular pH | 21/2897 | 75/18723 | 3.97e-03 | 3.26e-02 | 21 |
| GO:00016781 | Colorectum | SER | cellular glucose homeostasis | 40/2897 | 172/18723 | 4.61e-03 | 3.65e-02 | 40 |
| GO:19016541 | Colorectum | SER | response to ketone | 44/2897 | 194/18723 | 5.01e-03 | 3.88e-02 | 44 |
| GO:00068851 | Colorectum | SER | regulation of pH | 24/2897 | 91/18723 | 5.03e-03 | 3.88e-02 | 24 |
| GO:00713201 | Colorectum | SER | cellular response to cAMP | 16/2897 | 53/18723 | 5.09e-03 | 3.91e-02 | 16 |
| GO:00027911 | Colorectum | SER | regulation of peptide secretion | 45/2897 | 200/18723 | 5.35e-03 | 4.03e-02 | 45 |
| GO:00713221 | Colorectum | SER | cellular response to carbohydrate stimulus | 38/2897 | 163/18723 | 5.41e-03 | 4.03e-02 | 38 |
| GO:0032409 | Colorectum | SER | regulation of transporter activity | 65/2897 | 310/18723 | 5.71e-03 | 4.19e-02 | 65 |
| GO:00510471 | Colorectum | SER | positive regulation of secretion | 65/2897 | 310/18723 | 5.71e-03 | 4.19e-02 | 65 |
| GO:00902761 | Colorectum | SER | regulation of peptide hormone secretion | 44/2897 | 196/18723 | 6.08e-03 | 4.42e-02 | 44 |
| GO:00357731 | Colorectum | SER | insulin secretion involved in cellular response to glucose stimulus | 20/2897 | 73/18723 | 6.34e-03 | 4.56e-02 | 20 |
| GO:00171571 | Colorectum | SER | regulation of exocytosis | 45/2897 | 202/18723 | 6.46e-03 | 4.63e-02 | 45 |
| GO:00611781 | Colorectum | SER | regulation of insulin secretion involved in cellular response to glucose stimulus | 18/2897 | 64/18723 | 6.98e-03 | 4.92e-02 | 18 |
| GO:19049512 | Colorectum | MSS | positive regulation of establishment of protein localization | 110/3467 | 319/18723 | 6.30e-12 | 9.83e-10 | 110 |
| GO:00512222 | Colorectum | MSS | positive regulation of protein transport | 104/3467 | 303/18723 | 3.23e-11 | 4.11e-09 | 104 |
| GO:00349762 | Colorectum | MSS | response to endoplasmic reticulum stress | 81/3467 | 256/18723 | 2.65e-07 | 1.10e-05 | 81 |
| Page: 1 2 3 4 5 6 7 8 9 10 11 12 13 14 15 16 17 18 19 20 21 22 |
| Pathway ID | Tissue | Disease Stage | Description | Gene Ratio | Bg Ratio | pvalue | p.adjust | qvalue | Count |
| hsa04530 | Colorectum | AD | Tight junction | 76/2092 | 169/8465 | 5.49e-09 | 9.69e-08 | 6.18e-08 | 76 |
| hsa05110 | Colorectum | AD | Vibrio cholerae infection | 29/2092 | 50/8465 | 5.10e-07 | 7.12e-06 | 4.54e-06 | 29 |
| hsa04152 | Colorectum | AD | AMPK signaling pathway | 47/2092 | 121/8465 | 3.74e-04 | 2.82e-03 | 1.80e-03 | 47 |
| hsa04971 | Colorectum | AD | Gastric acid secretion | 29/2092 | 76/8465 | 6.25e-03 | 2.68e-02 | 1.71e-02 | 29 |
| hsa04972 | Colorectum | AD | Pancreatic secretion | 36/2092 | 102/8465 | 1.06e-02 | 3.98e-02 | 2.54e-02 | 36 |
| hsa045301 | Colorectum | AD | Tight junction | 76/2092 | 169/8465 | 5.49e-09 | 9.69e-08 | 6.18e-08 | 76 |
| hsa051101 | Colorectum | AD | Vibrio cholerae infection | 29/2092 | 50/8465 | 5.10e-07 | 7.12e-06 | 4.54e-06 | 29 |
| hsa041521 | Colorectum | AD | AMPK signaling pathway | 47/2092 | 121/8465 | 3.74e-04 | 2.82e-03 | 1.80e-03 | 47 |
| hsa049711 | Colorectum | AD | Gastric acid secretion | 29/2092 | 76/8465 | 6.25e-03 | 2.68e-02 | 1.71e-02 | 29 |
| hsa049721 | Colorectum | AD | Pancreatic secretion | 36/2092 | 102/8465 | 1.06e-02 | 3.98e-02 | 2.54e-02 | 36 |
| hsa045302 | Colorectum | SER | Tight junction | 59/1580 | 169/8465 | 3.24e-07 | 5.98e-06 | 4.34e-06 | 59 |
| hsa051102 | Colorectum | SER | Vibrio cholerae infection | 24/1580 | 50/8465 | 2.17e-06 | 3.13e-05 | 2.28e-05 | 24 |
| hsa049712 | Colorectum | SER | Gastric acid secretion | 27/1580 | 76/8465 | 3.65e-04 | 3.27e-03 | 2.38e-03 | 27 |
| hsa049722 | Colorectum | SER | Pancreatic secretion | 30/1580 | 102/8465 | 5.41e-03 | 3.28e-02 | 2.38e-02 | 30 |
| hsa045303 | Colorectum | SER | Tight junction | 59/1580 | 169/8465 | 3.24e-07 | 5.98e-06 | 4.34e-06 | 59 |
| hsa051103 | Colorectum | SER | Vibrio cholerae infection | 24/1580 | 50/8465 | 2.17e-06 | 3.13e-05 | 2.28e-05 | 24 |
| hsa049713 | Colorectum | SER | Gastric acid secretion | 27/1580 | 76/8465 | 3.65e-04 | 3.27e-03 | 2.38e-03 | 27 |
| hsa049723 | Colorectum | SER | Pancreatic secretion | 30/1580 | 102/8465 | 5.41e-03 | 3.28e-02 | 2.38e-02 | 30 |
| hsa045304 | Colorectum | MSS | Tight junction | 66/1875 | 169/8465 | 4.10e-07 | 6.25e-06 | 3.83e-06 | 66 |
| hsa051104 | Colorectum | MSS | Vibrio cholerae infection | 27/1875 | 50/8465 | 8.58e-07 | 1.20e-05 | 7.34e-06 | 27 |
| Page: 1 2 3 4 |
Top |
Cell-cell communication analysis |
| Identification of potential cell-cell interactions between two cell types and their ligand-receptor pairs for different disease states |
| Ligand | Receptor | LRpair | Pathway | Tissue | Disease Stage |
| Page: 1 |
Top |
Single-cell gene regulatory network inference analysis |
| Find out the significant the regulons (TFs) and the target genes of each regulon across cell types for different disease states |
| TF | Cell Type | Tissue | Disease Stage | Target Gene | RSS | Regulon Activity |
| ∗The dot plots of a searched regulon are shown for all cell subpopulations in each disease state of each tissue based on the regulon specific score inferred using pySCENIC and by calculating the average expression. |
| Page: 1 |
Top |
Somatic mutation of malignant transformation related genes |
| Annotation of somatic variants for genes involved in malignant transformation |
| Hugo Symbol | Variant Class | Variant Classification | dbSNP RS | HGVSc | HGVSp | HGVSp Short | SWISSPROT | BIOTYPE | SIFT | PolyPhen | Tumor Sample Barcode | Tissue | Histology | Sex | Age | Stage | Therapy Types | Drugs | Outcome |
| CFTR | SNV | Missense_Mutation | c.311N>C | p.Arg104Thr | p.R104T | P13569 | protein_coding | deleterious(0.03) | probably_damaging(0.997) | TCGA-AC-A23H-01 | Breast | breast invasive carcinoma | Female | >=65 | I/II | Unknown | Unknown | PD | |
| CFTR | SNV | Missense_Mutation | c.3568N>C | p.Val1190Leu | p.V1190L | P13569 | protein_coding | tolerated(0.27) | benign(0.156) | TCGA-AC-A23H-01 | Breast | breast invasive carcinoma | Female | >=65 | I/II | Unknown | Unknown | PD | |
| CFTR | SNV | Missense_Mutation | rs397508381 | c.2476G>A | p.Glu826Lys | p.E826K | P13569 | protein_coding | deleterious(0.01) | probably_damaging(0.954) | TCGA-AN-A046-01 | Breast | breast invasive carcinoma | Female | >=65 | I/II | Unknown | Unknown | SD |
| CFTR | SNV | Missense_Mutation | novel | c.3460G>A | p.Asp1154Asn | p.D1154N | P13569 | protein_coding | deleterious(0) | probably_damaging(0.997) | TCGA-AN-A046-01 | Breast | breast invasive carcinoma | Female | >=65 | I/II | Unknown | Unknown | SD |
| CFTR | SNV | Missense_Mutation | c.3758N>C | p.Leu1253Ser | p.L1253S | P13569 | protein_coding | deleterious(0) | probably_damaging(1) | TCGA-AO-A124-01 | Breast | breast invasive carcinoma | Female | <65 | I/II | Chemotherapy | doxorubicin | SD | |
| CFTR | SNV | Missense_Mutation | c.1345N>C | p.Glu449Gln | p.E449Q | P13569 | protein_coding | tolerated(0.06) | benign(0.337) | TCGA-AR-A0TX-01 | Breast | breast invasive carcinoma | Female | <65 | I/II | Unknown | Unknown | SD | |
| CFTR | SNV | Missense_Mutation | c.1775G>T | p.Cys592Phe | p.C592F | P13569 | protein_coding | deleterious(0) | probably_damaging(0.999) | TCGA-BH-A0DV-01 | Breast | breast invasive carcinoma | Female | <65 | III/IV | Chemotherapy | taxotere | CR | |
| CFTR | SNV | Missense_Mutation | c.2771N>G | p.Asp924Gly | p.D924G | P13569 | protein_coding | tolerated(0.11) | benign(0.378) | TCGA-BH-A18G-01 | Breast | breast invasive carcinoma | Female | >=65 | I/II | Unknown | Unknown | SD | |
| CFTR | SNV | Missense_Mutation | c.4273G>T | p.Asp1425Tyr | p.D1425Y | P13569 | protein_coding | deleterious(0) | possibly_damaging(0.896) | TCGA-BH-A18U-01 | Breast | breast invasive carcinoma | Female | >=65 | III/IV | Unknown | Unknown | SD | |
| CFTR | SNV | Missense_Mutation | novel | c.453G>C | p.Gln151His | p.Q151H | P13569 | protein_coding | deleterious(0.01) | probably_damaging(0.999) | TCGA-BH-A2L8-01 | Breast | breast invasive carcinoma | Female | <65 | I/II | Chemotherapy | cytoxan | CR |
| Page: 1 2 3 4 5 6 7 8 9 10 11 12 13 14 15 16 |
Top |
Related drugs of malignant transformation related genes |
| Identification of chemicals and drugs interact with genes involved in malignant transfromation |
| (DGIdb 4.0) |
| Entrez ID | Symbol | Category | Interaction Types | Drug Claim Name | Drug Name | PMIDs |
| 1080 | CFTR | DRUGGABLE GENOME, ABC TRANSPORTER, ION CHANNEL, TRANSPORTER, CELL SURFACE, CLINICALLY ACTIONABLE | ivacaftor / tezacaftor | |||
| 1080 | CFTR | DRUGGABLE GENOME, ABC TRANSPORTER, ION CHANNEL, TRANSPORTER, CELL SURFACE, CLINICALLY ACTIONABLE | elexacaftor / tezacaftor / ivacaftor | |||
| 1080 | CFTR | DRUGGABLE GENOME, ABC TRANSPORTER, ION CHANNEL, TRANSPORTER, CELL SURFACE, CLINICALLY ACTIONABLE | VX-809 | LUMACAFTOR | ||
| 1080 | CFTR | DRUGGABLE GENOME, ABC TRANSPORTER, ION CHANNEL, TRANSPORTER, CELL SURFACE, CLINICALLY ACTIONABLE | lumacaftor | LUMACAFTOR | 22698459,24561283,26137539,24038832,22293084,24973281,21825083,24392786,26823392,28325531,24796242,27334259,21976485,23891399 | |
| 1080 | CFTR | DRUGGABLE GENOME, ABC TRANSPORTER, ION CHANNEL, TRANSPORTER, CELL SURFACE, CLINICALLY ACTIONABLE | blocker | 178101015 | ||
| 1080 | CFTR | DRUGGABLE GENOME, ABC TRANSPORTER, ION CHANNEL, TRANSPORTER, CELL SURFACE, CLINICALLY ACTIONABLE | inhibitor | 187051756 | CROFELEMER | |
| 1080 | CFTR | DRUGGABLE GENOME, ABC TRANSPORTER, ION CHANNEL, TRANSPORTER, CELL SURFACE, CLINICALLY ACTIONABLE | ABBV-2451 | |||
| 1080 | CFTR | DRUGGABLE GENOME, ABC TRANSPORTER, ION CHANNEL, TRANSPORTER, CELL SURFACE, CLINICALLY ACTIONABLE | activator | 53801090 | CAPSAICIN | |
| 1080 | CFTR | DRUGGABLE GENOME, ABC TRANSPORTER, ION CHANNEL, TRANSPORTER, CELL SURFACE, CLINICALLY ACTIONABLE | IVACAFTOR | IVACAFTOR | ||
| 1080 | CFTR | DRUGGABLE GENOME, ABC TRANSPORTER, ION CHANNEL, TRANSPORTER, CELL SURFACE, CLINICALLY ACTIONABLE | activator | 178101101 |
| Page: 1 2 3 4 5 6 7 |

Copyright 2023-Present -The University of Texas Health Science Center at Houston |