
|
|||||
|
 | |
| |
| |
| |
| |
| |
|
Gene: CD59 |
Gene summary for CD59 |
| Gene information | Species | Human | Gene symbol | CD59 | Gene ID | 966 |
| Gene name | CD59 molecule (CD59 blood group) | |
| Gene Alias | 16.3A5 | |
| Cytomap | 11p13 | |
| Gene Type | protein-coding | GO ID | GO:0001905 | UniProtAcc | P13987 |
Top |
Malignant transformation analysis |
| Identification of the aberrant gene expression in precancerous and cancerous lesions by comparing the gene expression of stem-like cells in diseased tissues with normal stem cells |
| Entrez ID | Symbol | Replicates | Species | Organ | Tissue | Adj P-value | Log2FC | Malignancy |
| 966 | CD59 | GSM4909282 | Human | Breast | IDC | 8.31e-18 | -5.53e-01 | -0.0288 |
| 966 | CD59 | GSM4909285 | Human | Breast | IDC | 6.10e-31 | -6.20e-01 | 0.21 |
| 966 | CD59 | GSM4909286 | Human | Breast | IDC | 3.21e-15 | -2.54e-01 | 0.1081 |
| 966 | CD59 | GSM4909290 | Human | Breast | IDC | 2.10e-33 | -9.31e-01 | 0.2096 |
| 966 | CD59 | GSM4909291 | Human | Breast | IDC | 2.86e-21 | -7.66e-01 | 0.1753 |
| 966 | CD59 | GSM4909293 | Human | Breast | IDC | 3.51e-44 | -9.30e-01 | 0.1581 |
| 966 | CD59 | GSM4909294 | Human | Breast | IDC | 1.29e-48 | -9.54e-01 | 0.2022 |
| 966 | CD59 | GSM4909296 | Human | Breast | IDC | 5.38e-54 | -1.03e+00 | 0.1524 |
| 966 | CD59 | GSM4909297 | Human | Breast | IDC | 2.54e-37 | -7.38e-01 | 0.1517 |
| 966 | CD59 | GSM4909298 | Human | Breast | IDC | 1.04e-20 | -4.64e-01 | 0.1551 |
| 966 | CD59 | GSM4909301 | Human | Breast | IDC | 9.50e-48 | -9.74e-01 | 0.1577 |
| 966 | CD59 | GSM4909302 | Human | Breast | IDC | 5.17e-04 | -3.44e-01 | 0.1545 |
| 966 | CD59 | GSM4909304 | Human | Breast | IDC | 1.86e-20 | -4.51e-01 | 0.1636 |
| 966 | CD59 | GSM4909306 | Human | Breast | IDC | 6.76e-14 | -3.88e-01 | 0.1564 |
| 966 | CD59 | GSM4909308 | Human | Breast | IDC | 1.72e-13 | -1.99e-01 | 0.158 |
| 966 | CD59 | GSM4909311 | Human | Breast | IDC | 4.00e-56 | -8.71e-01 | 0.1534 |
| 966 | CD59 | GSM4909312 | Human | Breast | IDC | 1.19e-33 | -7.38e-01 | 0.1552 |
| 966 | CD59 | GSM4909313 | Human | Breast | IDC | 2.56e-03 | -1.98e-01 | 0.0391 |
| 966 | CD59 | GSM4909315 | Human | Breast | IDC | 8.11e-36 | -8.50e-01 | 0.21 |
| 966 | CD59 | GSM4909316 | Human | Breast | IDC | 9.94e-12 | -8.21e-01 | 0.21 |
| Page: 1 2 3 4 5 6 7 8 9 10 11 12 13 14 15 16 17 |
| Tissue | Expression Dynamics | Abbreviation |
| Breast | 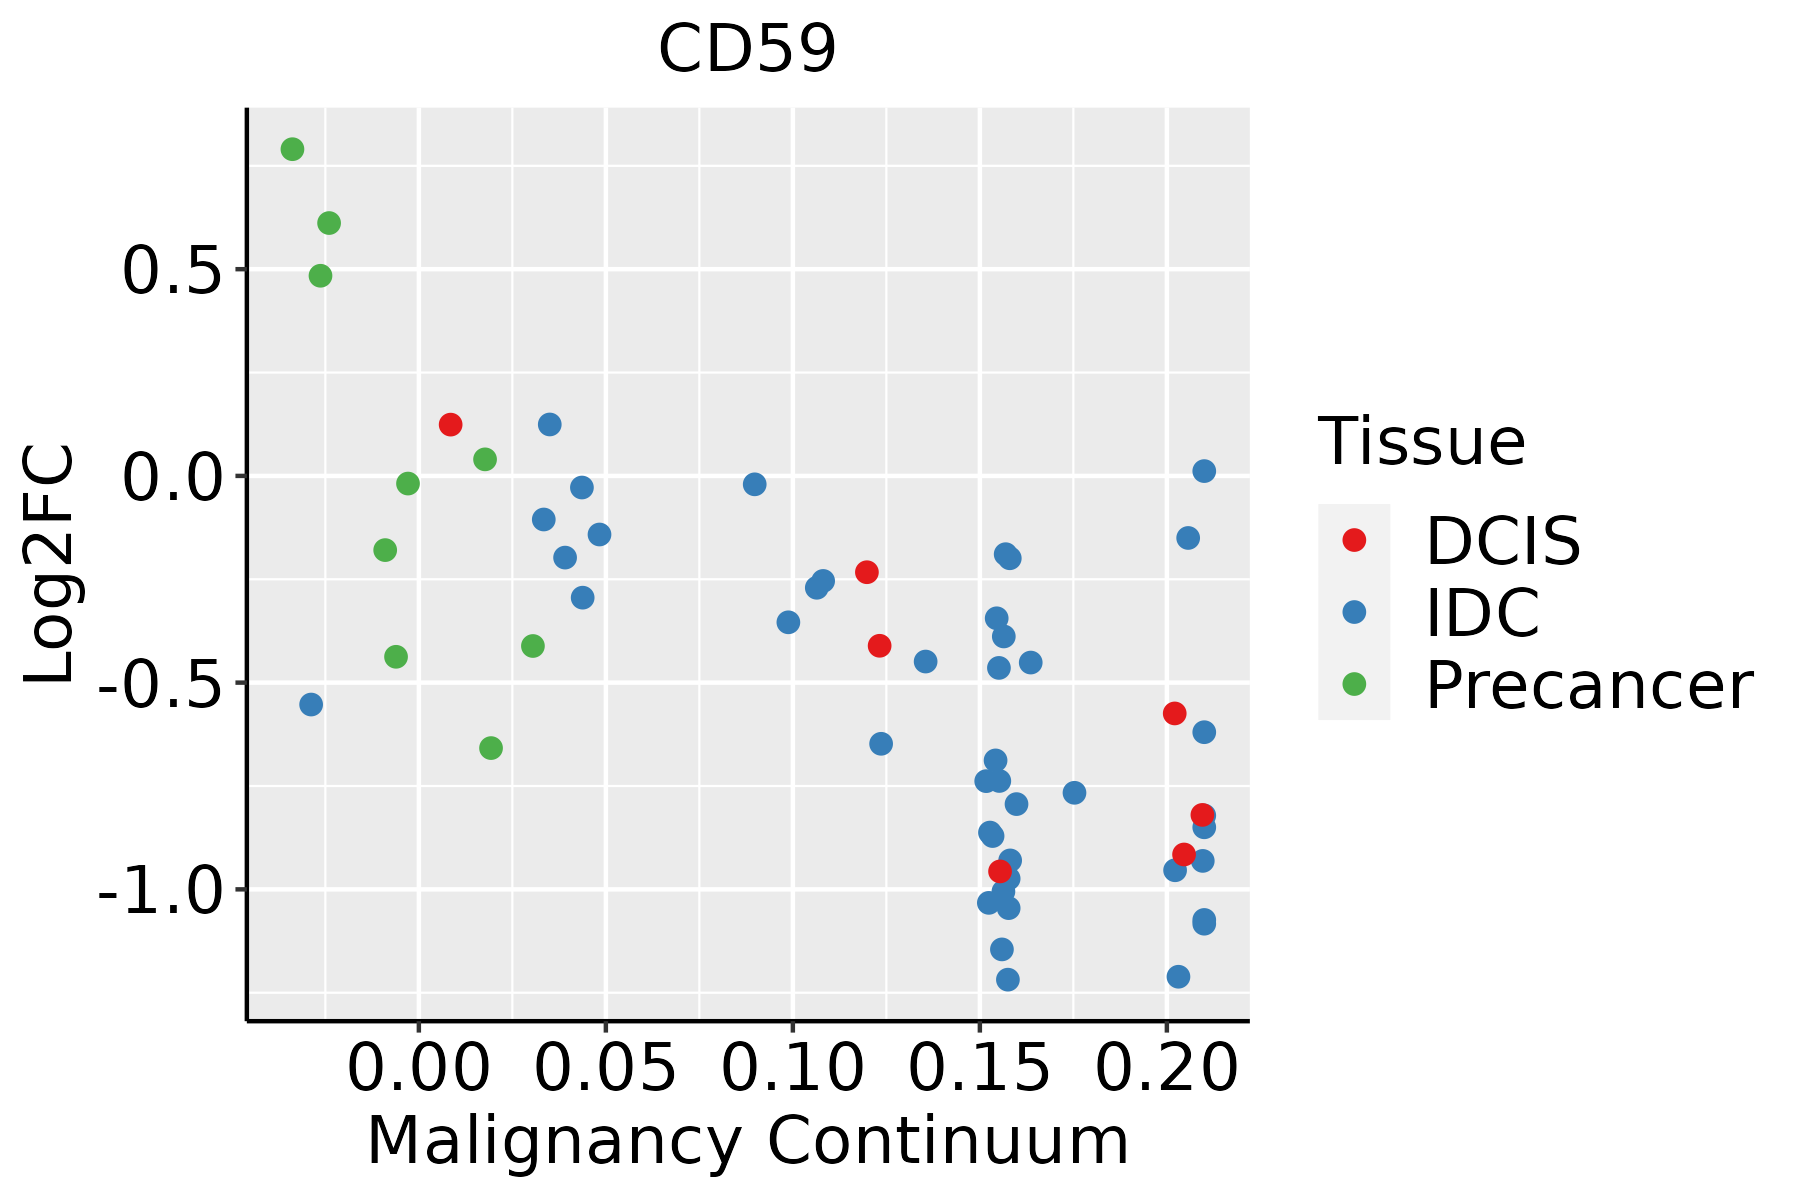 | IDC: Invasive ductal carcinoma |
| DCIS: Ductal carcinoma in situ | ||
| Precancer(BRCA1-mut): Precancerous lesion from BRCA1 mutation carriers | ||
| Cervix |  | CC: Cervix cancer |
| HSIL_HPV: HPV-infected high-grade squamous intraepithelial lesions | ||
| N_HPV: HPV-infected normal cervix | ||
| Colorectum (GSE201348) |  | FAP: Familial adenomatous polyposis |
| CRC: Colorectal cancer | ||
| Colorectum (HTA11) |  | AD: Adenomas |
| SER: Sessile serrated lesions | ||
| MSI-H: Microsatellite-high colorectal cancer | ||
| MSS: Microsatellite stable colorectal cancer | ||
| Endometrium | 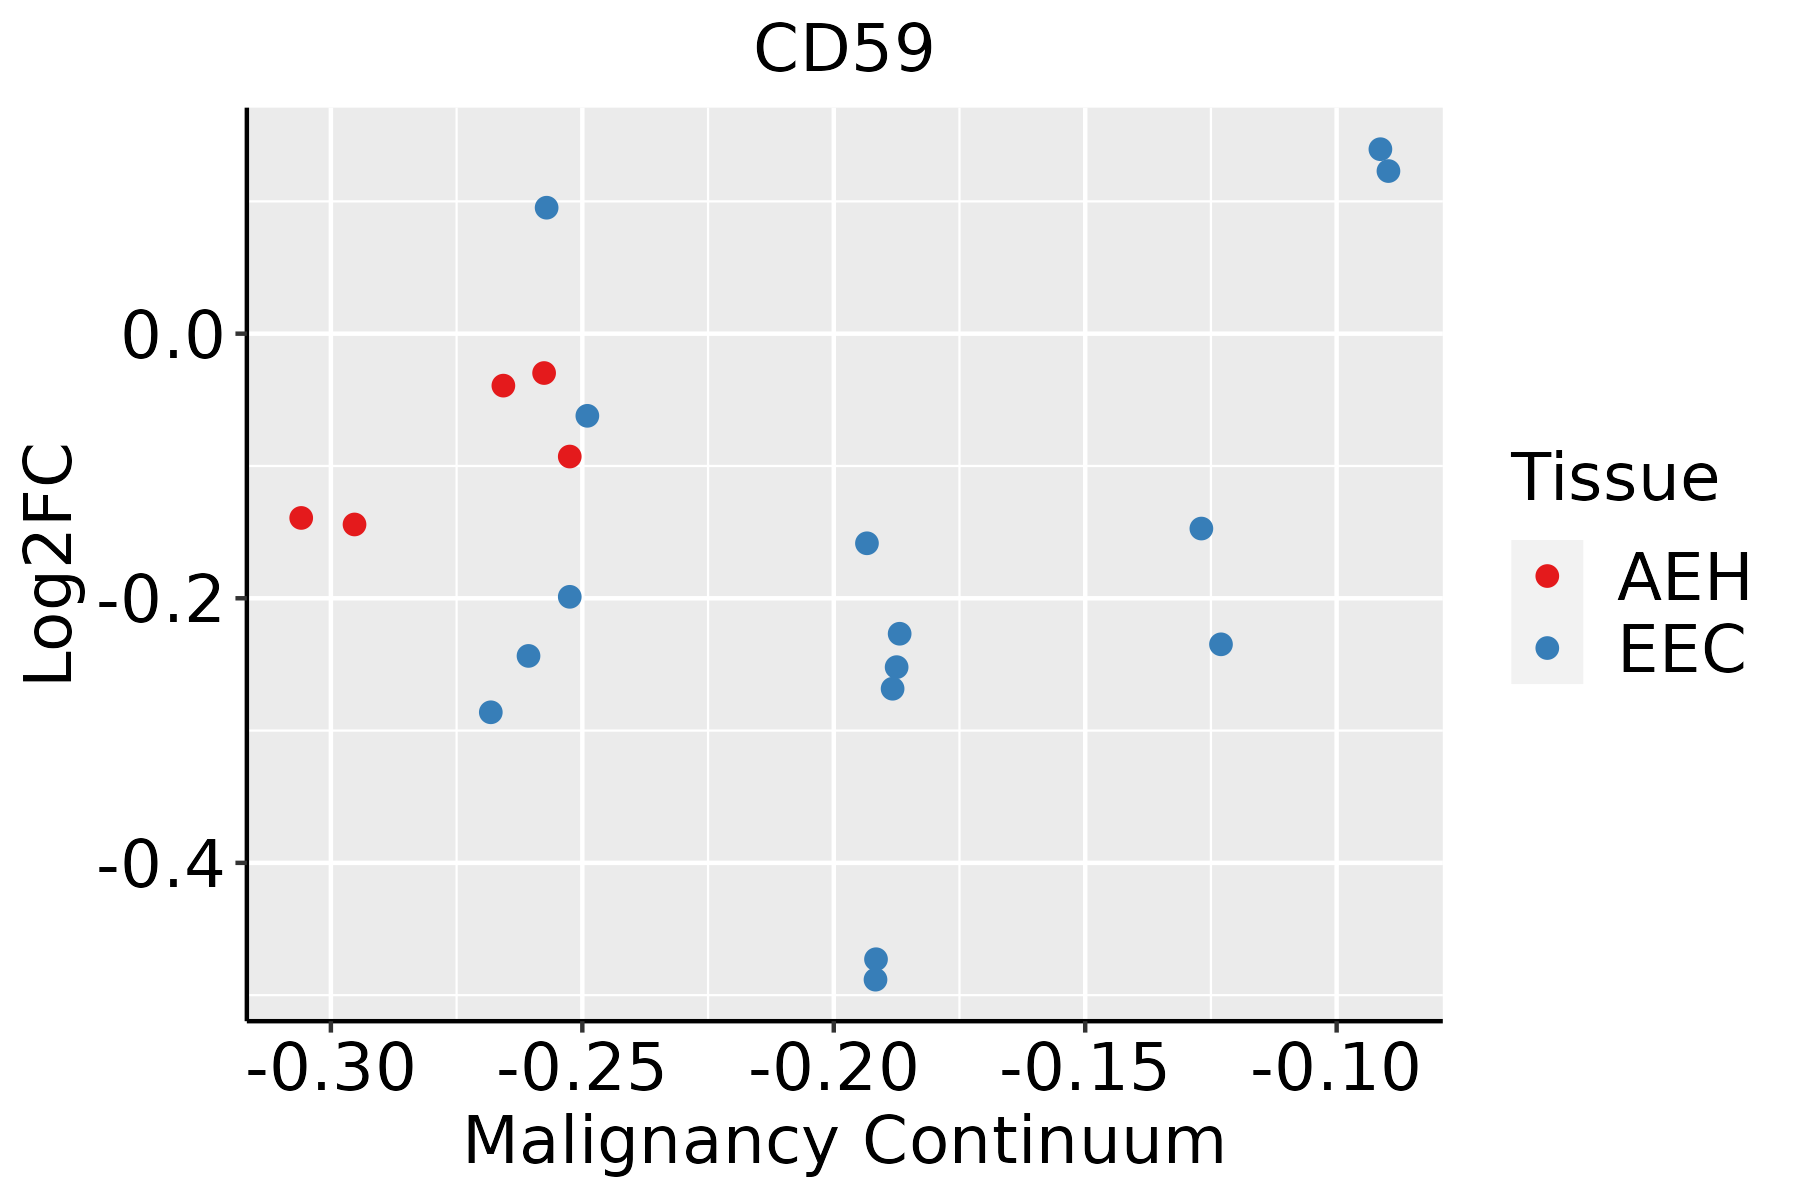 | AEH: Atypical endometrial hyperplasia |
| EEC: Endometrioid Cancer | ||
| Esophagus | 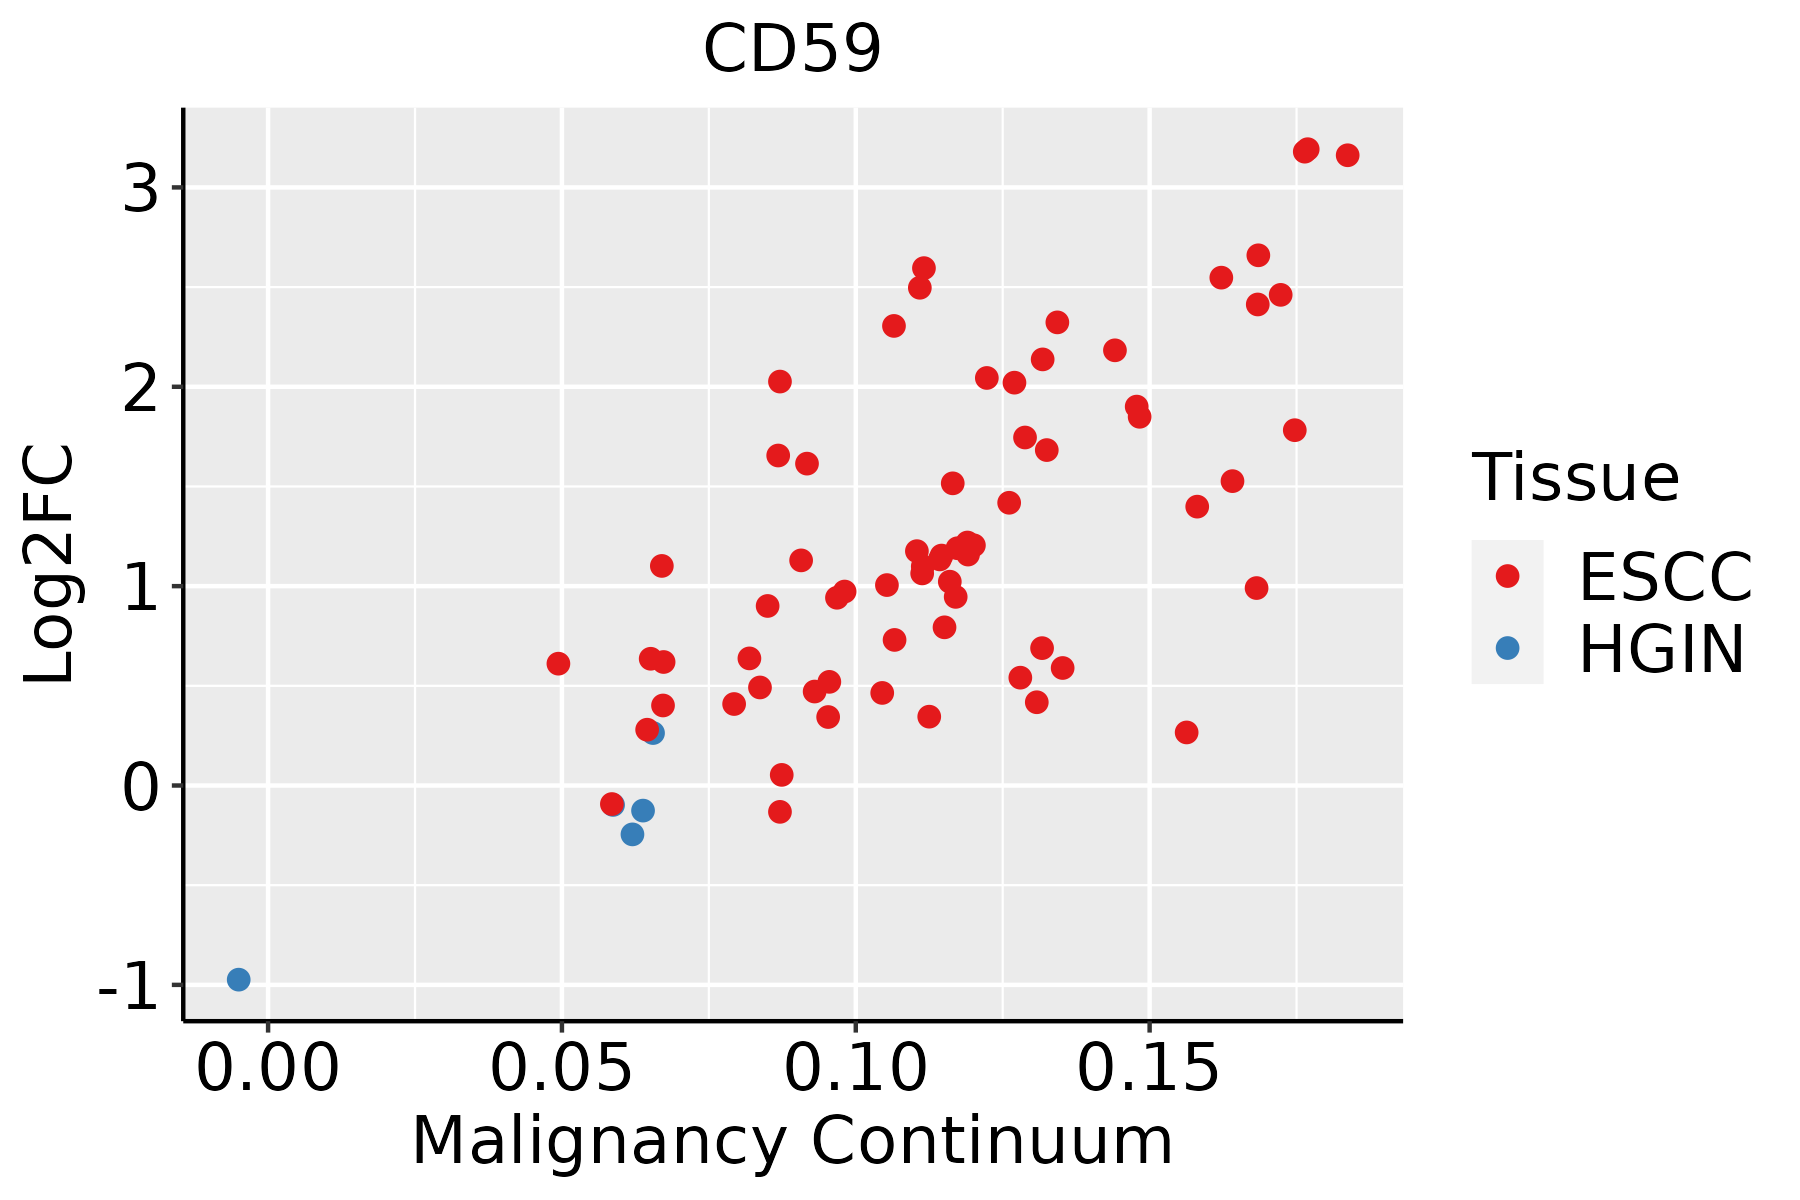 | ESCC: Esophageal squamous cell carcinoma |
| HGIN: High-grade intraepithelial neoplasias | ||
| LGIN: Low-grade intraepithelial neoplasias | ||
| GC | 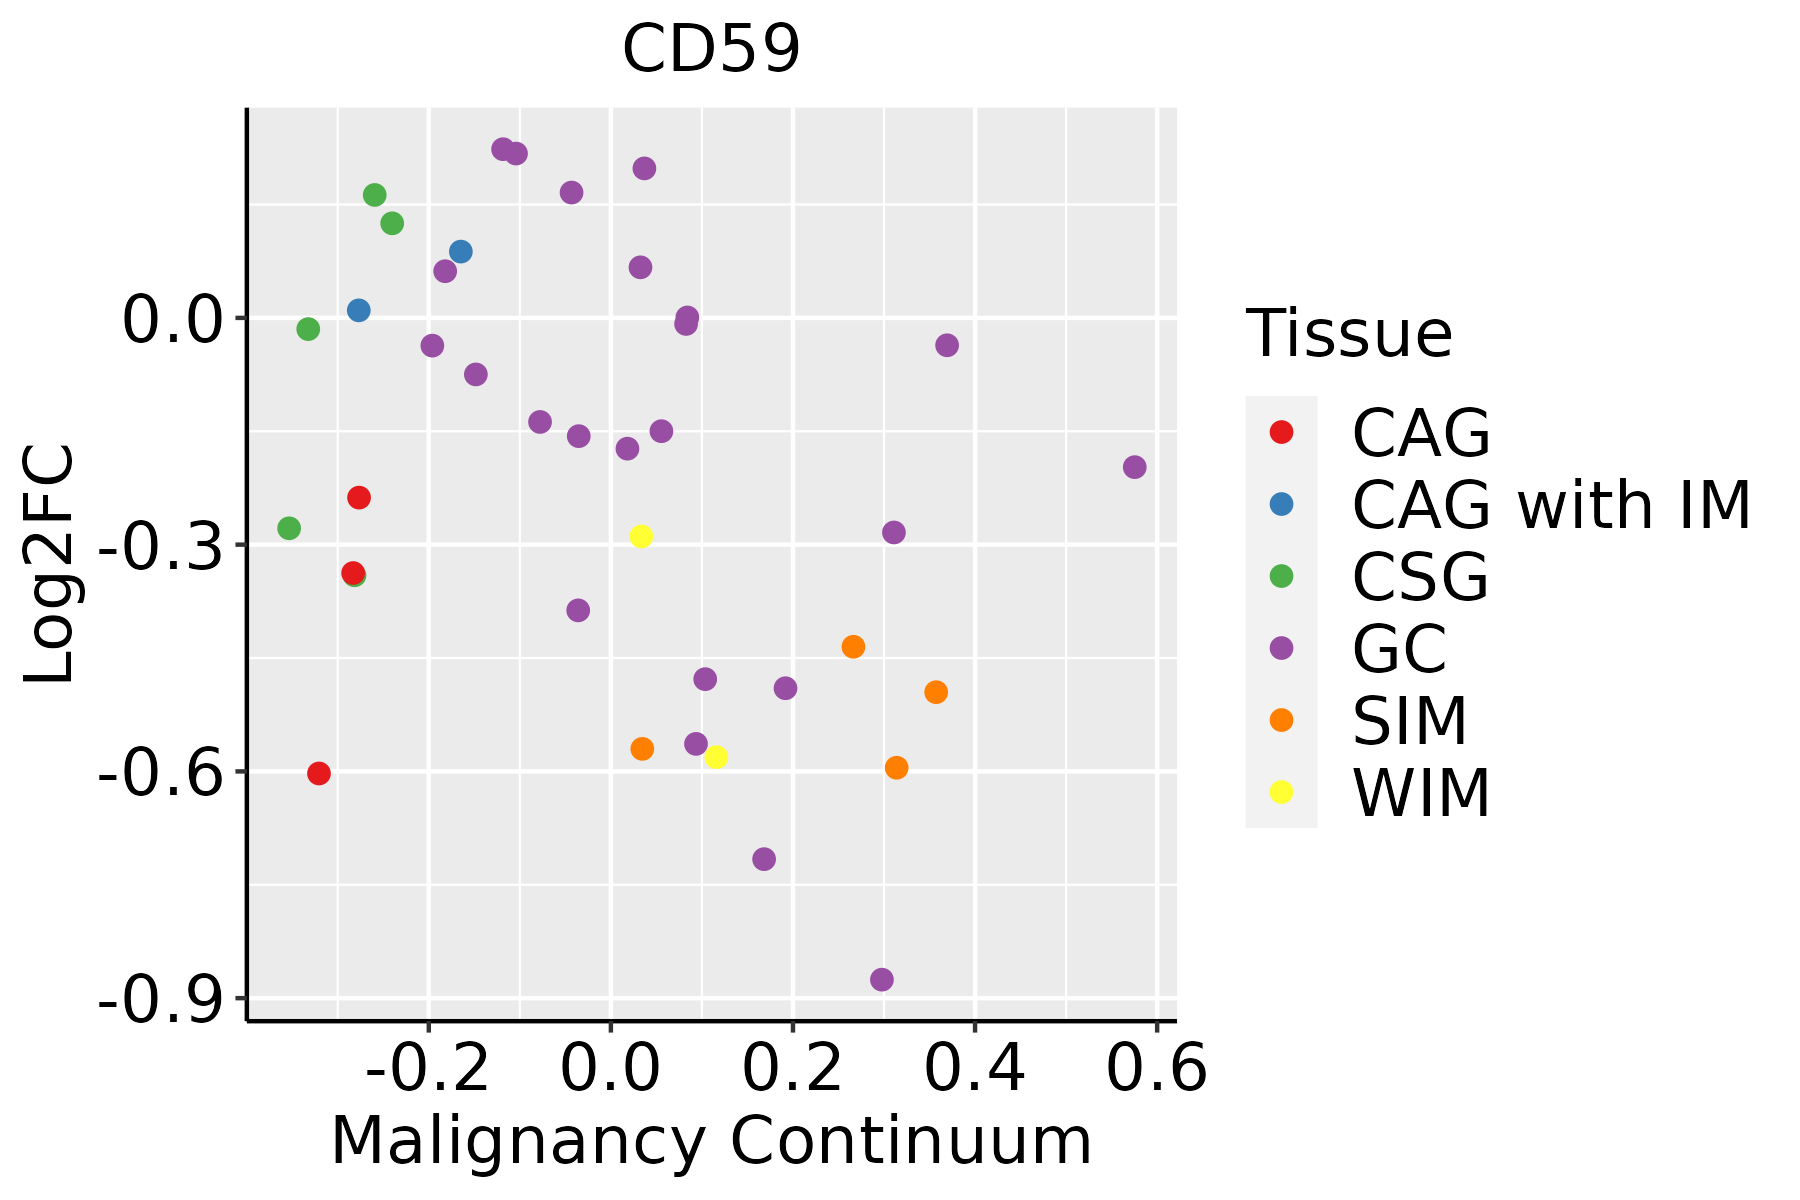 | CAG: Chronic atrophic gastritis |
| CAG with IM: Chronic atrophic gastritis with intestinal metaplasia | ||
| CSG: Chronic superficial gastritis | ||
| GC: Gastric cancer | ||
| SIM: Severe intestinal metaplasia | ||
| WIM: Wild intestinal metaplasia | ||
| Liver | 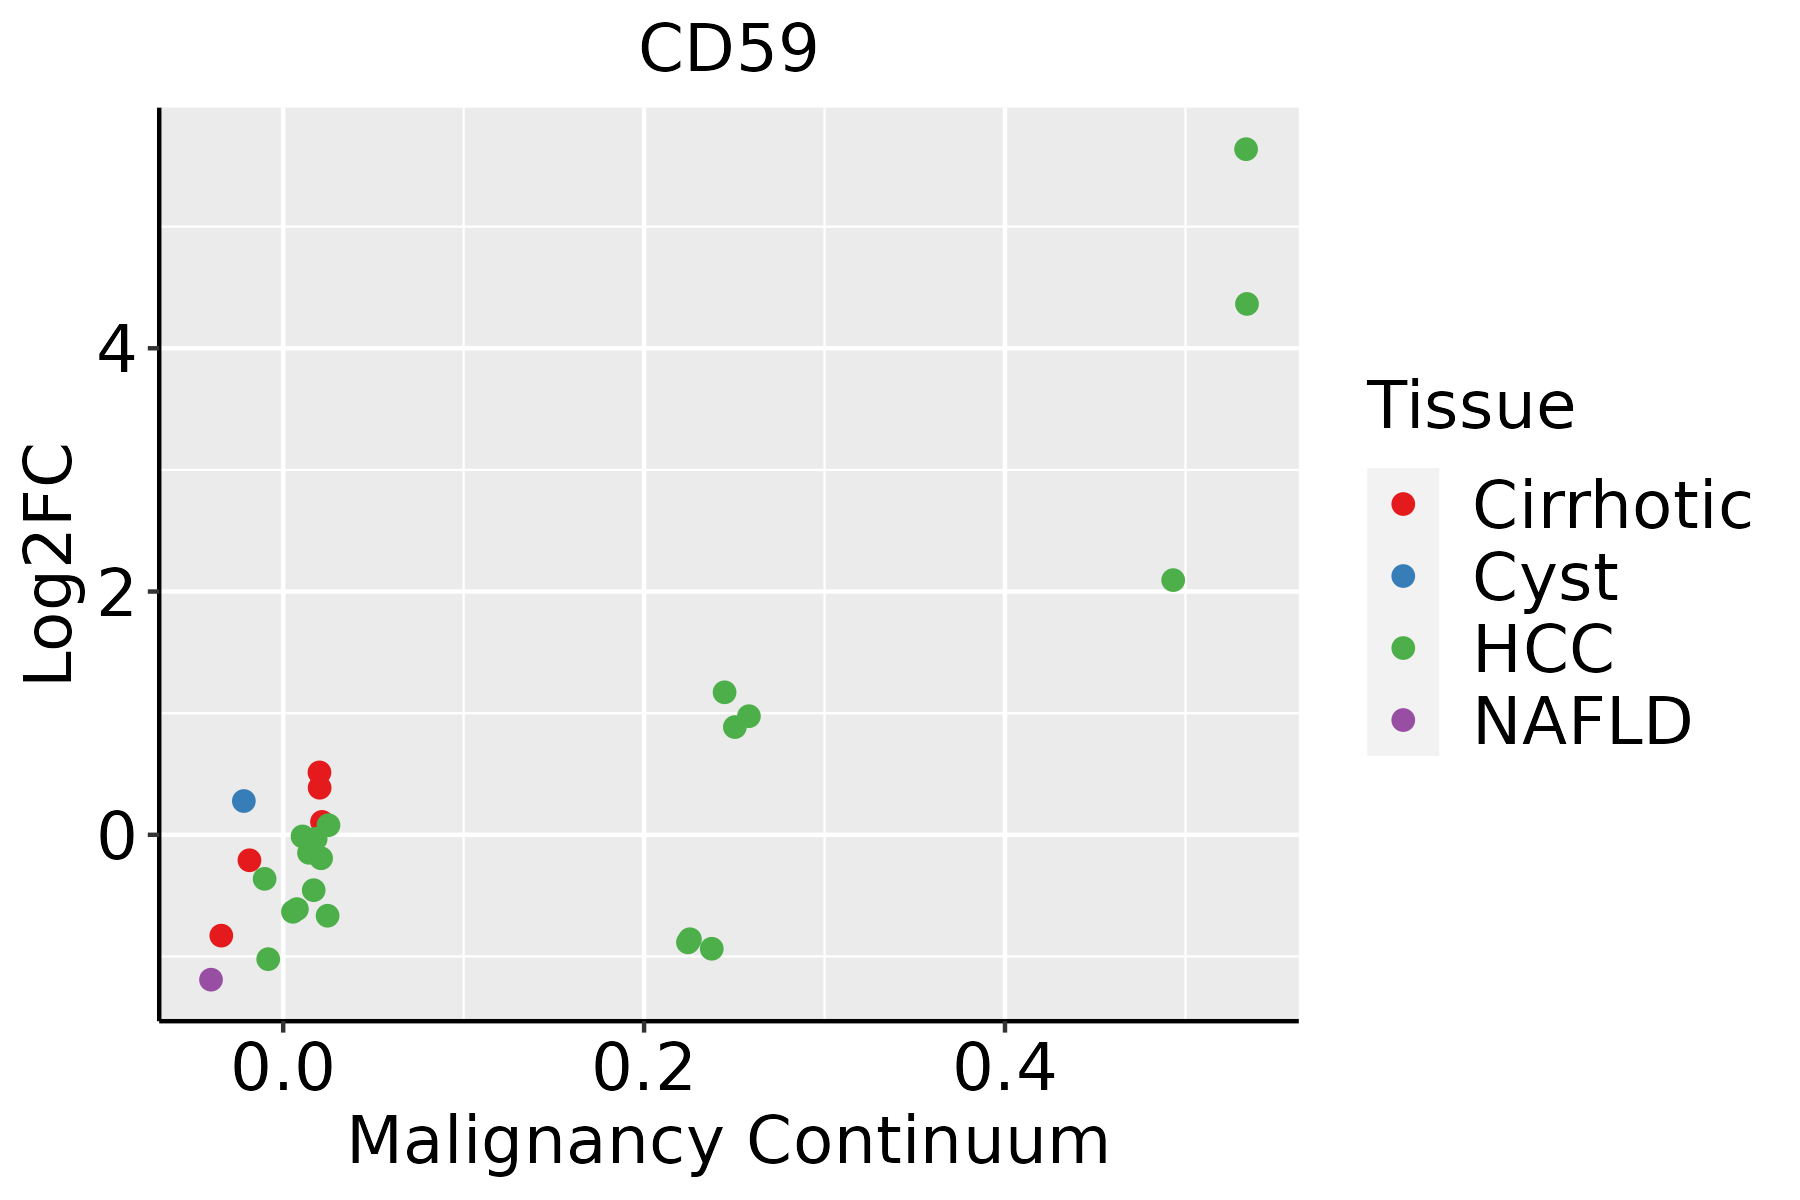 | HCC: Hepatocellular carcinoma |
| NAFLD: Non-alcoholic fatty liver disease | ||
| Lung |  | AAH: Atypical adenomatous hyperplasia |
| AIS: Adenocarcinoma in situ | ||
| IAC: Invasive lung adenocarcinoma | ||
| MIA: Minimally invasive adenocarcinoma | ||
| Oral Cavity | 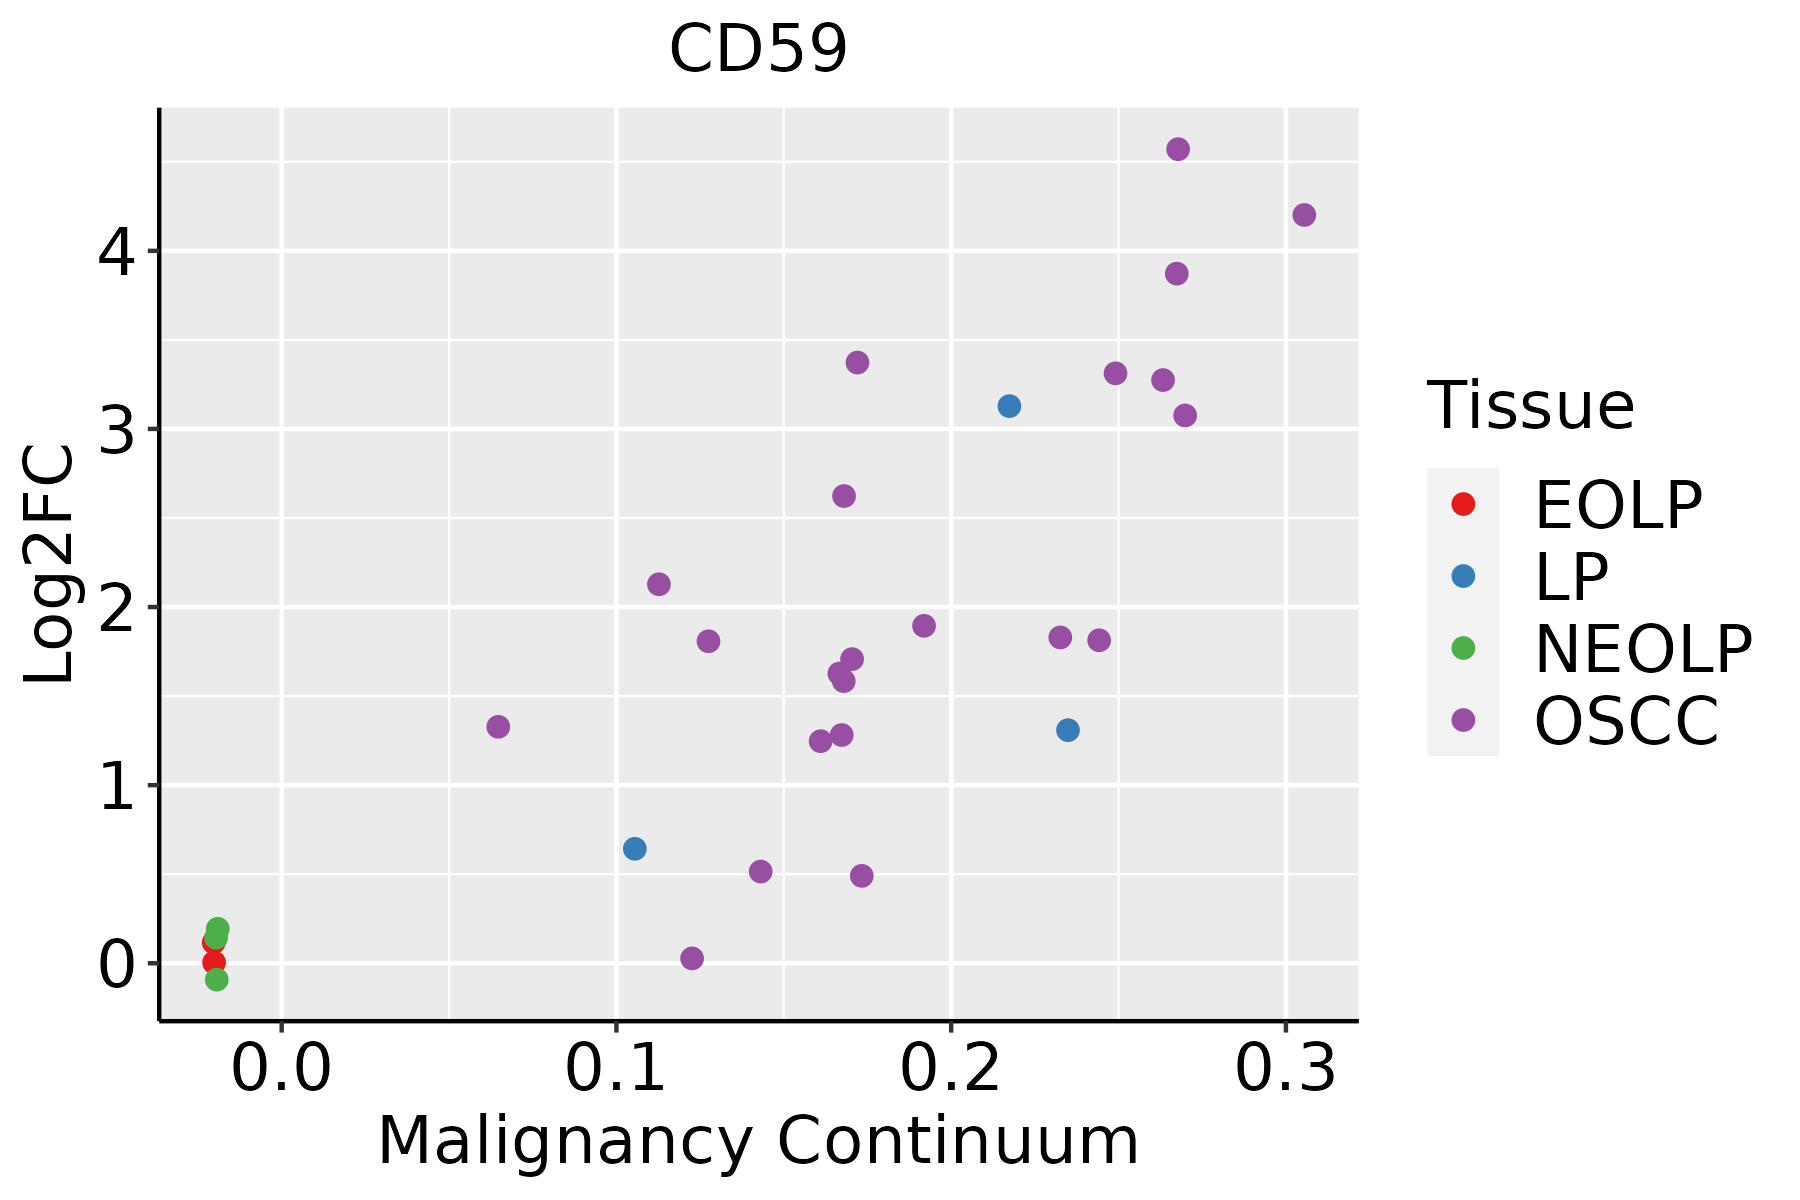 | EOLP: Erosive Oral lichen planus |
| LP: leukoplakia | ||
| NEOLP: Non-erosive oral lichen planus | ||
| OSCC: Oral squamous cell carcinoma | ||
| Prostate | 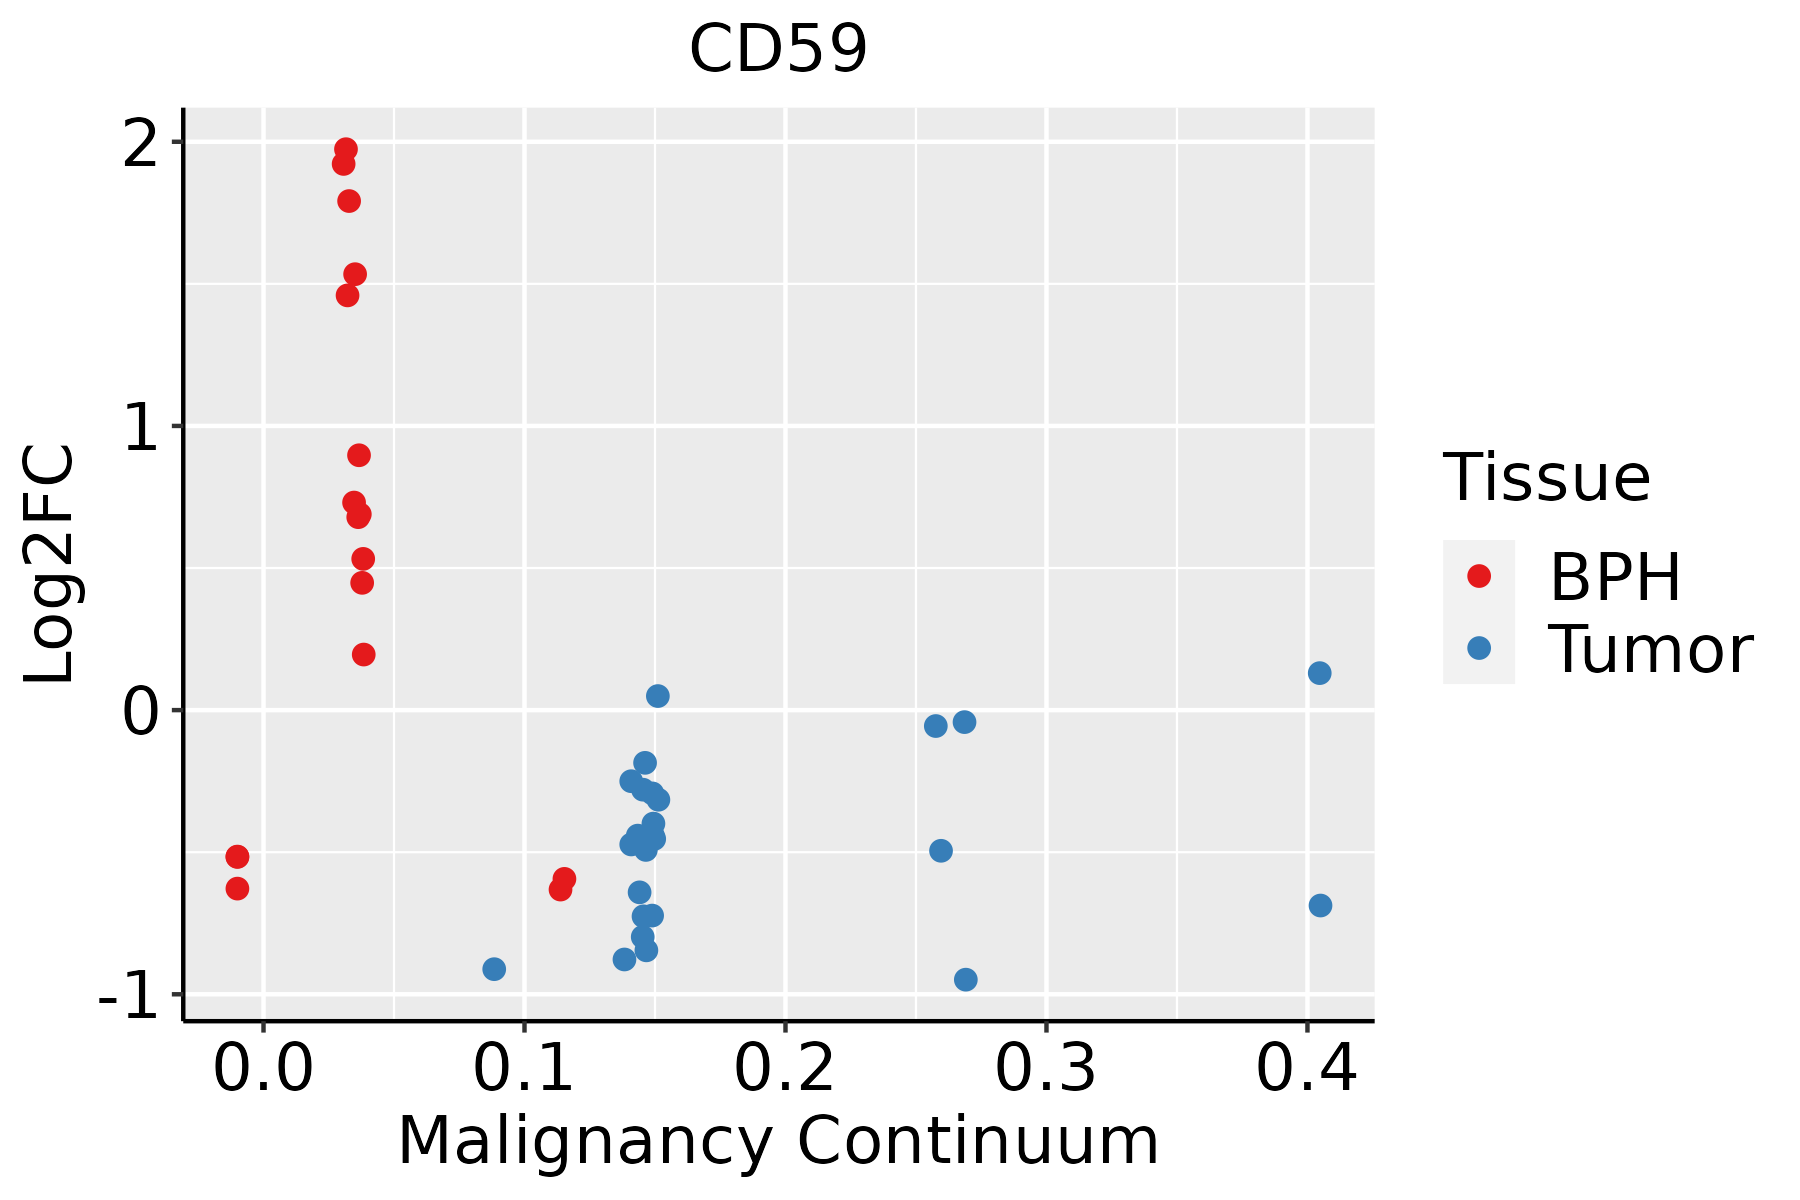 | BPH: Benign Prostatic Hyperplasia |
| Skin | 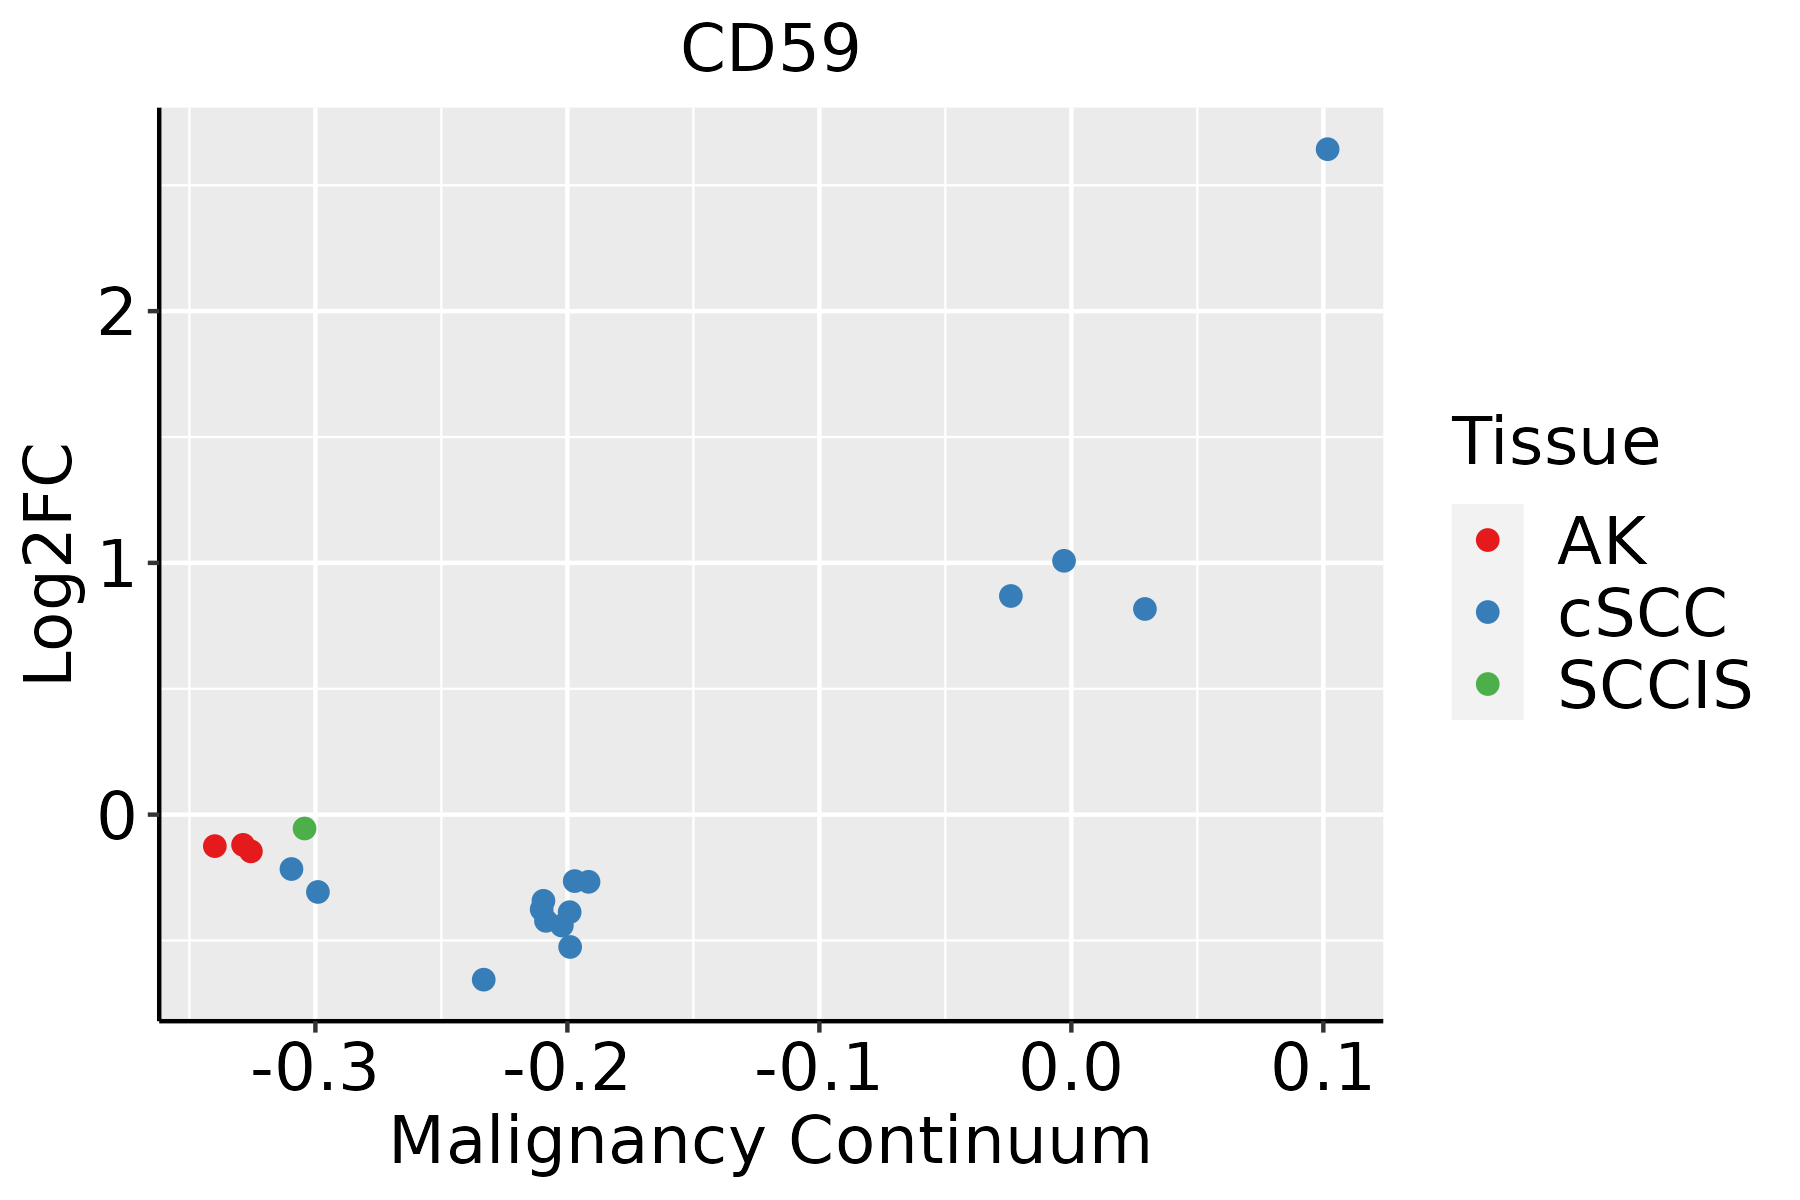 | AK: Actinic keratosis |
| cSCC: Cutaneous squamous cell carcinoma | ||
| SCCIS:squamous cell carcinoma in situ | ||
| Thyroid | 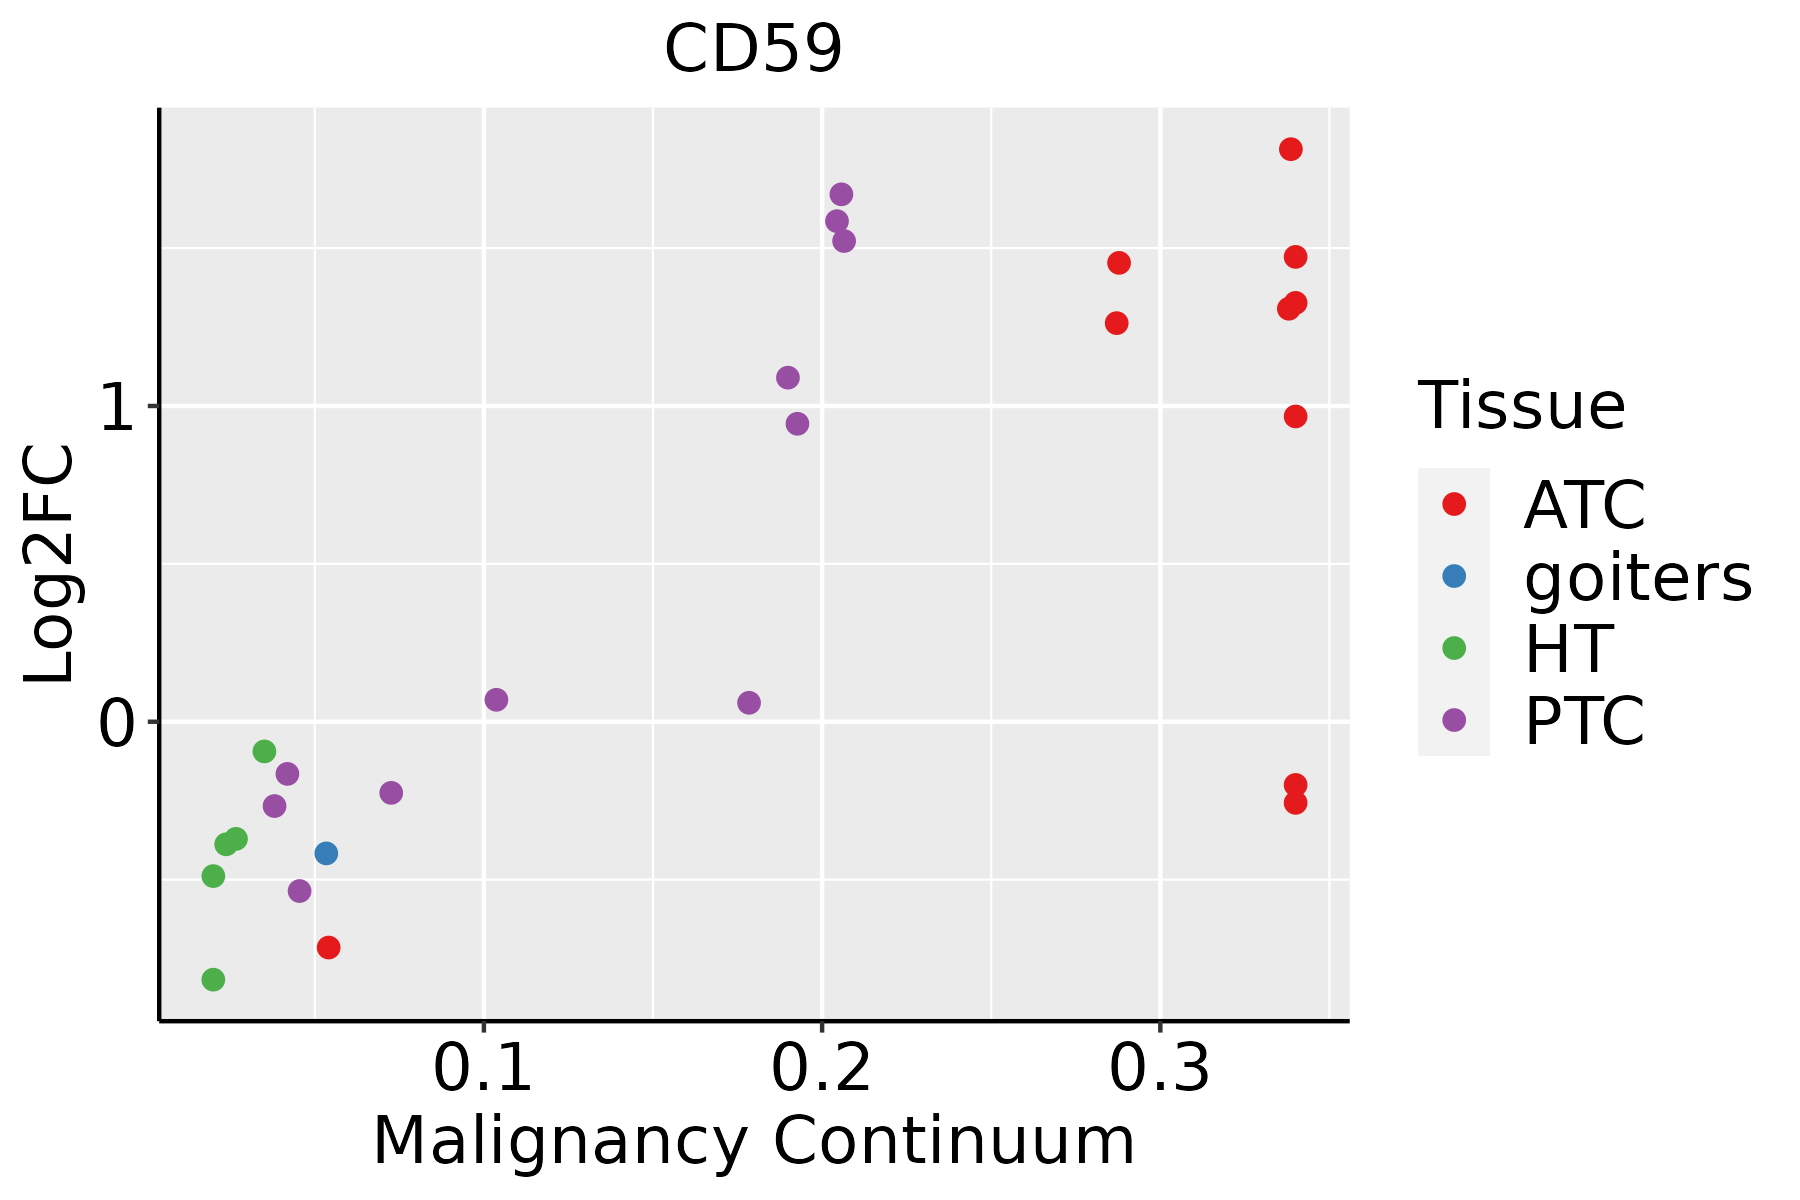 | ATC: Anaplastic thyroid cancer |
| HT: Hashimoto's thyroiditis | ||
| PTC: Papillary thyroid cancer |
| ∗log2FC in expression of this searched gene in stem-like cells from each diseased tissue sample relative to stem-like cells in normal samples in each tissue plotted against the malignancy continuum. Samples are colored based on if they are from different disease stage. |
Top |
Malignant transformation related pathway analysis |
| Find out the enriched GO biological processes and KEGG pathways involved in transition from healthy to precancer to cancer |
| Tissue | Disease Stage | Enriched GO biological Processes |
| Colorectum | AD |  |
| Colorectum | SER |  |
| Colorectum | MSS |  |
| Colorectum | MSI-H |  |
| Colorectum | FAP |  |
| ∗Top 15 enriched GO BP terms are showed in the bar plot of each disease state in each tissue. Each row represents a significant GO biological process which is colored according to the -log10(p.adjust). |
| Page: 1 2 3 4 5 6 7 8 9 |
| GO ID | Tissue | Disease Stage | Description | Gene Ratio | Bg Ratio | pvalue | p.adjust | Count |
| GO:00507775 | Esophagus | ESCC | negative regulation of immune response | 112/8552 | 194/18723 | 4.67e-04 | 2.62e-03 | 112 |
| GO:000268316 | Esophagus | ESCC | negative regulation of immune system process | 231/8552 | 434/18723 | 8.48e-04 | 4.36e-03 | 231 |
| GO:00420607 | Liver | NAFLD | wound healing | 84/1882 | 422/18723 | 6.56e-10 | 1.37e-07 | 84 |
| GO:00075994 | Liver | NAFLD | hemostasis | 49/1882 | 222/18723 | 9.23e-08 | 7.59e-06 | 49 |
| GO:00075964 | Liver | NAFLD | blood coagulation | 48/1882 | 217/18723 | 1.16e-07 | 8.81e-06 | 48 |
| GO:00508174 | Liver | NAFLD | coagulation | 48/1882 | 222/18723 | 2.40e-07 | 1.61e-05 | 48 |
| GO:00508787 | Liver | NAFLD | regulation of body fluid levels | 60/1882 | 379/18723 | 2.61e-04 | 4.23e-03 | 60 |
| GO:0045916 | Liver | NAFLD | negative regulation of complement activation | 6/1882 | 12/18723 | 5.54e-04 | 7.46e-03 | 6 |
| GO:0030449 | Liver | NAFLD | regulation of complement activation | 8/1882 | 21/18723 | 6.29e-04 | 8.21e-03 | 8 |
| GO:00972783 | Liver | NAFLD | complement-dependent cytotoxicity | 5/1882 | 10/18723 | 1.67e-03 | 1.74e-02 | 5 |
| GO:0002921 | Liver | NAFLD | negative regulation of humoral immune response | 6/1882 | 16/18723 | 3.37e-03 | 2.93e-02 | 6 |
| GO:004206012 | Liver | Cirrhotic | wound healing | 155/4634 | 422/18723 | 2.12e-08 | 7.56e-07 | 155 |
| GO:000759611 | Liver | Cirrhotic | blood coagulation | 79/4634 | 217/18723 | 8.06e-05 | 8.81e-04 | 79 |
| GO:000759911 | Liver | Cirrhotic | hemostasis | 80/4634 | 222/18723 | 1.08e-04 | 1.10e-03 | 80 |
| GO:005081711 | Liver | Cirrhotic | coagulation | 79/4634 | 222/18723 | 1.90e-04 | 1.76e-03 | 79 |
| GO:005087812 | Liver | Cirrhotic | regulation of body fluid levels | 118/4634 | 379/18723 | 2.65e-03 | 1.55e-02 | 118 |
| GO:004206022 | Liver | HCC | wound healing | 219/7958 | 422/18723 | 5.34e-05 | 5.04e-04 | 219 |
| GO:00075962 | Liver | HCC | blood coagulation | 118/7958 | 217/18723 | 2.63e-04 | 1.94e-03 | 118 |
| GO:00075992 | Liver | HCC | hemostasis | 119/7958 | 222/18723 | 5.25e-04 | 3.41e-03 | 119 |
| GO:00508172 | Liver | HCC | coagulation | 118/7958 | 222/18723 | 8.41e-04 | 5.03e-03 | 118 |
| Page: 1 2 3 4 5 6 7 8 9 10 11 12 |
| Pathway ID | Tissue | Disease Stage | Description | Gene Ratio | Bg Ratio | pvalue | p.adjust | qvalue | Count |
| hsa04640 | Cervix | HSIL_HPV | Hematopoietic cell lineage | 18/459 | 99/8465 | 4.97e-06 | 8.10e-05 | 6.54e-05 | 18 |
| hsa046401 | Cervix | HSIL_HPV | Hematopoietic cell lineage | 18/459 | 99/8465 | 4.97e-06 | 8.10e-05 | 6.54e-05 | 18 |
| hsa046402 | Cervix | N_HPV | Hematopoietic cell lineage | 13/349 | 99/8465 | 1.98e-04 | 1.74e-03 | 1.36e-03 | 13 |
| hsa046403 | Cervix | N_HPV | Hematopoietic cell lineage | 13/349 | 99/8465 | 1.98e-04 | 1.74e-03 | 1.36e-03 | 13 |
| hsa04610 | Liver | NAFLD | Complement and coagulation cascades | 35/1043 | 86/8465 | 2.48e-11 | 2.04e-09 | 1.64e-09 | 35 |
| hsa046101 | Liver | NAFLD | Complement and coagulation cascades | 35/1043 | 86/8465 | 2.48e-11 | 2.04e-09 | 1.64e-09 | 35 |
| hsa046102 | Liver | Cirrhotic | Complement and coagulation cascades | 48/2530 | 86/8465 | 4.41e-07 | 5.44e-06 | 3.35e-06 | 48 |
| hsa046103 | Liver | Cirrhotic | Complement and coagulation cascades | 48/2530 | 86/8465 | 4.41e-07 | 5.44e-06 | 3.35e-06 | 48 |
| hsa046104 | Liver | HCC | Complement and coagulation cascades | 57/4020 | 86/8465 | 3.19e-04 | 1.45e-03 | 8.04e-04 | 57 |
| hsa046105 | Liver | HCC | Complement and coagulation cascades | 57/4020 | 86/8465 | 3.19e-04 | 1.45e-03 | 8.04e-04 | 57 |
| Page: 1 |
Top |
Cell-cell communication analysis |
| Identification of potential cell-cell interactions between two cell types and their ligand-receptor pairs for different disease states |
| Ligand | Receptor | LRpair | Pathway | Tissue | Disease Stage |
| Page: 1 |
Top |
Single-cell gene regulatory network inference analysis |
| Find out the significant the regulons (TFs) and the target genes of each regulon across cell types for different disease states |
| TF | Cell Type | Tissue | Disease Stage | Target Gene | RSS | Regulon Activity |
| CD59 | ICAF | Colorectum | ADJ | TAGLN2,VIM,CRIP2, etc. | 2.53e-01 |  |
| CD59 | ICAF | Colorectum | CRC | TAGLN2,VIM,CRIP2, etc. | 4.71e-02 |  |
| CD59 | STM | Stomach | ADJ | CD63,TM4SF1,IFI27, etc. | 2.81e-01 |  |
| CD59 | STM | Stomach | CAG with IM | CD63,TM4SF1,IFI27, etc. | 2.70e-01 |  |
| CD59 | STM | Stomach | CSG | CD63,TM4SF1,IFI27, etc. | 2.76e-01 |  |
| CD59 | PTC | Thyroid | ATC | CYBA,B2M,APLP2, etc. | 3.94e-01 |  |
| ∗The dot plots of a searched regulon are shown for all cell subpopulations in each disease state of each tissue based on the regulon specific score inferred using pySCENIC and by calculating the average expression. |
| Page: 1 |
Top |
Somatic mutation of malignant transformation related genes |
| Annotation of somatic variants for genes involved in malignant transformation |
| Hugo Symbol | Variant Class | Variant Classification | dbSNP RS | HGVSc | HGVSp | HGVSp Short | SWISSPROT | BIOTYPE | SIFT | PolyPhen | Tumor Sample Barcode | Tissue | Histology | Sex | Age | Stage | Therapy Types | Drugs | Outcome |
| CD59 | SNV | Missense_Mutation | rs754311428 | c.292N>A | p.Glu98Lys | p.E98K | P13987 | protein_coding | tolerated(0.56) | benign(0) | TCGA-AN-A046-01 | Breast | breast invasive carcinoma | Female | >=65 | I/II | Unknown | Unknown | SD |
| CD59 | SNV | Missense_Mutation | novel | c.327G>T | p.Glu109Asp | p.E109D | P13987 | protein_coding | tolerated(0.17) | benign(0.031) | TCGA-EI-6917-01 | Colorectum | rectum adenocarcinoma | Male | <65 | III/IV | Chemotherapy | 5fluorouracil+oxaciplatina+l-folinian | SD |
| CD59 | SNV | Missense_Mutation | c.122C>T | p.Ala41Val | p.A41V | P13987 | protein_coding | tolerated(0.73) | benign(0.001) | TCGA-AX-A0J1-01 | Endometrium | uterine corpus endometrioid carcinoma | Female | >=65 | I/II | Unknown | Unknown | SD | |
| CD59 | SNV | Missense_Mutation | novel | c.184N>G | p.Asn62Asp | p.N62D | P13987 | protein_coding | tolerated(0.26) | benign(0.15) | TCGA-BG-A221-01 | Endometrium | uterine corpus endometrioid carcinoma | Female | >=65 | I/II | Unknown | Unknown | SD |
| CD59 | SNV | Missense_Mutation | rs754311428 | c.292N>A | p.Glu98Lys | p.E98K | P13987 | protein_coding | tolerated(0.56) | benign(0) | TCGA-D1-A160-01 | Endometrium | uterine corpus endometrioid carcinoma | Female | >=65 | I/II | Unknown | Unknown | SD |
| CD59 | SNV | Missense_Mutation | novel | c.187N>G | p.Lys63Glu | p.K63E | P13987 | protein_coding | deleterious(0.02) | benign(0.001) | TCGA-EY-A215-01 | Endometrium | uterine corpus endometrioid carcinoma | Female | <65 | I/II | Unknown | Unknown | SD |
| CD59 | SNV | Missense_Mutation | rs146915059 | c.65N>T | p.Ser22Leu | p.S22L | P13987 | protein_coding | tolerated(0.23) | benign(0.015) | TCGA-FI-A2EW-01 | Endometrium | uterine corpus endometrioid carcinoma | Female | >=65 | I/II | Chemotherapy | carboplatinum | PD |
| CD59 | SNV | Missense_Mutation | rs759088791 | c.149C>T | p.Ala50Val | p.A50V | P13987 | protein_coding | tolerated(0.13) | benign(0.047) | TCGA-SJ-A6ZI-01 | Endometrium | uterine corpus endometrioid carcinoma | Female | <65 | I/II | Unknown | Unknown | SD |
| CD59 | insertion | Frame_Shift_Ins | novel | c.229_230insGTTTGAGCATTGCAATTTCAACGACGTCACAA | p.Thr77SerfsTer14 | p.T77Sfs*14 | P13987 | protein_coding | TCGA-44-4112-01 | Lung | lung adenocarcinoma | Female | <65 | I/II | Chemotherapy | cisplatin | PD | ||
| CD59 | SNV | Missense_Mutation | novel | c.148N>A | p.Ala50Thr | p.A50T | P13987 | protein_coding | tolerated(0.25) | benign(0.044) | TCGA-CQ-7071-01 | Oral cavity | head & neck squamous cell carcinoma | Female | >=65 | III/IV | Unknown | Unknown | SD |
| Page: 1 |
Top |
Related drugs of malignant transformation related genes |
| Identification of chemicals and drugs interact with genes involved in malignant transfromation |
| (DGIdb 4.0) |
| Entrez ID | Symbol | Category | Interaction Types | Drug Claim Name | Drug Name | PMIDs |
| 966 | CD59 | DRUGGABLE GENOME, CELL SURFACE, KINASE | MBL | 17113913 |
| Page: 1 |

Copyright 2023-Present -The University of Texas Health Science Center at Houston |