| Tissue | Expression Dynamics | Abbreviation |
| Breast | 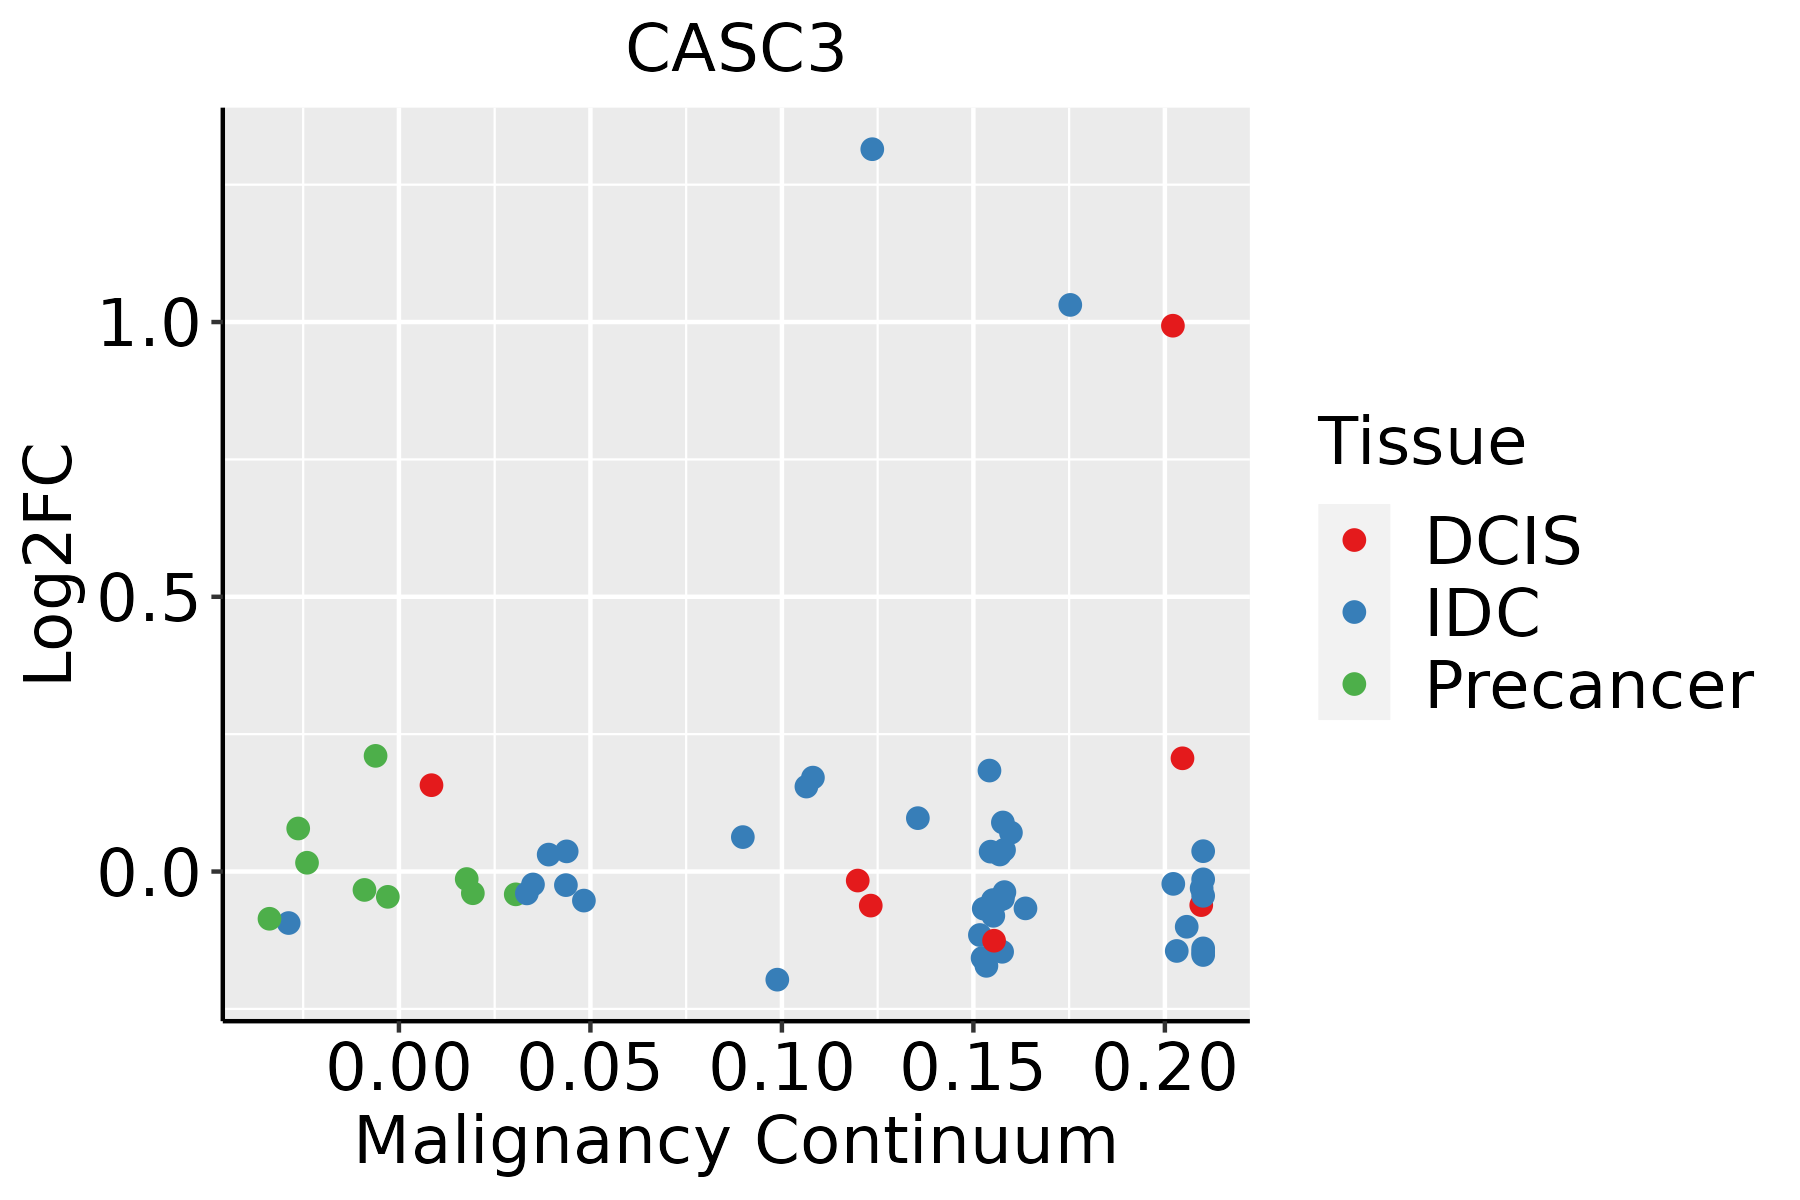 | IDC: Invasive ductal carcinoma |
| DCIS: Ductal carcinoma in situ |
| Precancer(BRCA1-mut): Precancerous lesion from BRCA1 mutation carriers |
| Esophagus | 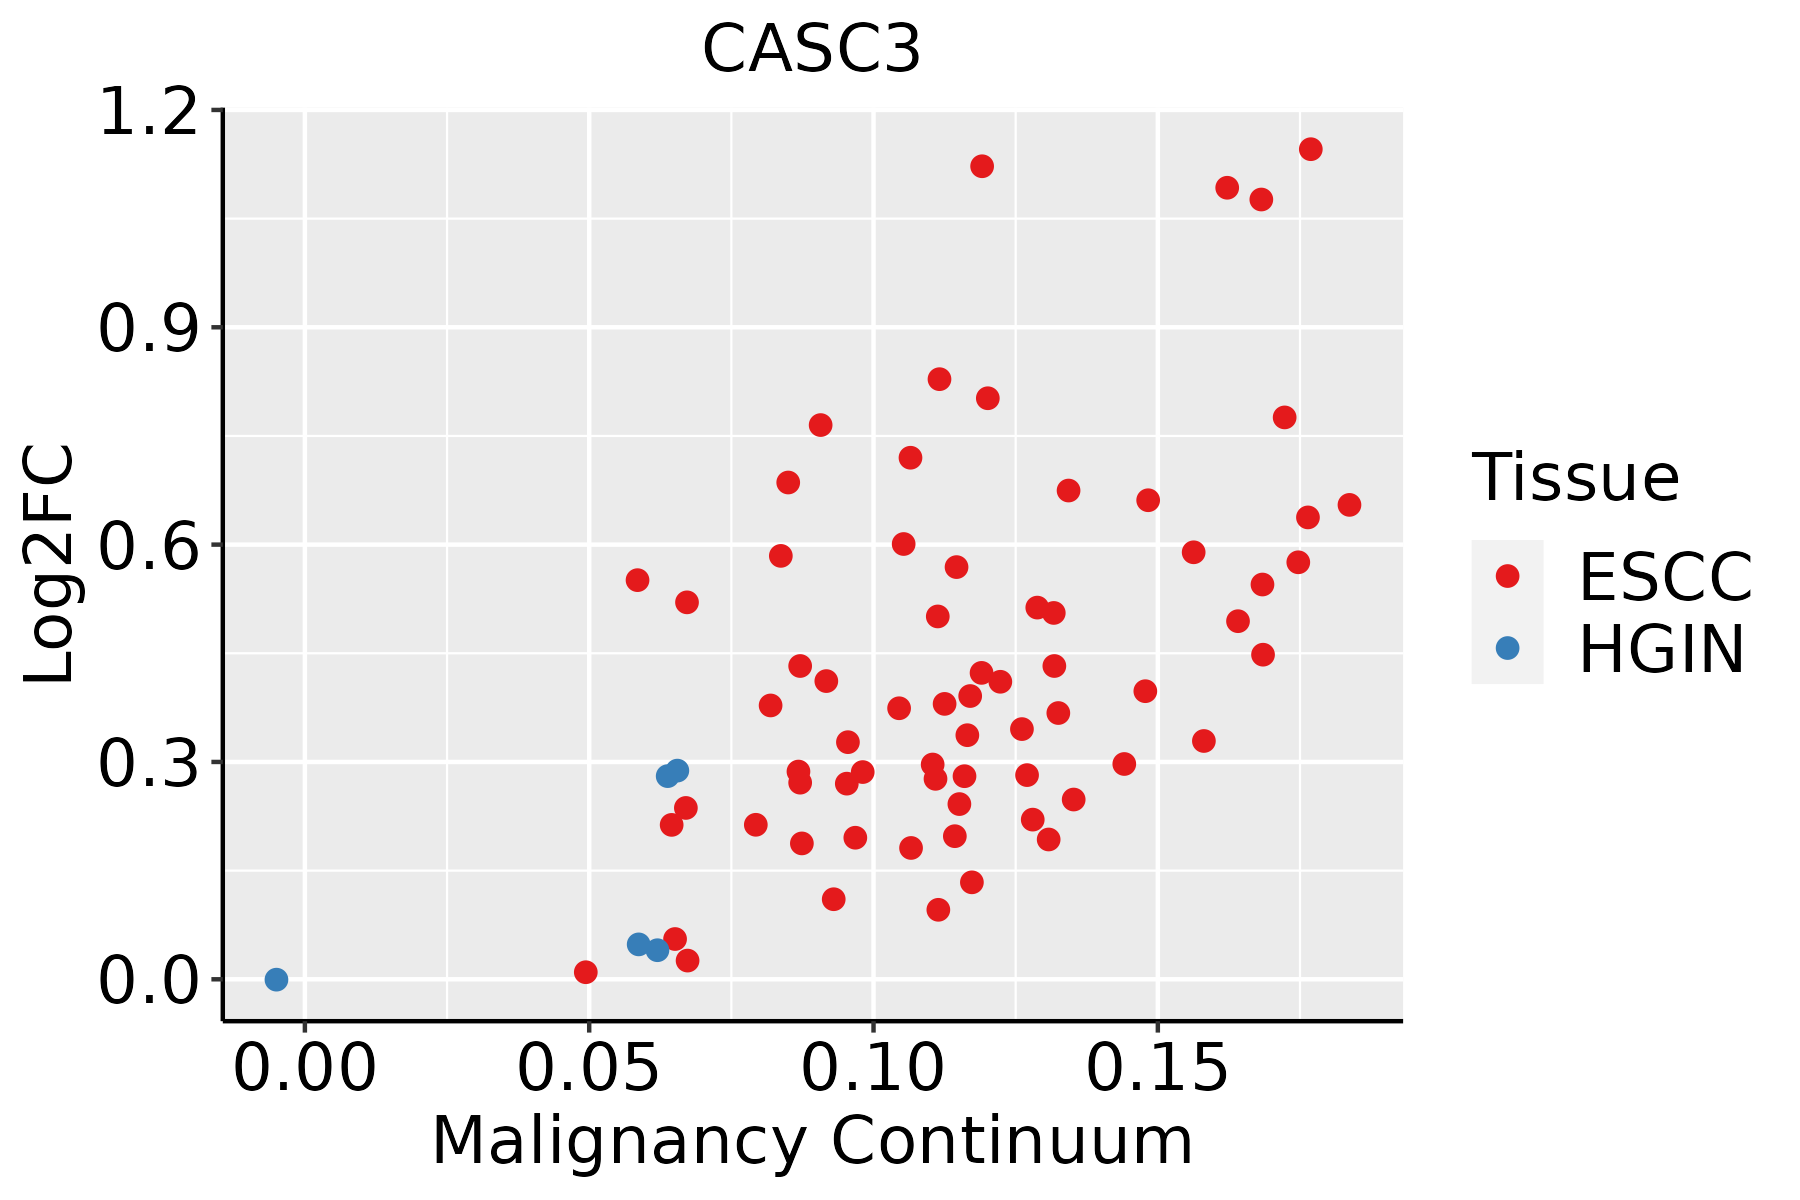 | ESCC: Esophageal squamous cell carcinoma |
| HGIN: High-grade intraepithelial neoplasias |
| LGIN: Low-grade intraepithelial neoplasias |
| Liver | 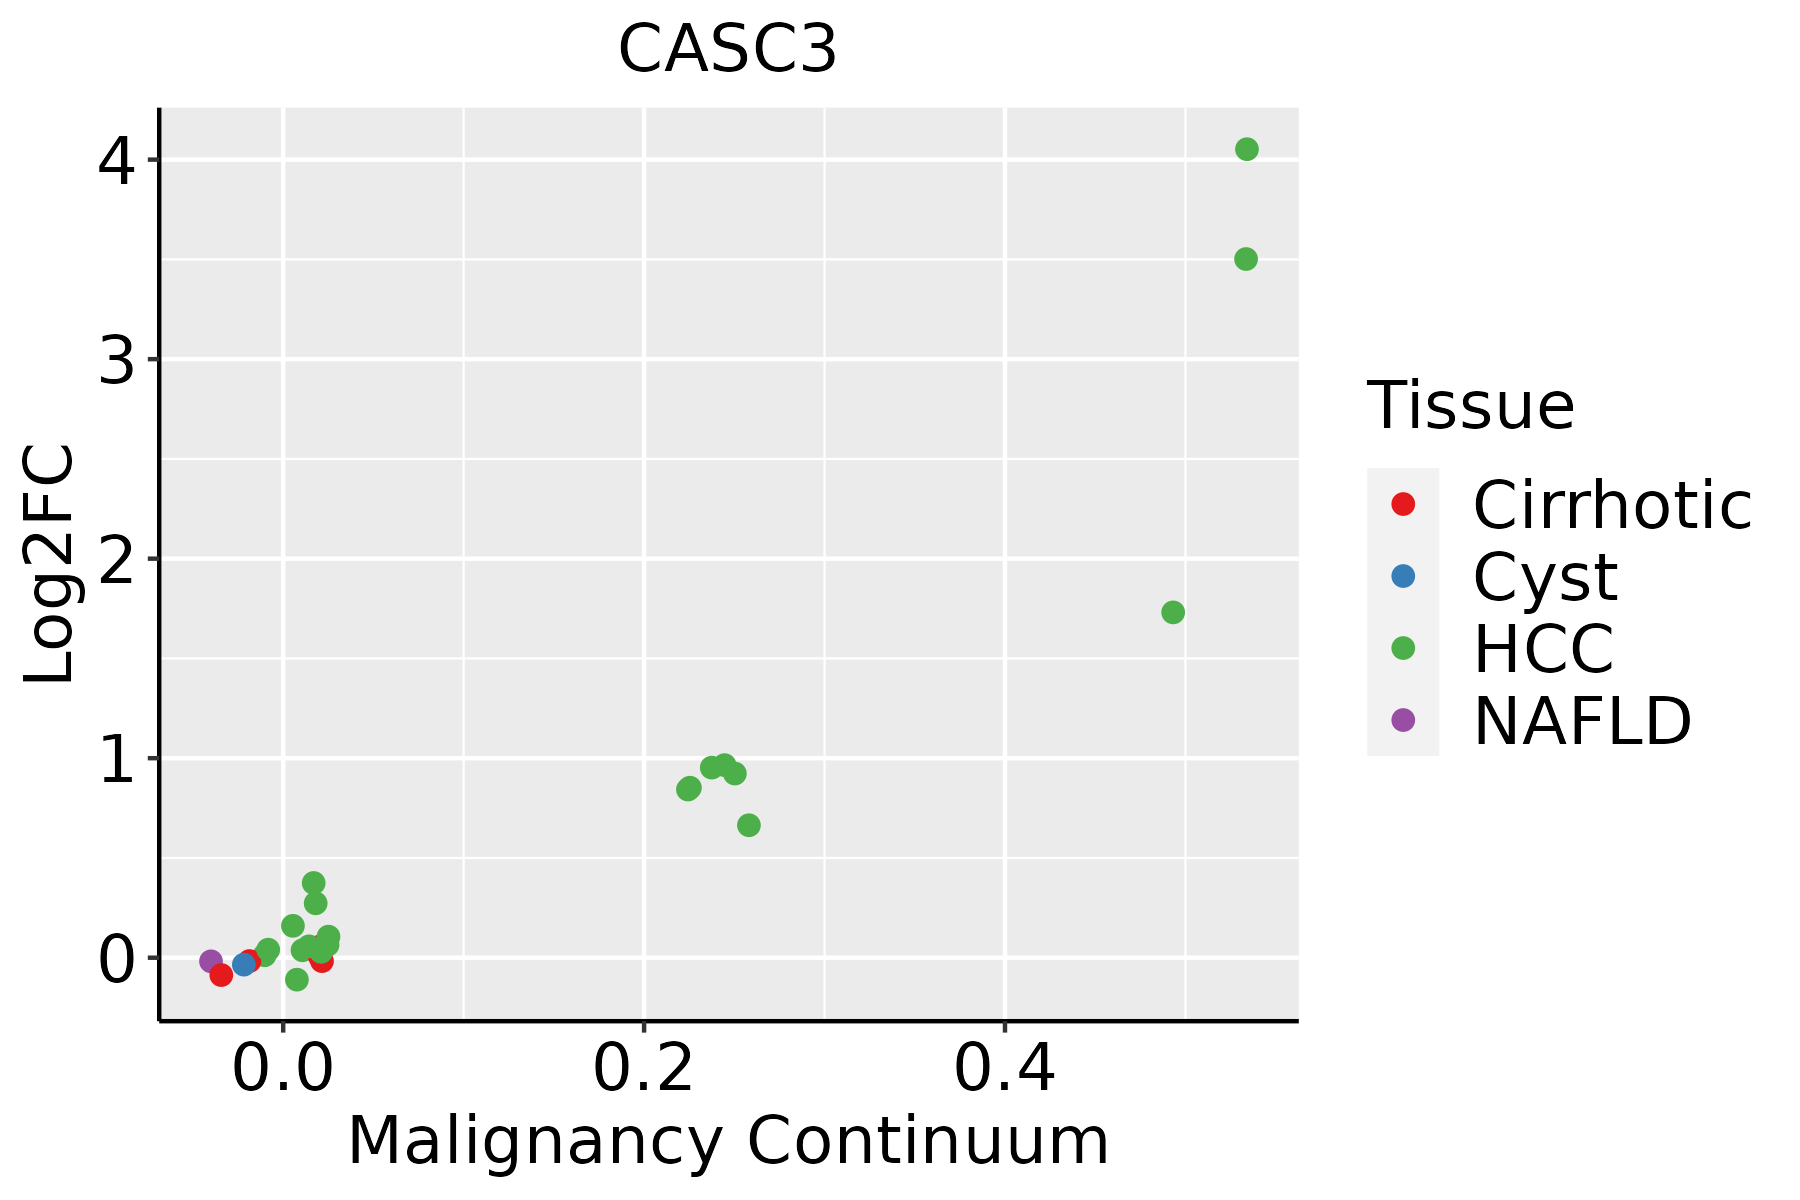 | HCC: Hepatocellular carcinoma |
| NAFLD: Non-alcoholic fatty liver disease |
| Oral Cavity | 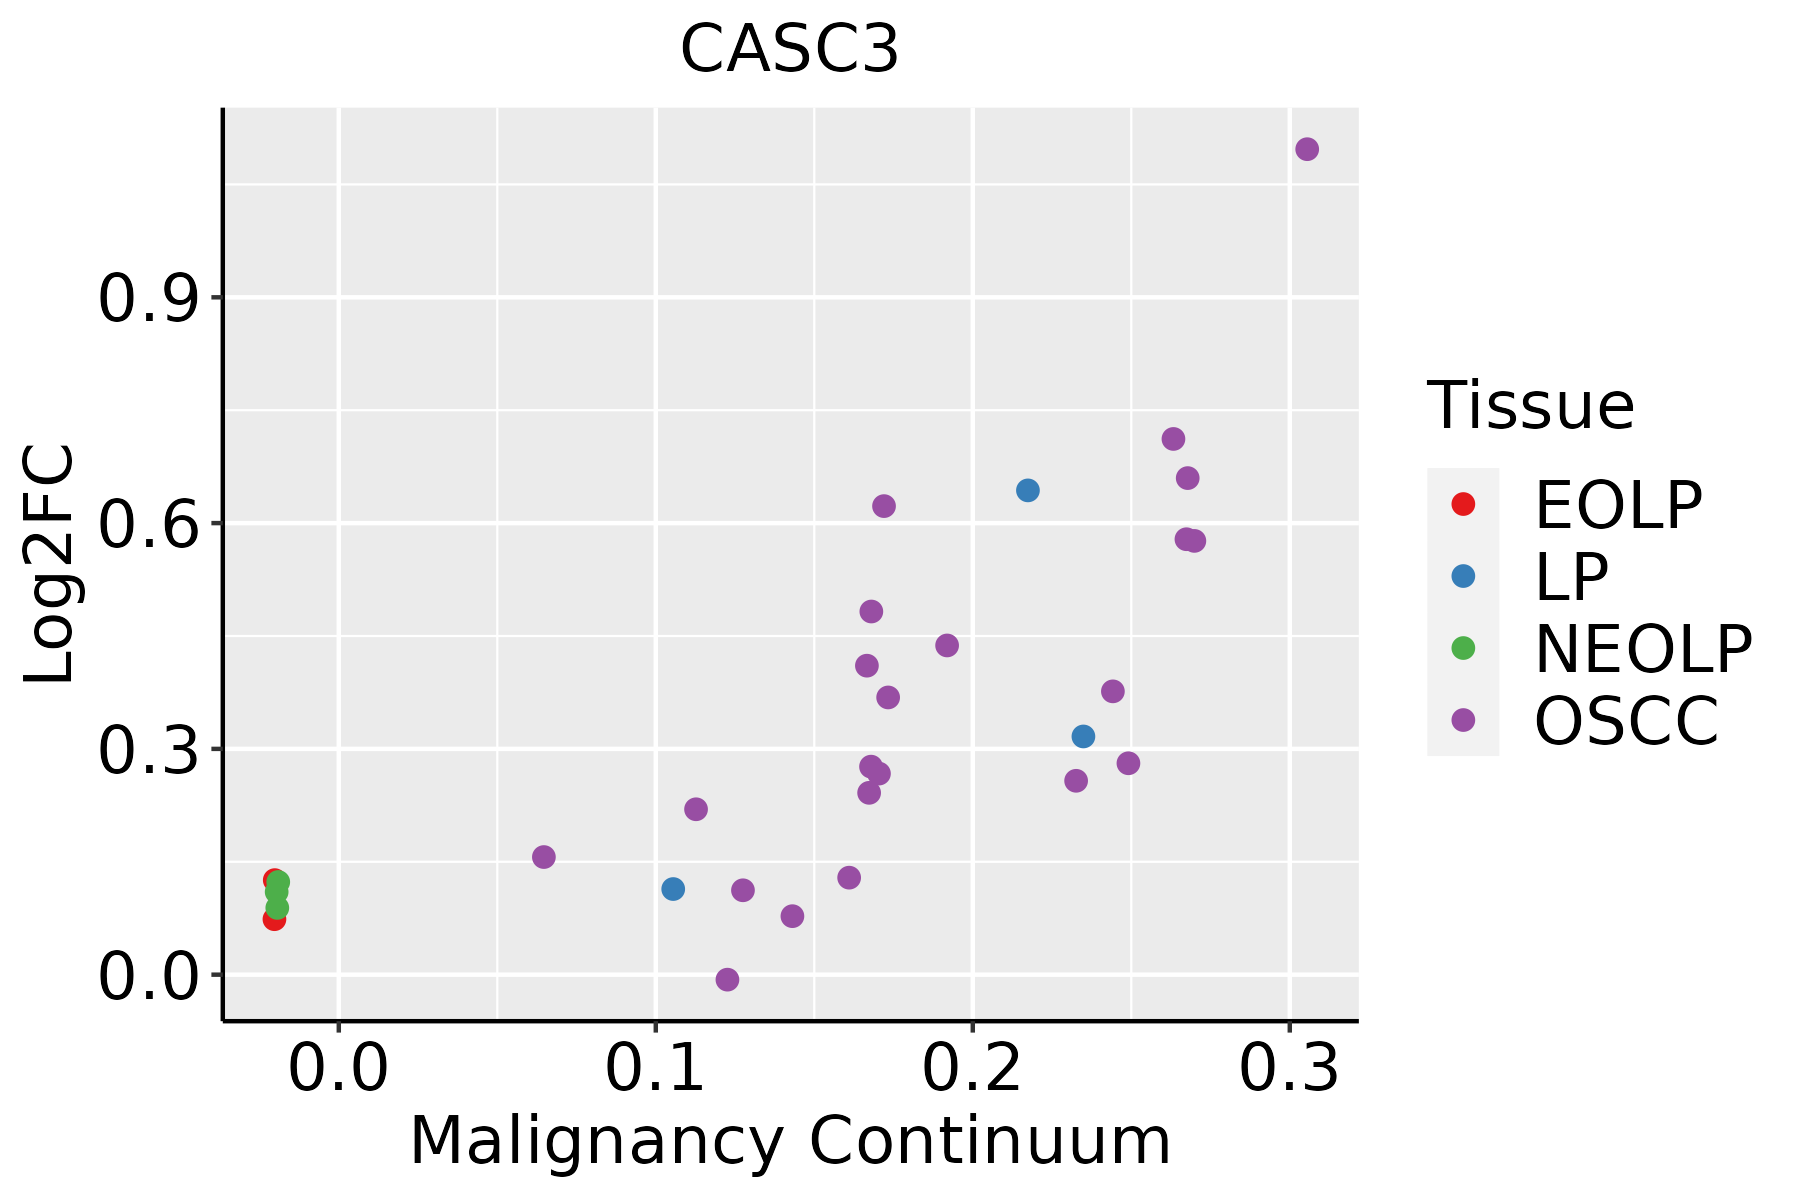 | EOLP: Erosive Oral lichen planus |
| LP: leukoplakia |
| NEOLP: Non-erosive oral lichen planus |
| OSCC: Oral squamous cell carcinoma |
| Prostate | 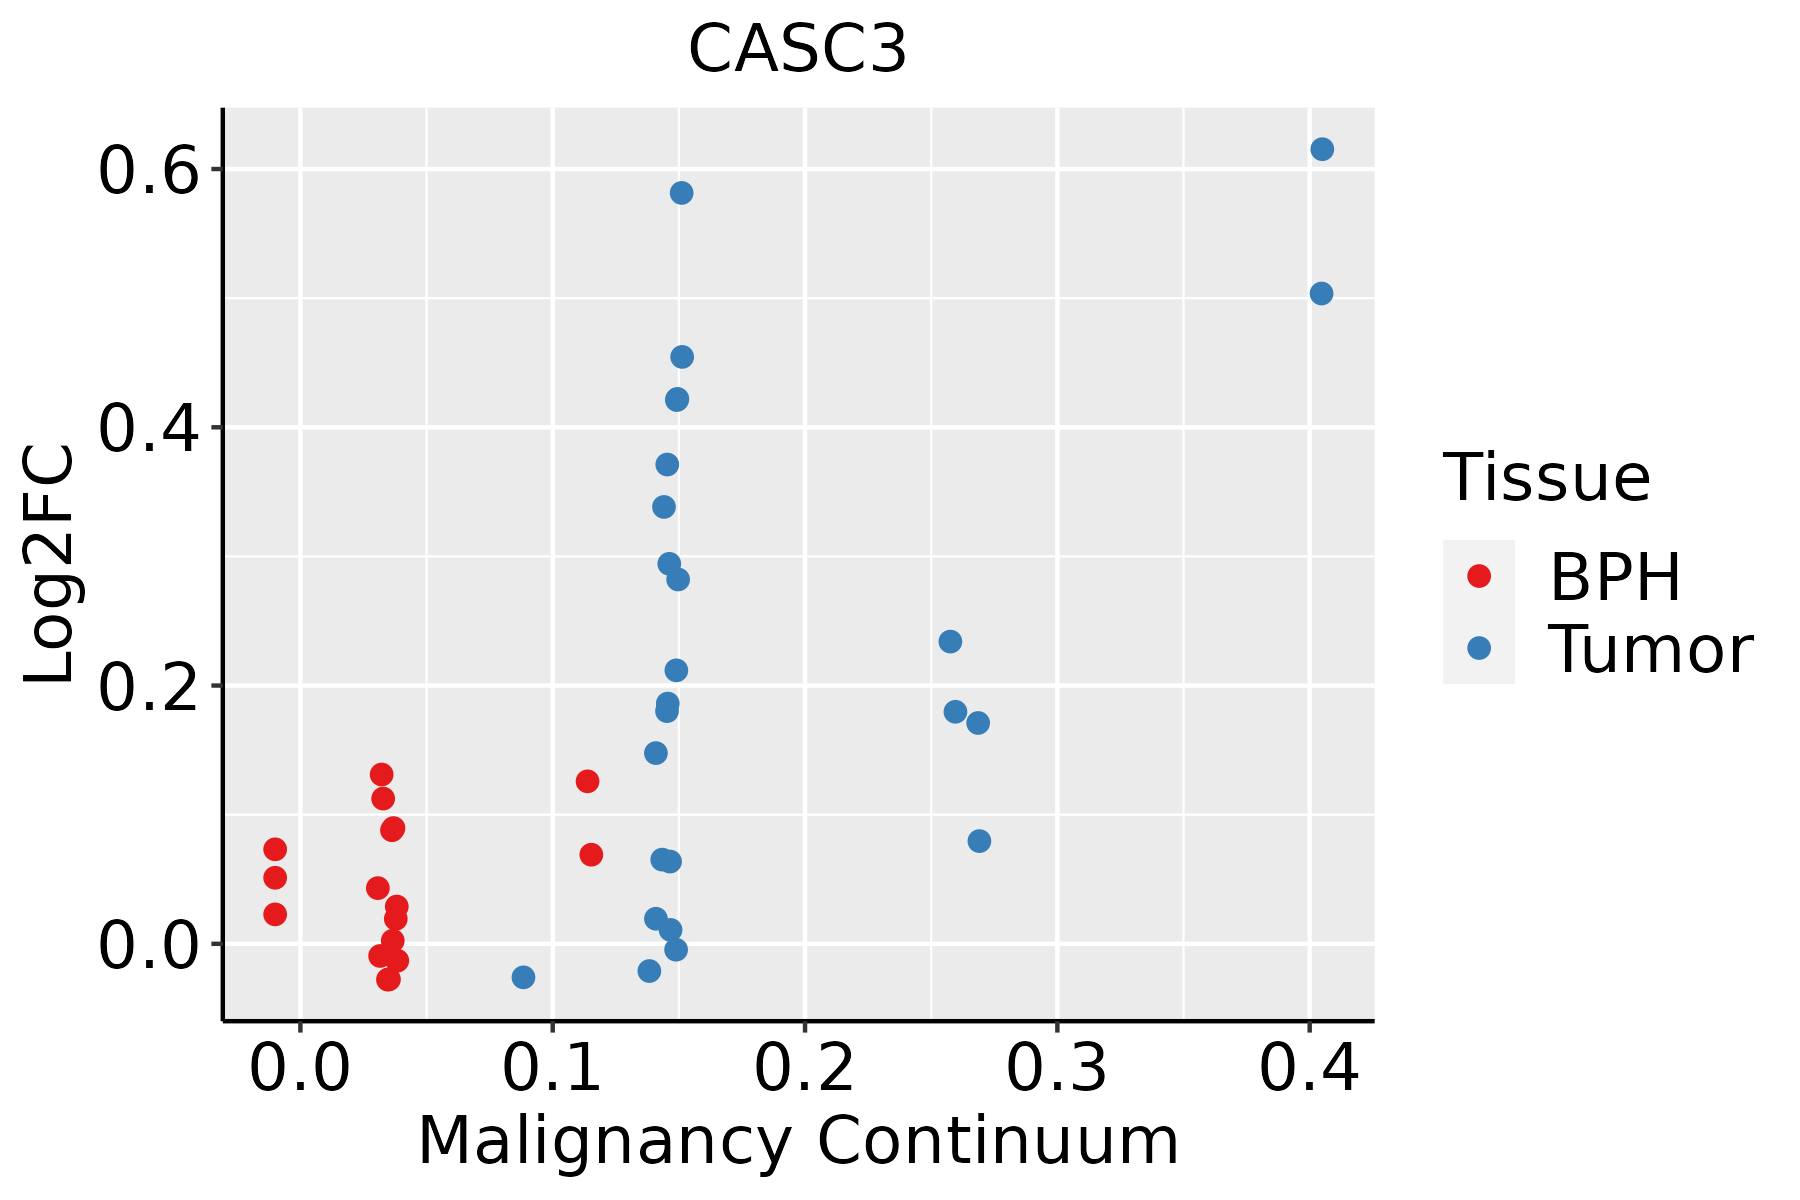 | BPH: Benign Prostatic Hyperplasia |
| Skin | 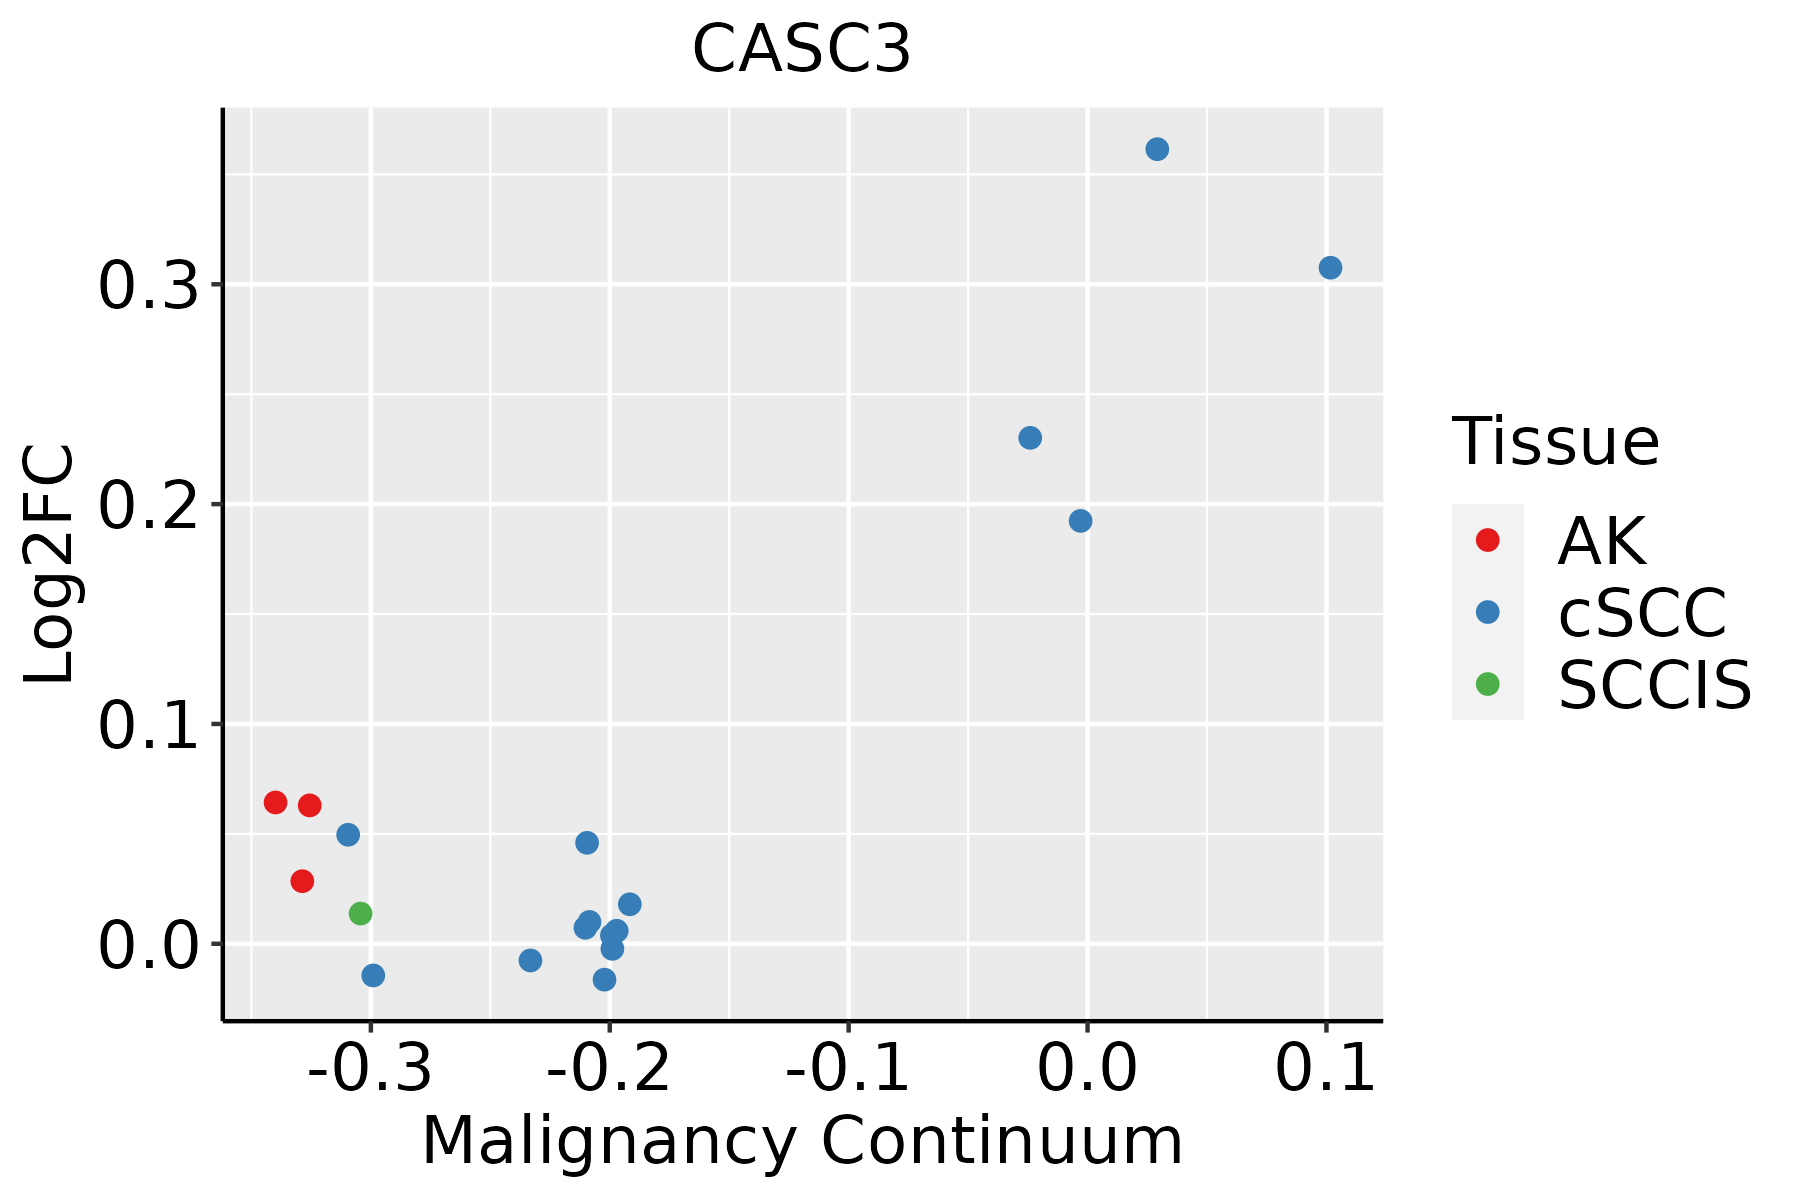 | AK: Actinic keratosis |
| cSCC: Cutaneous squamous cell carcinoma |
| SCCIS:squamous cell carcinoma in situ |
| Thyroid | 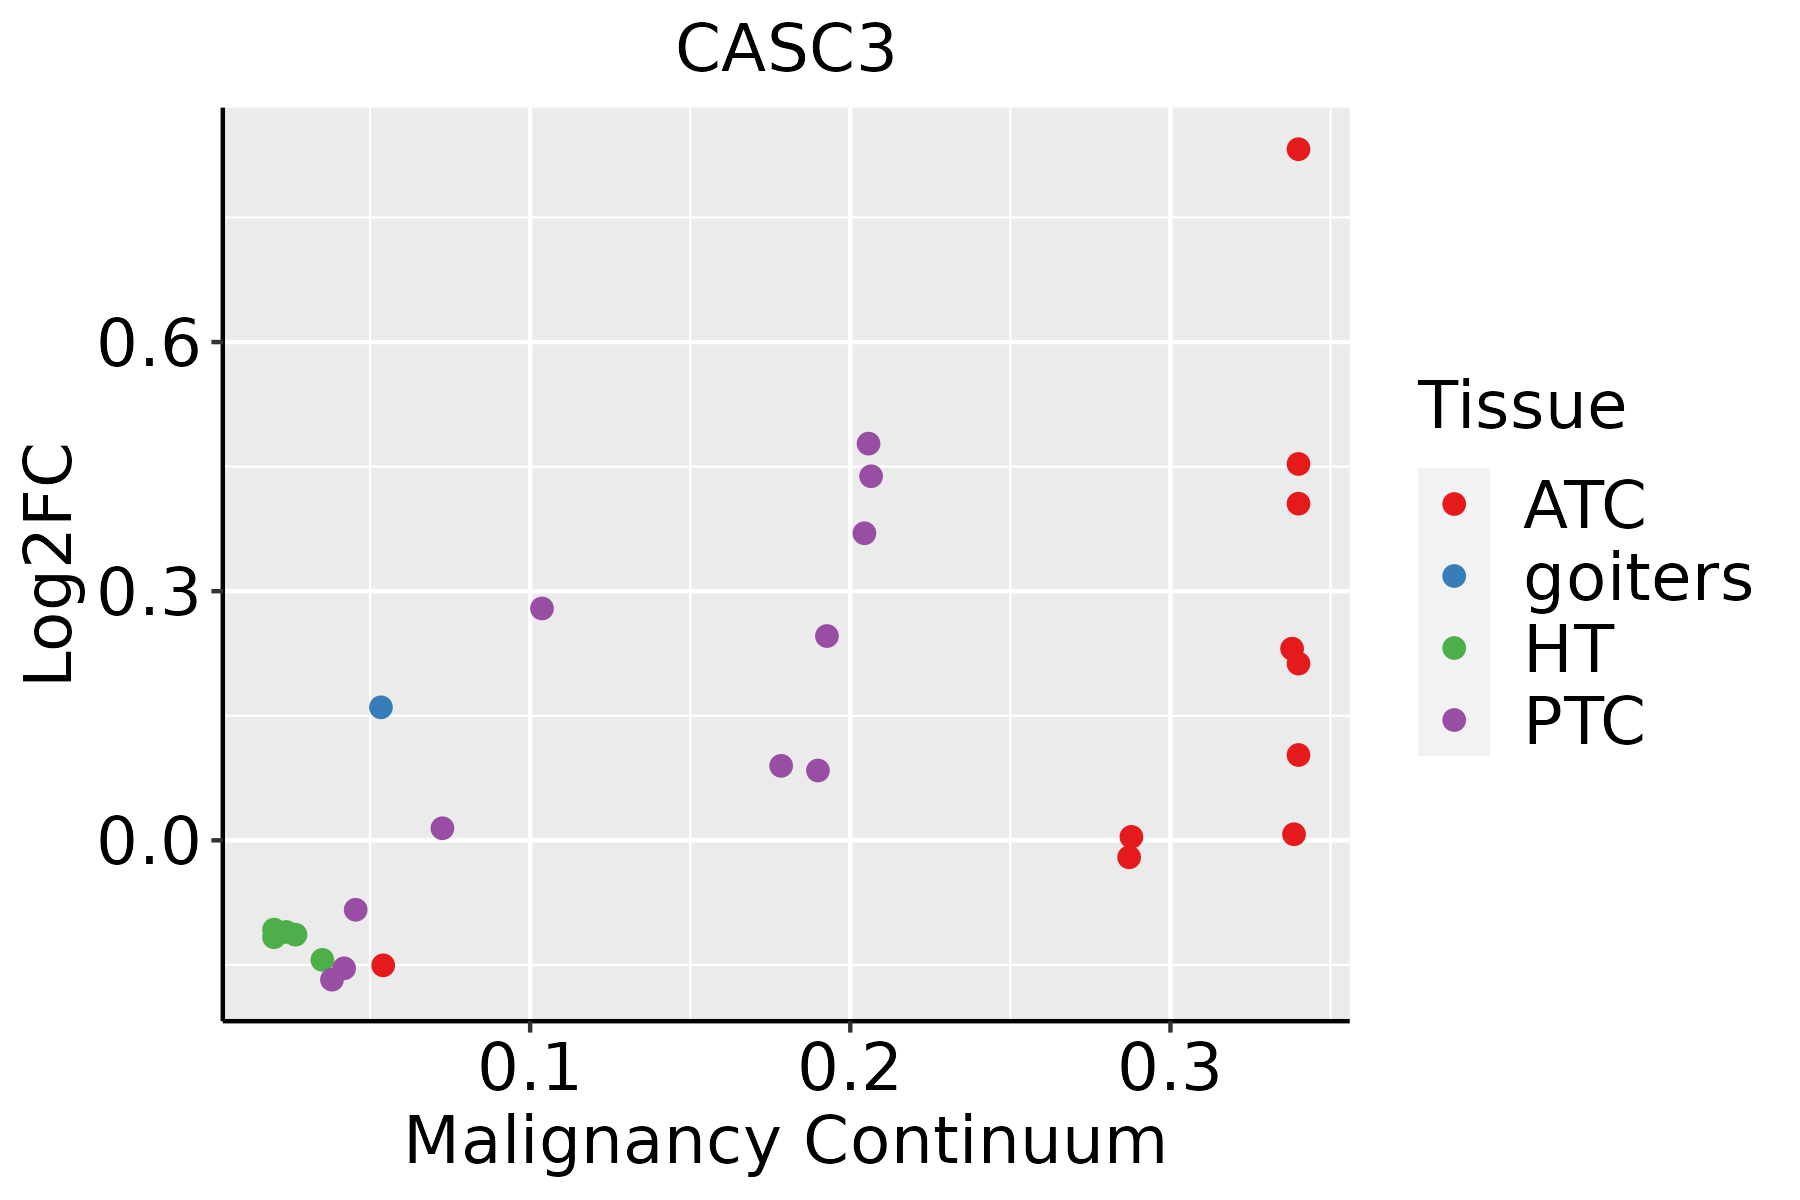 | ATC: Anaplastic thyroid cancer |
| HT: Hashimoto's thyroiditis |
| PTC: Papillary thyroid cancer |
| GO ID | Tissue | Disease Stage | Description | Gene Ratio | Bg Ratio | pvalue | p.adjust | Count |
| GO:000640218 | Oral cavity | OSCC | mRNA catabolic process | 156/7305 | 232/18723 | 2.13e-18 | 2.37e-16 | 156 |
| GO:000641720 | Oral cavity | OSCC | regulation of translation | 274/7305 | 468/18723 | 4.39e-18 | 4.63e-16 | 274 |
| GO:001593114 | Oral cavity | OSCC | nucleobase-containing compound transport | 150/7305 | 222/18723 | 4.86e-18 | 5.04e-16 | 150 |
| GO:003465517 | Oral cavity | OSCC | nucleobase-containing compound catabolic process | 244/7305 | 407/18723 | 5.38e-18 | 5.49e-16 | 244 |
| GO:004670015 | Oral cavity | OSCC | heterocycle catabolic process | 254/7305 | 445/18723 | 5.07e-15 | 3.31e-13 | 254 |
| GO:004427016 | Oral cavity | OSCC | cellular nitrogen compound catabolic process | 256/7305 | 451/18723 | 9.67e-15 | 5.88e-13 | 256 |
| GO:001943915 | Oral cavity | OSCC | aromatic compound catabolic process | 263/7305 | 467/18723 | 1.49e-14 | 8.84e-13 | 263 |
| GO:190136115 | Oral cavity | OSCC | organic cyclic compound catabolic process | 272/7305 | 495/18723 | 2.73e-13 | 1.36e-11 | 272 |
| GO:000095610 | Oral cavity | OSCC | nuclear-transcribed mRNA catabolic process | 81/7305 | 112/18723 | 7.95e-13 | 3.70e-11 | 81 |
| GO:00001845 | Oral cavity | OSCC | nuclear-transcribed mRNA catabolic process, nonsense-mediated decay | 31/7305 | 37/18723 | 2.80e-08 | 5.41e-07 | 31 |
| GO:00082982 | Oral cavity | OSCC | intracellular mRNA localization | 10/7305 | 13/18723 | 6.32e-03 | 2.35e-02 | 10 |
| GO:000838019 | Prostate | Tumor | RNA splicing | 153/3246 | 434/18723 | 9.15e-20 | 5.79e-17 | 153 |
| GO:000641719 | Prostate | Tumor | regulation of translation | 161/3246 | 468/18723 | 1.55e-19 | 8.74e-17 | 161 |
| GO:000037518 | Prostate | Tumor | RNA splicing, via transesterification reactions | 119/3246 | 324/18723 | 3.40e-17 | 1.06e-14 | 119 |
| GO:000037718 | Prostate | Tumor | RNA splicing, via transesterification reactions with bulged adenosine as nucleophile | 117/3246 | 320/18723 | 9.31e-17 | 2.22e-14 | 117 |
| GO:000039818 | Prostate | Tumor | mRNA splicing, via spliceosome | 117/3246 | 320/18723 | 9.31e-17 | 2.22e-14 | 117 |
| GO:000640217 | Prostate | Tumor | mRNA catabolic process | 87/3246 | 232/18723 | 1.56e-13 | 1.73e-11 | 87 |
| GO:000640117 | Prostate | Tumor | RNA catabolic process | 94/3246 | 278/18723 | 1.77e-11 | 1.25e-09 | 94 |
| GO:000640317 | Prostate | Tumor | RNA localization | 70/3246 | 201/18723 | 1.58e-09 | 7.32e-08 | 70 |
| GO:000095615 | Prostate | Tumor | nuclear-transcribed mRNA catabolic process | 46/3246 | 112/18723 | 2.80e-09 | 1.17e-07 | 46 |
| Pathway ID | Tissue | Disease Stage | Description | Gene Ratio | Bg Ratio | pvalue | p.adjust | qvalue | Count |
| hsa0301321 | Esophagus | ESCC | Nucleocytoplasmic transport | 89/4205 | 108/8465 | 1.20e-12 | 2.37e-11 | 1.21e-11 | 89 |
| hsa0301524 | Esophagus | ESCC | mRNA surveillance pathway | 72/4205 | 97/8465 | 6.12e-07 | 4.10e-06 | 2.10e-06 | 72 |
| hsa0301331 | Esophagus | ESCC | Nucleocytoplasmic transport | 89/4205 | 108/8465 | 1.20e-12 | 2.37e-11 | 1.21e-11 | 89 |
| hsa0301534 | Esophagus | ESCC | mRNA surveillance pathway | 72/4205 | 97/8465 | 6.12e-07 | 4.10e-06 | 2.10e-06 | 72 |
| hsa03013 | Liver | HCC | Nucleocytoplasmic transport | 81/4020 | 108/8465 | 4.28e-09 | 6.83e-08 | 3.80e-08 | 81 |
| hsa0301521 | Liver | HCC | mRNA surveillance pathway | 66/4020 | 97/8465 | 3.16e-05 | 1.88e-04 | 1.04e-04 | 66 |
| hsa030131 | Liver | HCC | Nucleocytoplasmic transport | 81/4020 | 108/8465 | 4.28e-09 | 6.83e-08 | 3.80e-08 | 81 |
| hsa0301531 | Liver | HCC | mRNA surveillance pathway | 66/4020 | 97/8465 | 3.16e-05 | 1.88e-04 | 1.04e-04 | 66 |
| hsa030136 | Oral cavity | OSCC | Nucleocytoplasmic transport | 82/3704 | 108/8465 | 7.93e-12 | 1.33e-10 | 6.77e-11 | 82 |
| hsa030158 | Oral cavity | OSCC | mRNA surveillance pathway | 75/3704 | 97/8465 | 1.30e-11 | 2.01e-10 | 1.02e-10 | 75 |
| hsa0301311 | Oral cavity | OSCC | Nucleocytoplasmic transport | 82/3704 | 108/8465 | 7.93e-12 | 1.33e-10 | 6.77e-11 | 82 |
| hsa0301513 | Oral cavity | OSCC | mRNA surveillance pathway | 75/3704 | 97/8465 | 1.30e-11 | 2.01e-10 | 1.02e-10 | 75 |
| Hugo Symbol | Variant Class | Variant Classification | dbSNP RS | HGVSc | HGVSp | HGVSp Short | SWISSPROT | BIOTYPE | SIFT | PolyPhen | Tumor Sample Barcode | Tissue | Histology | Sex | Age | Stage | Therapy Types | Drugs | Outcome |
| CASC3 | SNV | Missense_Mutation | | c.1370N>T | p.Ser457Phe | p.S457F | O15234 | protein_coding | deleterious_low_confidence(0) | possibly_damaging(0.77) | TCGA-AC-A23H-01 | Breast | breast invasive carcinoma | Female | >=65 | I/II | Unknown | Unknown | PD |
| CASC3 | SNV | Missense_Mutation | rs748828823 | c.1264G>A | p.Glu422Lys | p.E422K | O15234 | protein_coding | tolerated_low_confidence(0.05) | benign(0.321) | TCGA-C5-A1MH-01 | Cervix | cervical & endocervical cancer | Female | >=65 | III/IV | Chemotherapy | cisplatin | PD |
| CASC3 | SNV | Missense_Mutation | rs139973585 | c.1013N>A | p.Arg338Gln | p.R338Q | O15234 | protein_coding | tolerated_low_confidence(0.12) | benign(0.143) | TCGA-C5-A8YQ-01 | Cervix | cervical & endocervical cancer | Female | >=65 | I/II | Chemotherapy | cisplatin | PD |
| CASC3 | SNV | Missense_Mutation | novel | c.70G>A | p.Asp24Asn | p.D24N | O15234 | protein_coding | deleterious_low_confidence(0.03) | benign(0.003) | TCGA-DS-A1OC-01 | Cervix | cervical & endocervical cancer | Female | <65 | I/II | Chemotherapy | gemcitabine | SD |
| CASC3 | SNV | Missense_Mutation | novel | c.71A>C | p.Asp24Ala | p.D24A | O15234 | protein_coding | tolerated_low_confidence(0.3) | benign(0.039) | TCGA-DS-A1OC-01 | Cervix | cervical & endocervical cancer | Female | <65 | I/II | Chemotherapy | gemcitabine | SD |
| CASC3 | SNV | Missense_Mutation | novel | c.514G>A | p.Asp172Asn | p.D172N | O15234 | protein_coding | deleterious(0) | probably_damaging(0.993) | TCGA-JW-A5VL-01 | Cervix | cervical & endocervical cancer | Female | <65 | I/II | Unknown | Unknown | SD |
| CASC3 | SNV | Missense_Mutation | | c.1940C>G | p.Pro647Arg | p.P647R | O15234 | protein_coding | tolerated_low_confidence(0.06) | probably_damaging(0.999) | TCGA-LP-A4AV-01 | Cervix | cervical & endocervical cancer | Female | <65 | I/II | Unknown | Unknown | SD |
| CASC3 | SNV | Missense_Mutation | novel | c.46G>A | p.Glu16Lys | p.E16K | O15234 | protein_coding | deleterious_low_confidence(0.01) | benign(0.269) | TCGA-VS-A9UZ-01 | Cervix | cervical & endocervical cancer | Female | <65 | I/II | Unknown | Unknown | SD |
| CASC3 | insertion | Frame_Shift_Ins | novel | c.161_162insGATCCTTCTAAAT | p.Arg55IlefsTer23 | p.R55Ifs*23 | O15234 | protein_coding | | | TCGA-DS-A1OB-01 | Cervix | cervical & endocervical cancer | Female | <65 | I/II | Chemotherapy | carboplatin | PD |
| CASC3 | insertion | Frame_Shift_Ins | novel | c.1054_1055insCGTTCCAGTTT | p.Arg352ProfsTer7 | p.R352Pfs*7 | O15234 | protein_coding | | | TCGA-DS-A1OB-01 | Cervix | cervical & endocervical cancer | Female | <65 | I/II | Chemotherapy | carboplatin | PD |


