
|
|||||
|
 | |
| |
| |
| |
| |
| |
|
Gene: CA2 |
Gene summary for CA2 |
| Gene information | Species | Human | Gene symbol | CA2 | Gene ID | 760 |
| Gene name | carbonic anhydrase 2 | |
| Gene Alias | CA-II | |
| Cytomap | 8q21.2 | |
| Gene Type | protein-coding | GO ID | GO:0001655 | UniProtAcc | P00918 |
Top |
Malignant transformation analysis |
| Identification of the aberrant gene expression in precancerous and cancerous lesions by comparing the gene expression of stem-like cells in diseased tissues with normal stem cells |
| Entrez ID | Symbol | Replicates | Species | Organ | Tissue | Adj P-value | Log2FC | Malignancy |
| 760 | CA2 | GSM4909282 | Human | Breast | IDC | 2.46e-02 | -2.95e-01 | -0.0288 |
| 760 | CA2 | GSM4909286 | Human | Breast | IDC | 7.93e-11 | -3.78e-01 | 0.1081 |
| 760 | CA2 | GSM4909287 | Human | Breast | IDC | 2.09e-07 | -3.42e-01 | 0.2057 |
| 760 | CA2 | GSM4909291 | Human | Breast | IDC | 1.17e-04 | -3.56e-01 | 0.1753 |
| 760 | CA2 | GSM4909293 | Human | Breast | IDC | 1.49e-04 | -3.48e-01 | 0.1581 |
| 760 | CA2 | GSM4909294 | Human | Breast | IDC | 1.31e-05 | -3.34e-01 | 0.2022 |
| 760 | CA2 | GSM4909297 | Human | Breast | IDC | 2.47e-13 | 5.58e-01 | 0.1517 |
| 760 | CA2 | GSM4909298 | Human | Breast | IDC | 3.45e-04 | -3.21e-01 | 0.1551 |
| 760 | CA2 | GSM4909301 | Human | Breast | IDC | 6.32e-11 | -3.73e-01 | 0.1577 |
| 760 | CA2 | GSM4909302 | Human | Breast | IDC | 9.71e-13 | -3.67e-01 | 0.1545 |
| 760 | CA2 | GSM4909306 | Human | Breast | IDC | 1.59e-05 | -3.21e-01 | 0.1564 |
| 760 | CA2 | GSM4909307 | Human | Breast | IDC | 8.07e-09 | -3.56e-01 | 0.1569 |
| 760 | CA2 | GSM4909308 | Human | Breast | IDC | 4.53e-13 | -3.79e-01 | 0.158 |
| 760 | CA2 | GSM4909309 | Human | Breast | IDC | 1.15e-03 | -3.01e-01 | 0.0483 |
| 760 | CA2 | GSM4909311 | Human | Breast | IDC | 2.87e-07 | -3.20e-01 | 0.1534 |
| 760 | CA2 | GSM4909312 | Human | Breast | IDC | 5.27e-09 | -3.66e-01 | 0.1552 |
| 760 | CA2 | GSM4909313 | Human | Breast | IDC | 5.15e-04 | -3.12e-01 | 0.0391 |
| 760 | CA2 | GSM4909315 | Human | Breast | IDC | 6.74e-13 | -3.79e-01 | 0.21 |
| 760 | CA2 | GSM4909316 | Human | Breast | IDC | 2.04e-03 | -3.79e-01 | 0.21 |
| 760 | CA2 | GSM4909319 | Human | Breast | IDC | 5.52e-12 | -3.76e-01 | 0.1563 |
| Page: 1 2 3 4 5 6 7 8 9 10 |
| Tissue | Expression Dynamics | Abbreviation |
| Breast | 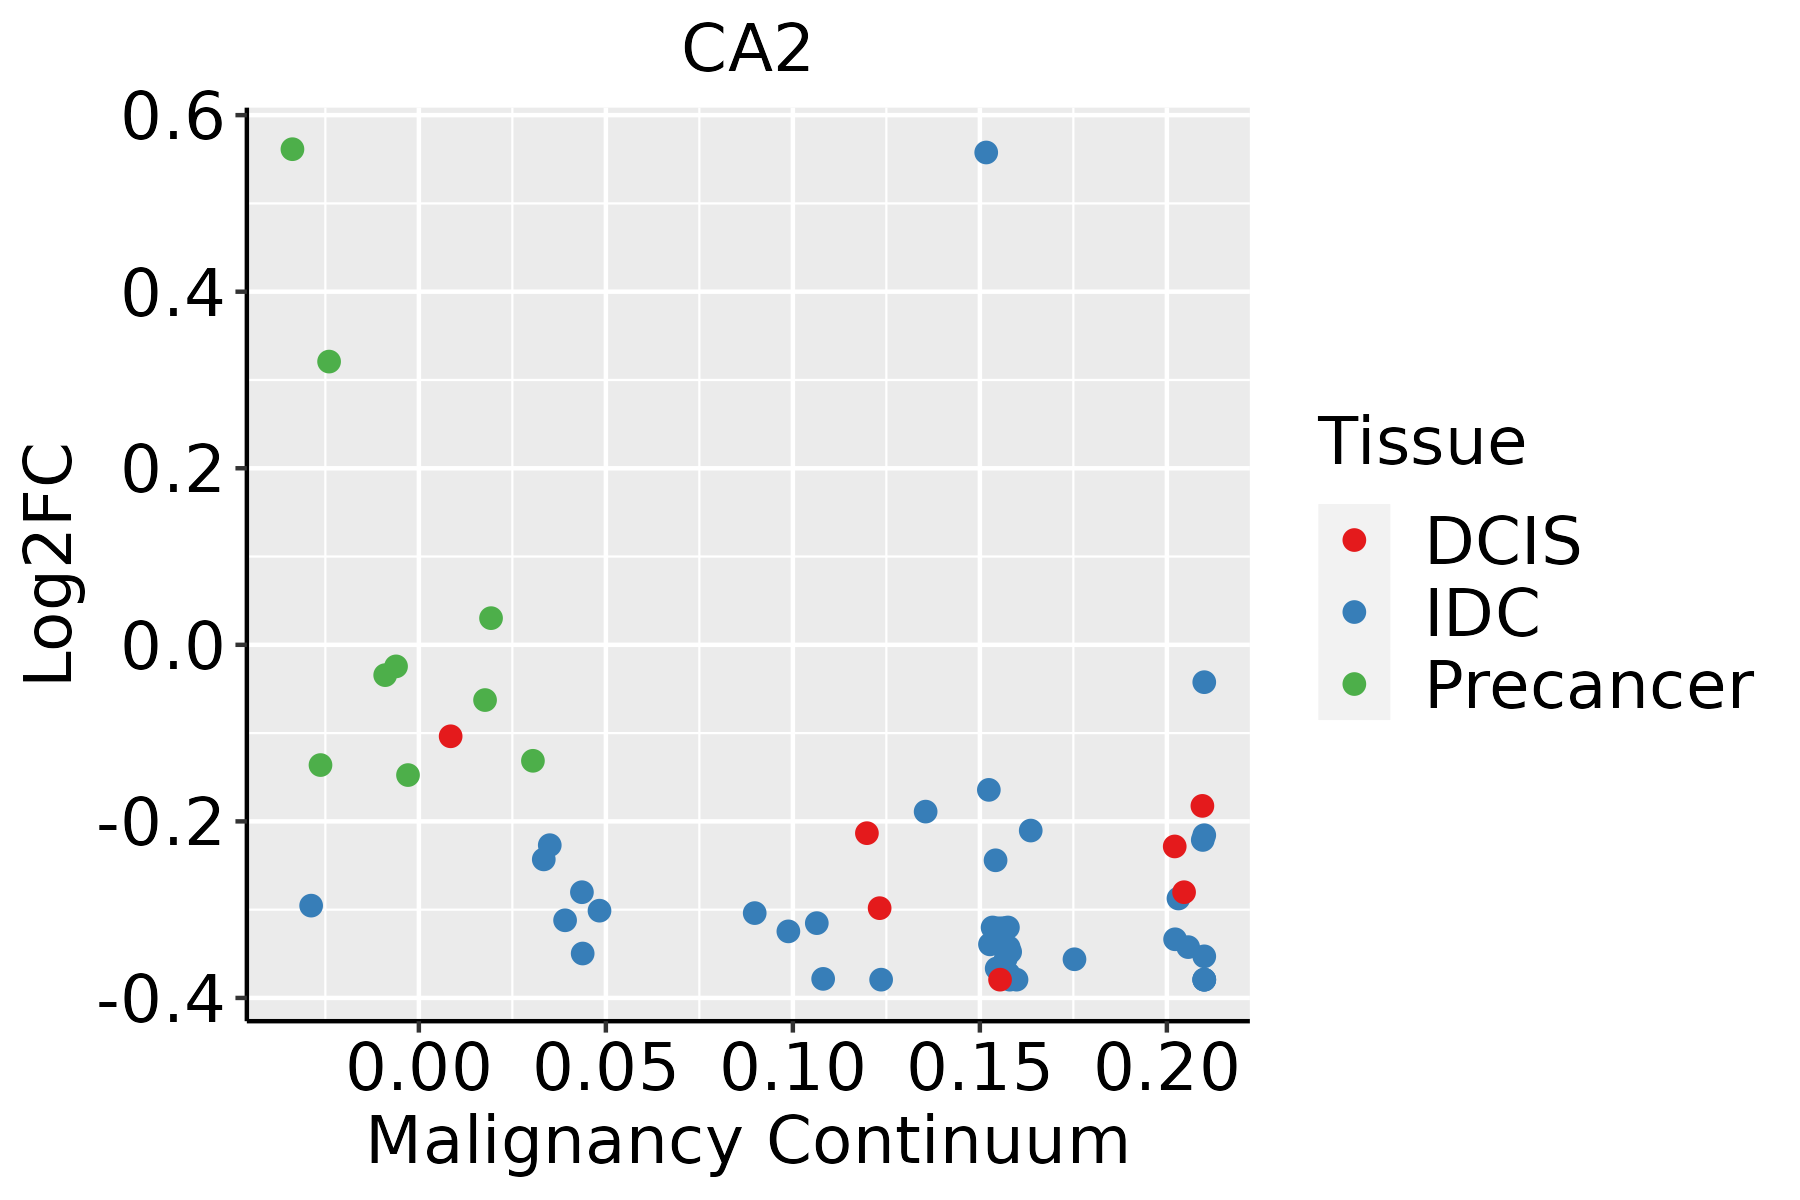 | IDC: Invasive ductal carcinoma |
| DCIS: Ductal carcinoma in situ | ||
| Precancer(BRCA1-mut): Precancerous lesion from BRCA1 mutation carriers | ||
| Cervix | 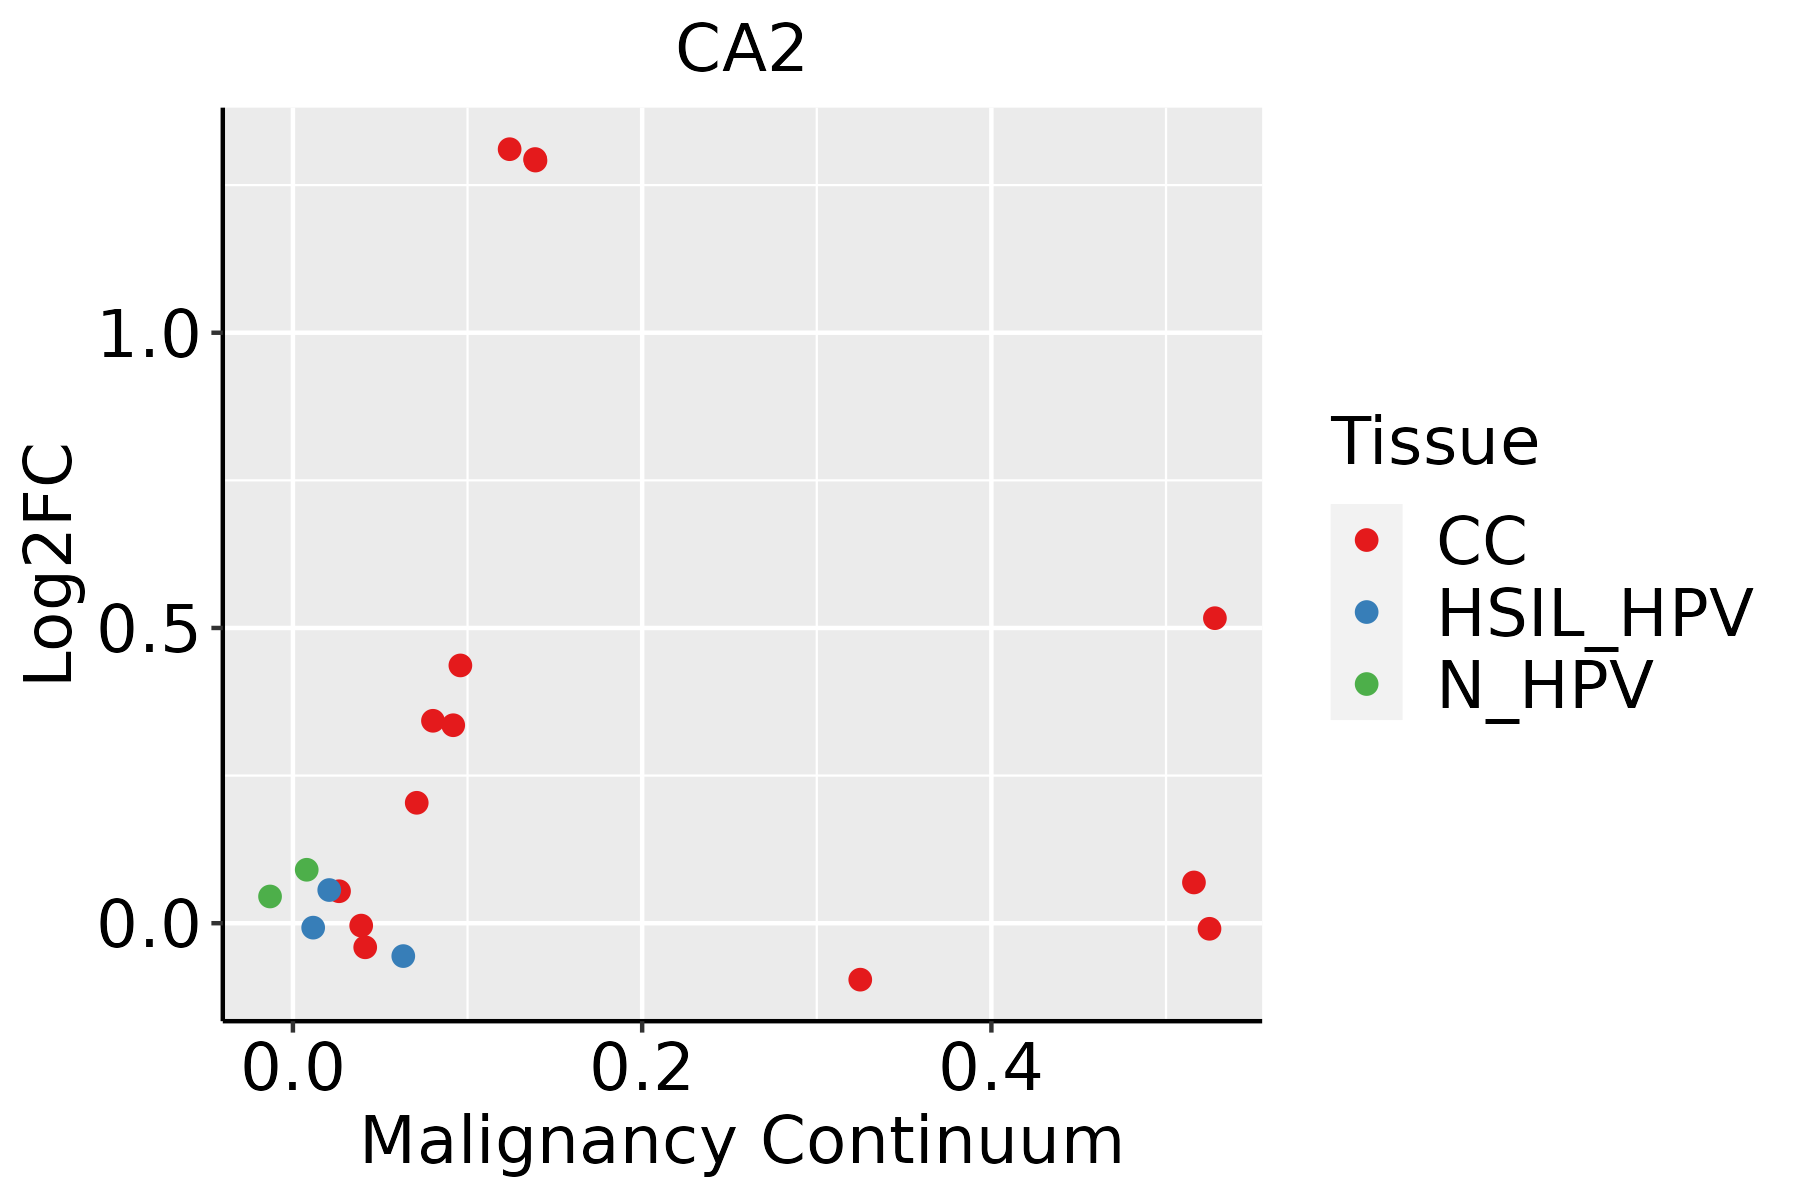 | CC: Cervix cancer |
| HSIL_HPV: HPV-infected high-grade squamous intraepithelial lesions | ||
| N_HPV: HPV-infected normal cervix | ||
| Colorectum (GSE201348) | 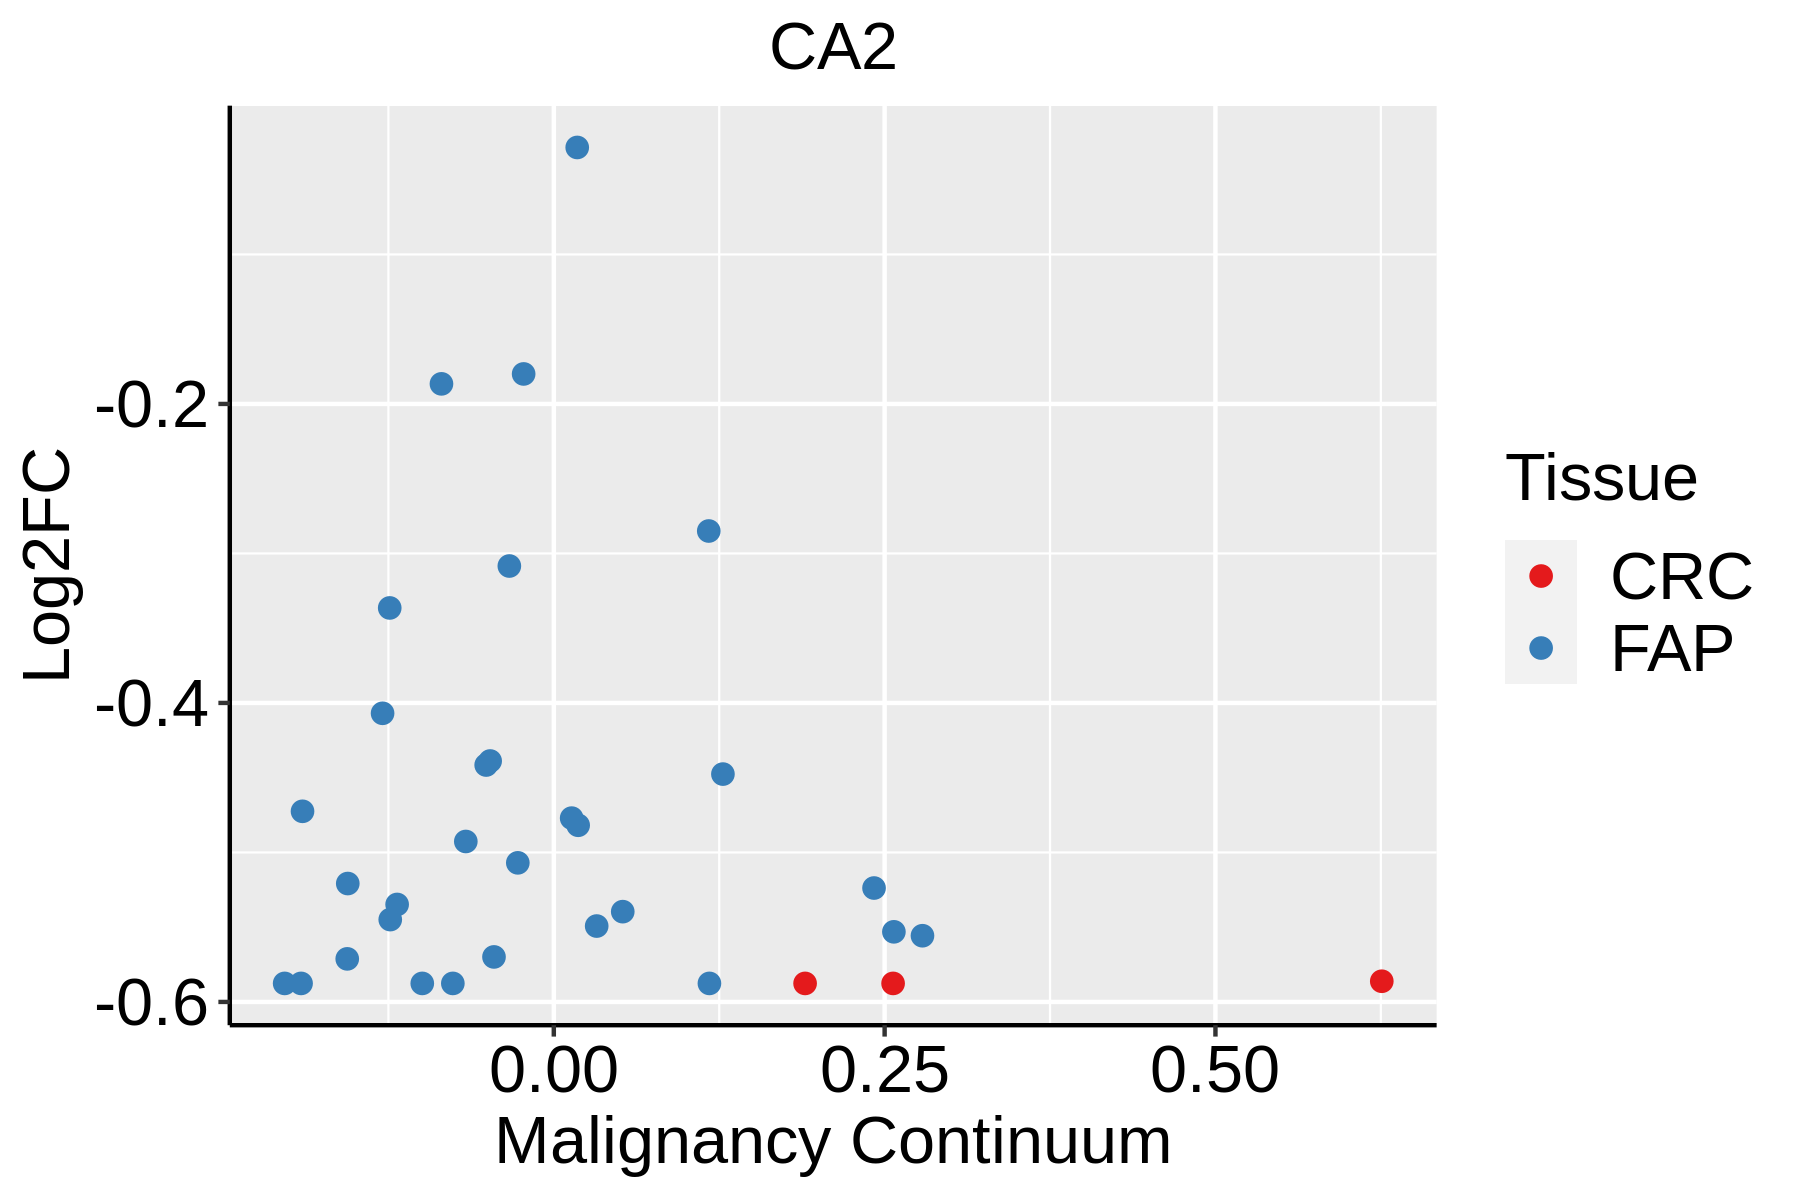 | FAP: Familial adenomatous polyposis |
| CRC: Colorectal cancer | ||
| Colorectum (HTA11) |  | AD: Adenomas |
| SER: Sessile serrated lesions | ||
| MSI-H: Microsatellite-high colorectal cancer | ||
| MSS: Microsatellite stable colorectal cancer | ||
| Esophagus |  | ESCC: Esophageal squamous cell carcinoma |
| HGIN: High-grade intraepithelial neoplasias | ||
| LGIN: Low-grade intraepithelial neoplasias | ||
| GC | 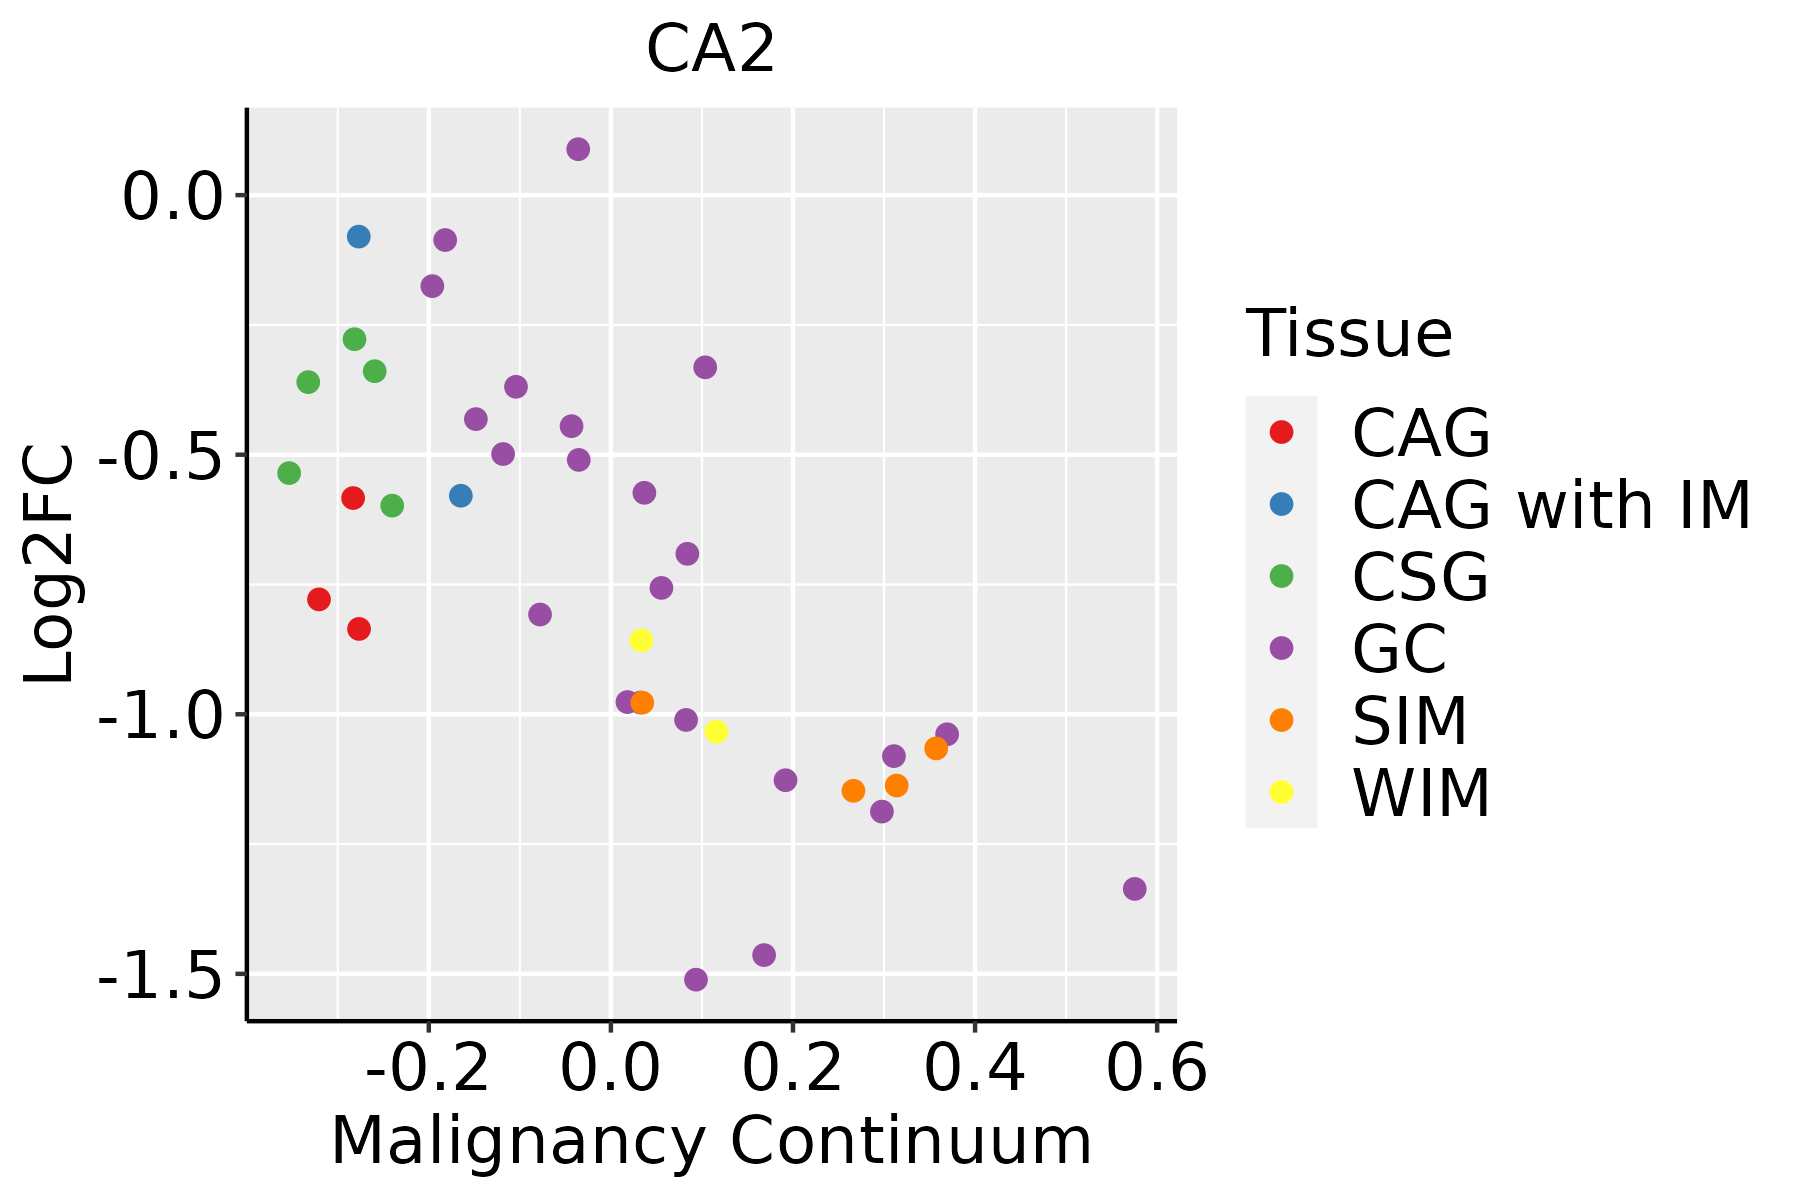 | CAG: Chronic atrophic gastritis |
| CAG with IM: Chronic atrophic gastritis with intestinal metaplasia | ||
| CSG: Chronic superficial gastritis | ||
| GC: Gastric cancer | ||
| SIM: Severe intestinal metaplasia | ||
| WIM: Wild intestinal metaplasia | ||
| Liver | 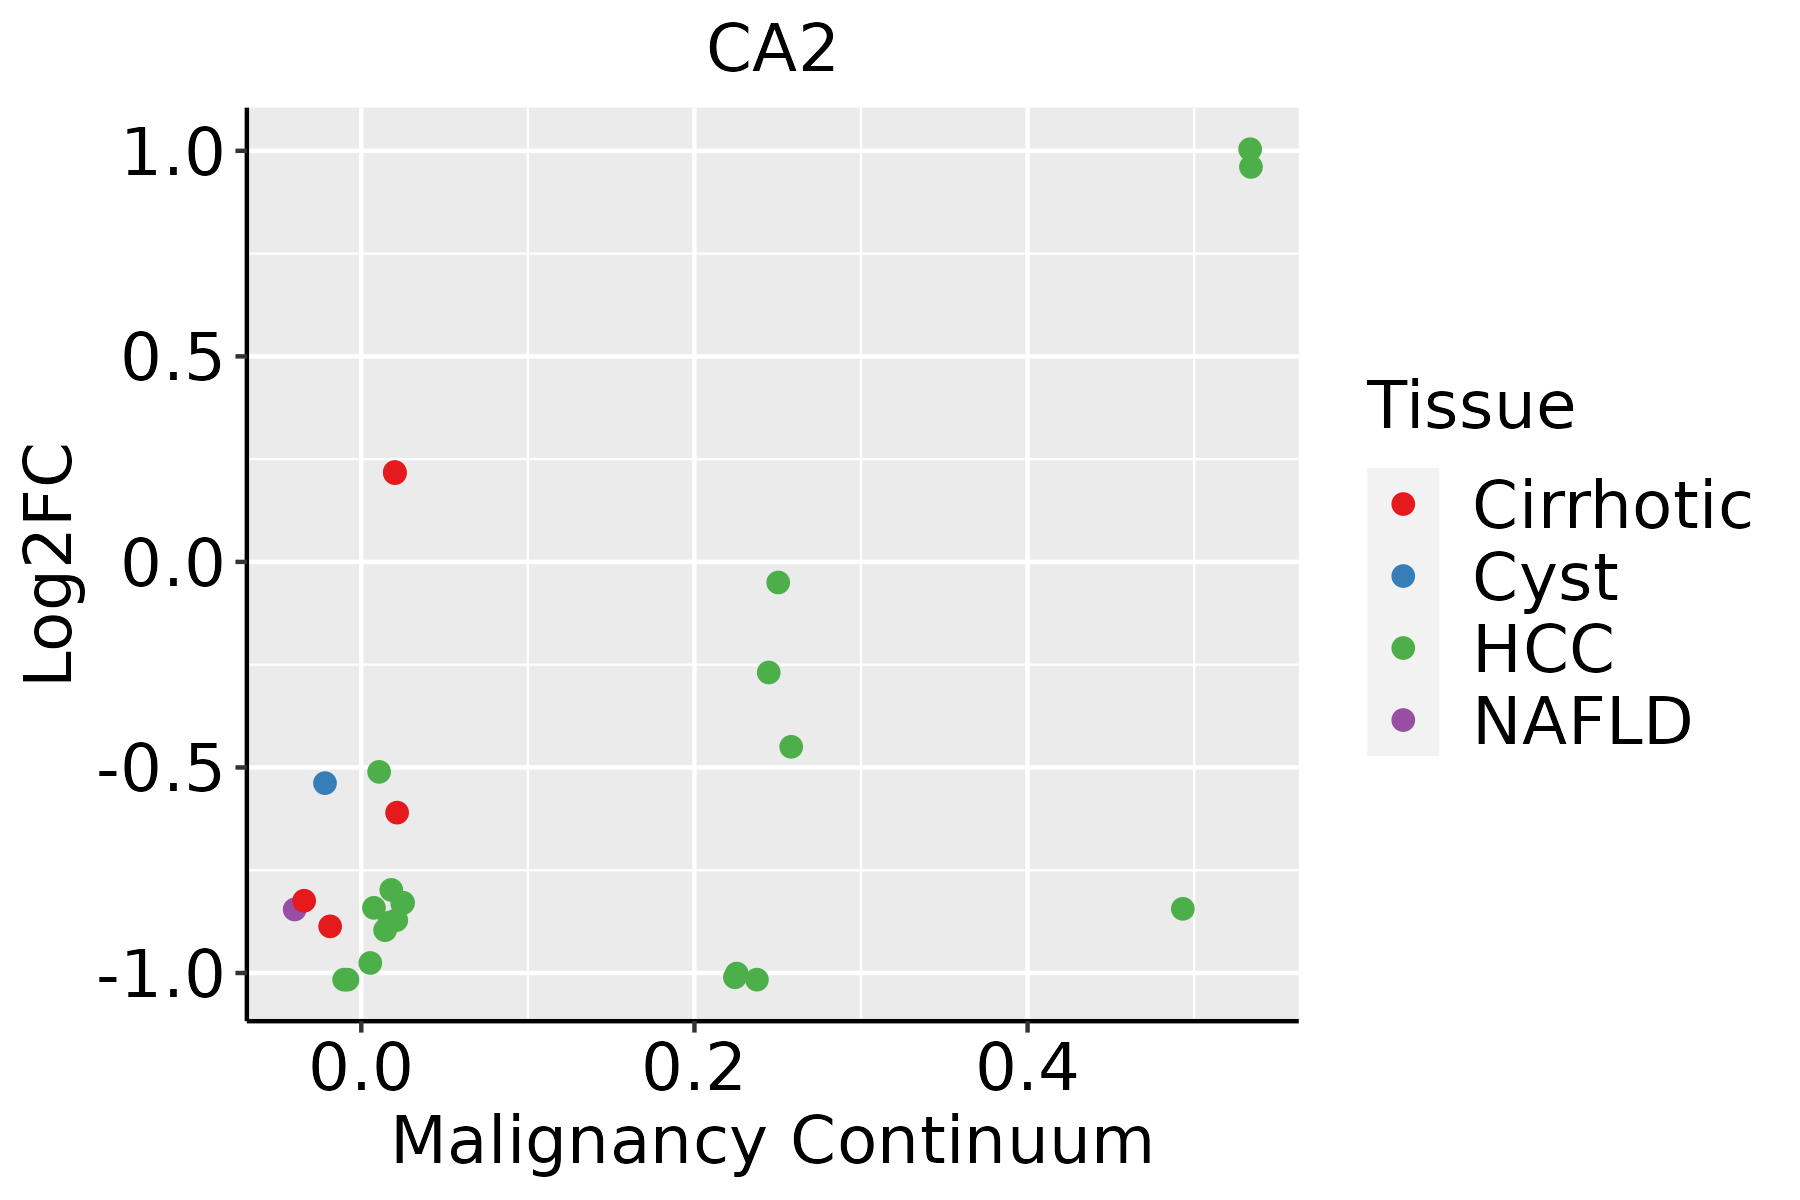 | HCC: Hepatocellular carcinoma |
| NAFLD: Non-alcoholic fatty liver disease | ||
| Oral Cavity | 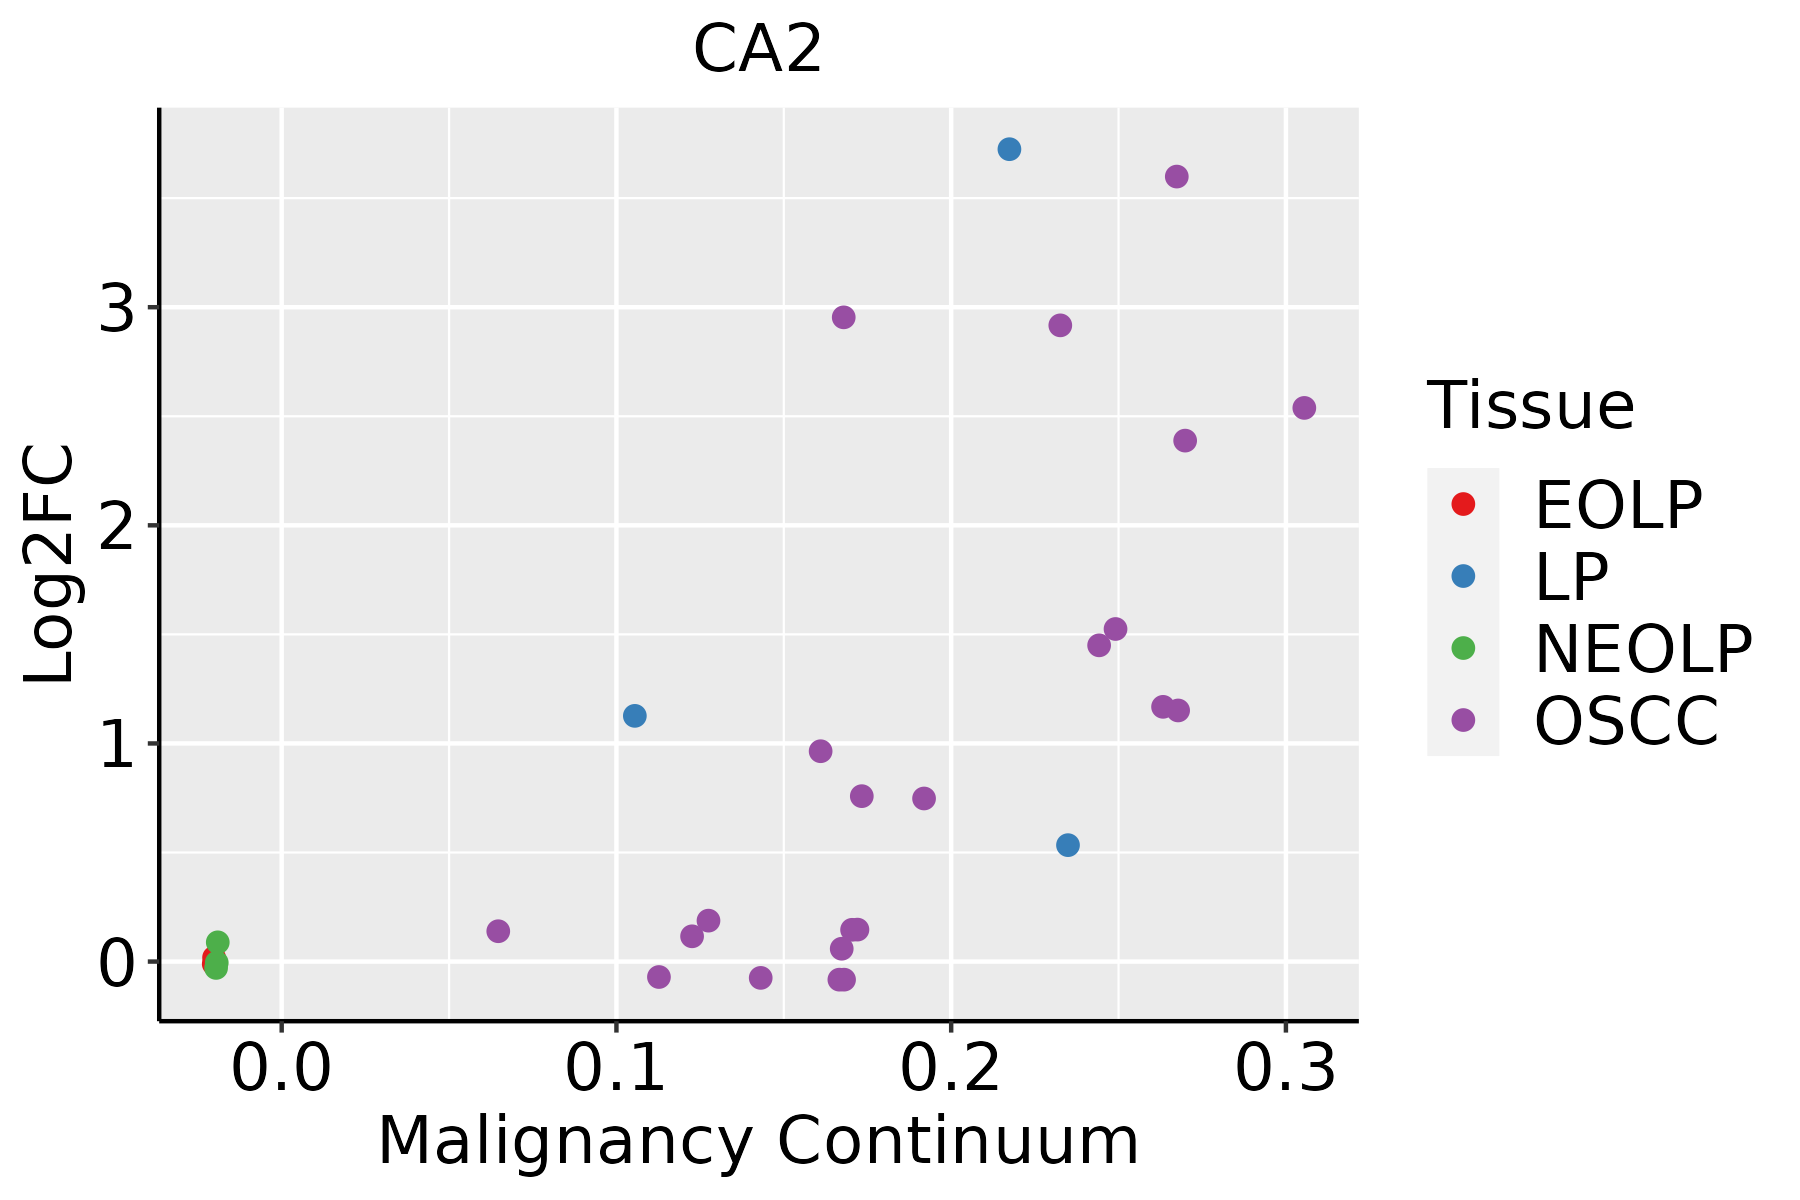 | EOLP: Erosive Oral lichen planus |
| LP: leukoplakia | ||
| NEOLP: Non-erosive oral lichen planus | ||
| OSCC: Oral squamous cell carcinoma | ||
| Skin |  | AK: Actinic keratosis |
| cSCC: Cutaneous squamous cell carcinoma | ||
| SCCIS:squamous cell carcinoma in situ |
| ∗log2FC in expression of this searched gene in stem-like cells from each diseased tissue sample relative to stem-like cells in normal samples in each tissue plotted against the malignancy continuum. Samples are colored based on if they are from different disease stage. |
Top |
Malignant transformation related pathway analysis |
| Find out the enriched GO biological processes and KEGG pathways involved in transition from healthy to precancer to cancer |
| Tissue | Disease Stage | Enriched GO biological Processes |
| Colorectum | AD |  |
| Colorectum | SER |  |
| Colorectum | MSS |  |
| Colorectum | MSI-H |  |
| Colorectum | FAP |  |
| ∗Top 15 enriched GO BP terms are showed in the bar plot of each disease state in each tissue. Each row represents a significant GO biological process which is colored according to the -log10(p.adjust). |
| Page: 1 2 3 4 5 6 7 8 9 |
| GO ID | Tissue | Disease Stage | Description | Gene Ratio | Bg Ratio | pvalue | p.adjust | Count |
| GO:0009165 | Colorectum | AD | nucleotide biosynthetic process | 79/3918 | 254/18723 | 8.33e-05 | 1.30e-03 | 79 |
| GO:0060249 | Colorectum | AD | anatomical structure homeostasis | 94/3918 | 314/18723 | 9.37e-05 | 1.42e-03 | 94 |
| GO:0001894 | Colorectum | AD | tissue homeostasis | 81/3918 | 268/18723 | 1.96e-04 | 2.62e-03 | 81 |
| GO:0010038 | Colorectum | AD | response to metal ion | 106/3918 | 373/18723 | 3.22e-04 | 3.83e-03 | 106 |
| GO:0006730 | Colorectum | AD | one-carbon metabolic process | 18/3918 | 40/18723 | 5.36e-04 | 5.74e-03 | 18 |
| GO:0030004 | Colorectum | AD | cellular monovalent inorganic cation homeostasis | 36/3918 | 103/18723 | 6.80e-04 | 6.95e-03 | 36 |
| GO:0015833 | Colorectum | AD | peptide transport | 77/3918 | 264/18723 | 8.90e-04 | 8.60e-03 | 77 |
| GO:0030641 | Colorectum | AD | regulation of cellular pH | 29/3918 | 81/18723 | 1.42e-03 | 1.22e-02 | 29 |
| GO:0062012 | Colorectum | AD | regulation of small molecule metabolic process | 93/3918 | 334/18723 | 1.46e-03 | 1.24e-02 | 93 |
| GO:0090087 | Colorectum | AD | regulation of peptide transport | 60/3918 | 202/18723 | 1.94e-03 | 1.58e-02 | 60 |
| GO:1903706 | Colorectum | AD | regulation of hemopoiesis | 99/3918 | 367/18723 | 3.08e-03 | 2.28e-02 | 99 |
| GO:0045637 | Colorectum | AD | regulation of myeloid cell differentiation | 61/3918 | 210/18723 | 3.17e-03 | 2.35e-02 | 61 |
| GO:0042886 | Colorectum | AD | amide transport | 83/3918 | 301/18723 | 3.37e-03 | 2.46e-02 | 83 |
| GO:0002573 | Colorectum | AD | myeloid leukocyte differentiation | 60/3918 | 208/18723 | 4.03e-03 | 2.81e-02 | 60 |
| GO:0051453 | Colorectum | AD | regulation of intracellular pH | 26/3918 | 75/18723 | 4.04e-03 | 2.82e-02 | 26 |
| GO:0045981 | Colorectum | AD | positive regulation of nucleotide metabolic process | 17/3918 | 43/18723 | 4.15e-03 | 2.87e-02 | 17 |
| GO:1900544 | Colorectum | AD | positive regulation of purine nucleotide metabolic process | 17/3918 | 43/18723 | 4.15e-03 | 2.87e-02 | 17 |
| GO:0006885 | Colorectum | AD | regulation of pH | 30/3918 | 91/18723 | 4.95e-03 | 3.32e-02 | 30 |
| GO:0071498 | Colorectum | AD | cellular response to fluid shear stress | 10/3918 | 21/18723 | 5.71e-03 | 3.64e-02 | 10 |
| GO:0055067 | Colorectum | AD | monovalent inorganic cation homeostasis | 45/3918 | 151/18723 | 6.19e-03 | 3.88e-02 | 45 |
| Page: 1 2 3 4 5 6 7 8 9 10 11 12 13 14 15 16 17 18 19 20 21 22 23 24 25 26 27 28 29 30 31 32 33 34 35 36 37 38 39 40 41 42 43 44 45 46 47 48 49 50 |
| Pathway ID | Tissue | Disease Stage | Description | Gene Ratio | Bg Ratio | pvalue | p.adjust | qvalue | Count |
| hsa0497114 | Breast | Precancer | Gastric acid secretion | 13/684 | 76/8465 | 7.35e-03 | 4.07e-02 | 3.12e-02 | 13 |
| hsa0497115 | Breast | Precancer | Gastric acid secretion | 13/684 | 76/8465 | 7.35e-03 | 4.07e-02 | 3.12e-02 | 13 |
| hsa0497122 | Breast | IDC | Gastric acid secretion | 16/867 | 76/8465 | 3.80e-03 | 2.33e-02 | 1.74e-02 | 16 |
| hsa0497132 | Breast | IDC | Gastric acid secretion | 16/867 | 76/8465 | 3.80e-03 | 2.33e-02 | 1.74e-02 | 16 |
| hsa0497142 | Breast | DCIS | Gastric acid secretion | 16/846 | 76/8465 | 2.97e-03 | 1.81e-02 | 1.33e-02 | 16 |
| hsa0497152 | Breast | DCIS | Gastric acid secretion | 16/846 | 76/8465 | 2.97e-03 | 1.81e-02 | 1.33e-02 | 16 |
| hsa04971 | Colorectum | AD | Gastric acid secretion | 29/2092 | 76/8465 | 6.25e-03 | 2.68e-02 | 1.71e-02 | 29 |
| hsa04972 | Colorectum | AD | Pancreatic secretion | 36/2092 | 102/8465 | 1.06e-02 | 3.98e-02 | 2.54e-02 | 36 |
| hsa04964 | Colorectum | AD | Proximal tubule bicarbonate reclamation | 11/2092 | 23/8465 | 1.35e-02 | 4.86e-02 | 3.10e-02 | 11 |
| hsa049711 | Colorectum | AD | Gastric acid secretion | 29/2092 | 76/8465 | 6.25e-03 | 2.68e-02 | 1.71e-02 | 29 |
| hsa049721 | Colorectum | AD | Pancreatic secretion | 36/2092 | 102/8465 | 1.06e-02 | 3.98e-02 | 2.54e-02 | 36 |
| hsa049641 | Colorectum | AD | Proximal tubule bicarbonate reclamation | 11/2092 | 23/8465 | 1.35e-02 | 4.86e-02 | 3.10e-02 | 11 |
| hsa049712 | Colorectum | SER | Gastric acid secretion | 27/1580 | 76/8465 | 3.65e-04 | 3.27e-03 | 2.38e-03 | 27 |
| hsa049642 | Colorectum | SER | Proximal tubule bicarbonate reclamation | 10/1580 | 23/8465 | 5.33e-03 | 3.28e-02 | 2.38e-02 | 10 |
| hsa049722 | Colorectum | SER | Pancreatic secretion | 30/1580 | 102/8465 | 5.41e-03 | 3.28e-02 | 2.38e-02 | 30 |
| hsa049713 | Colorectum | SER | Gastric acid secretion | 27/1580 | 76/8465 | 3.65e-04 | 3.27e-03 | 2.38e-03 | 27 |
| hsa049643 | Colorectum | SER | Proximal tubule bicarbonate reclamation | 10/1580 | 23/8465 | 5.33e-03 | 3.28e-02 | 2.38e-02 | 10 |
| hsa049723 | Colorectum | SER | Pancreatic secretion | 30/1580 | 102/8465 | 5.41e-03 | 3.28e-02 | 2.38e-02 | 30 |
| hsa049714 | Colorectum | MSS | Gastric acid secretion | 27/1875 | 76/8465 | 5.20e-03 | 2.18e-02 | 1.34e-02 | 27 |
| hsa049724 | Colorectum | MSS | Pancreatic secretion | 33/1875 | 102/8465 | 1.09e-02 | 3.75e-02 | 2.30e-02 | 33 |
| Page: 1 2 |
Top |
Cell-cell communication analysis |
| Identification of potential cell-cell interactions between two cell types and their ligand-receptor pairs for different disease states |
| Ligand | Receptor | LRpair | Pathway | Tissue | Disease Stage |
| Page: 1 |
Top |
Single-cell gene regulatory network inference analysis |
| Find out the significant the regulons (TFs) and the target genes of each regulon across cell types for different disease states |
| TF | Cell Type | Tissue | Disease Stage | Target Gene | RSS | Regulon Activity |
| ∗The dot plots of a searched regulon are shown for all cell subpopulations in each disease state of each tissue based on the regulon specific score inferred using pySCENIC and by calculating the average expression. |
| Page: 1 |
Top |
Somatic mutation of malignant transformation related genes |
| Annotation of somatic variants for genes involved in malignant transformation |
| Hugo Symbol | Variant Class | Variant Classification | dbSNP RS | HGVSc | HGVSp | HGVSp Short | SWISSPROT | BIOTYPE | SIFT | PolyPhen | Tumor Sample Barcode | Tissue | Histology | Sex | Age | Stage | Therapy Types | Drugs | Outcome |
| CA2 | SNV | Missense_Mutation | novel | c.744N>T | p.Gln248His | p.Q248H | P00918 | protein_coding | deleterious(0) | probably_damaging(0.989) | TCGA-AQ-A54O-01 | Breast | breast invasive carcinoma | Male | <65 | I/II | Chemotherapy | adriamycin | CR |
| CA2 | SNV | Missense_Mutation | c.544N>C | p.Gly182Arg | p.G182R | P00918 | protein_coding | tolerated(0.06) | benign(0.044) | TCGA-E2-A1AZ-01 | Breast | breast invasive carcinoma | Female | <65 | I/II | Chemotherapy | adriamycin | SD | |
| CA2 | SNV | Missense_Mutation | c.214G>A | p.Asp72Asn | p.D72N | P00918 | protein_coding | deleterious(0) | benign(0.023) | TCGA-FU-A23K-01 | Cervix | cervical & endocervical cancer | Female | <65 | III/IV | Unknown | Unknown | SD | |
| CA2 | SNV | Missense_Mutation | novel | c.398N>T | p.Ala133Val | p.A133V | P00918 | protein_coding | deleterious(0) | probably_damaging(0.983) | TCGA-AZ-4315-01 | Colorectum | colon adenocarcinoma | Male | <65 | I/II | Unknown | Unknown | SD |
| CA2 | SNV | Missense_Mutation | c.740N>T | p.Ala247Val | p.A247V | P00918 | protein_coding | tolerated(0.37) | benign(0) | TCGA-F4-6703-01 | Colorectum | colon adenocarcinoma | Male | <65 | I/II | Unknown | Unknown | SD | |
| CA2 | SNV | Missense_Mutation | c.288C>A | p.His96Gln | p.H96Q | P00918 | protein_coding | deleterious(0) | probably_damaging(1) | TCGA-F4-6807-01 | Colorectum | colon adenocarcinoma | Female | <65 | III/IV | Chemotherapy | xeloda | CR | |
| CA2 | SNV | Missense_Mutation | rs777088645 | c.676N>T | p.Arg226Cys | p.R226C | P00918 | protein_coding | deleterious(0) | probably_damaging(0.919) | TCGA-G4-6302-01 | Colorectum | colon adenocarcinoma | Female | >=65 | I/II | Unknown | Unknown | SD |
| CA2 | SNV | Missense_Mutation | rs555992309 | c.658N>A | p.Glu220Lys | p.E220K | P00918 | protein_coding | tolerated(0.23) | benign(0.018) | TCGA-EI-6882-01 | Colorectum | rectum adenocarcinoma | Male | <65 | I/II | Unknown | Unknown | SD |
| CA2 | deletion | Frame_Shift_Del | c.434delN | p.Leu147Ter | p.L147* | P00918 | protein_coding | TCGA-AA-3672-01 | Colorectum | colon adenocarcinoma | Female | >=65 | III/IV | Unknown | Unknown | SD | |||
| CA2 | insertion | Frame_Shift_Ins | rs763603775 | c.440dupT | p.Leu147PhefsTer7 | p.L147Ffs*7 | P00918 | protein_coding | TCGA-AA-A022-01 | Colorectum | colon adenocarcinoma | Female | >=65 | I/II | Unknown | Unknown | SD |
| Page: 1 2 3 4 5 |
Top |
Related drugs of malignant transformation related genes |
| Identification of chemicals and drugs interact with genes involved in malignant transfromation |
| (DGIdb 4.0) |
| Entrez ID | Symbol | Category | Interaction Types | Drug Claim Name | Drug Name | PMIDs |
| 760 | CA2 | DRUGGABLE GENOME, ENZYME | PARABEN | PARABEN | ||
| 760 | CA2 | DRUGGABLE GENOME, ENZYME | ACETAZOLAMIDE | ACETAZOLAMIDE | ||
| 760 | CA2 | DRUGGABLE GENOME, ENZYME | inhibitor | CHEMBL17 | DICHLORPHENAMIDE | |
| 760 | CA2 | DRUGGABLE GENOME, ENZYME | inhibitor | CHEMBL220491 | BRINZOLAMIDE | |
| 760 | CA2 | DRUGGABLE GENOME, ENZYME | BRINZOLAMIDE | BRINZOLAMIDE | ||
| 760 | CA2 | DRUGGABLE GENOME, ENZYME | Ethoxzolamide | ETHOXZOLAMIDE | ||
| 760 | CA2 | DRUGGABLE GENOME, ENZYME | Benzthiazide | BENZTHIAZIDE | ||
| 760 | CA2 | DRUGGABLE GENOME, ENZYME | COBALT | 107027 | ||
| 760 | CA2 | DRUGGABLE GENOME, ENZYME | TRICHLORMETHIAZIDE | TRICHLORMETHIAZIDE | ||
| 760 | CA2 | DRUGGABLE GENOME, ENZYME | Chlorothiazide | CHLOROTHIAZIDE |
| Page: 1 2 3 4 5 |

Copyright 2023-Present -The University of Texas Health Science Center at Houston |